Daily technical analysis and forecast for 26 January 2026
Here is a detailed daily technical analysis and forecast for EURUSD, USDJPY, GBPUSD, AUDUSD, USDCAD, XAUUSD, and Brent for 26 January 2026.
EURUSD forecast
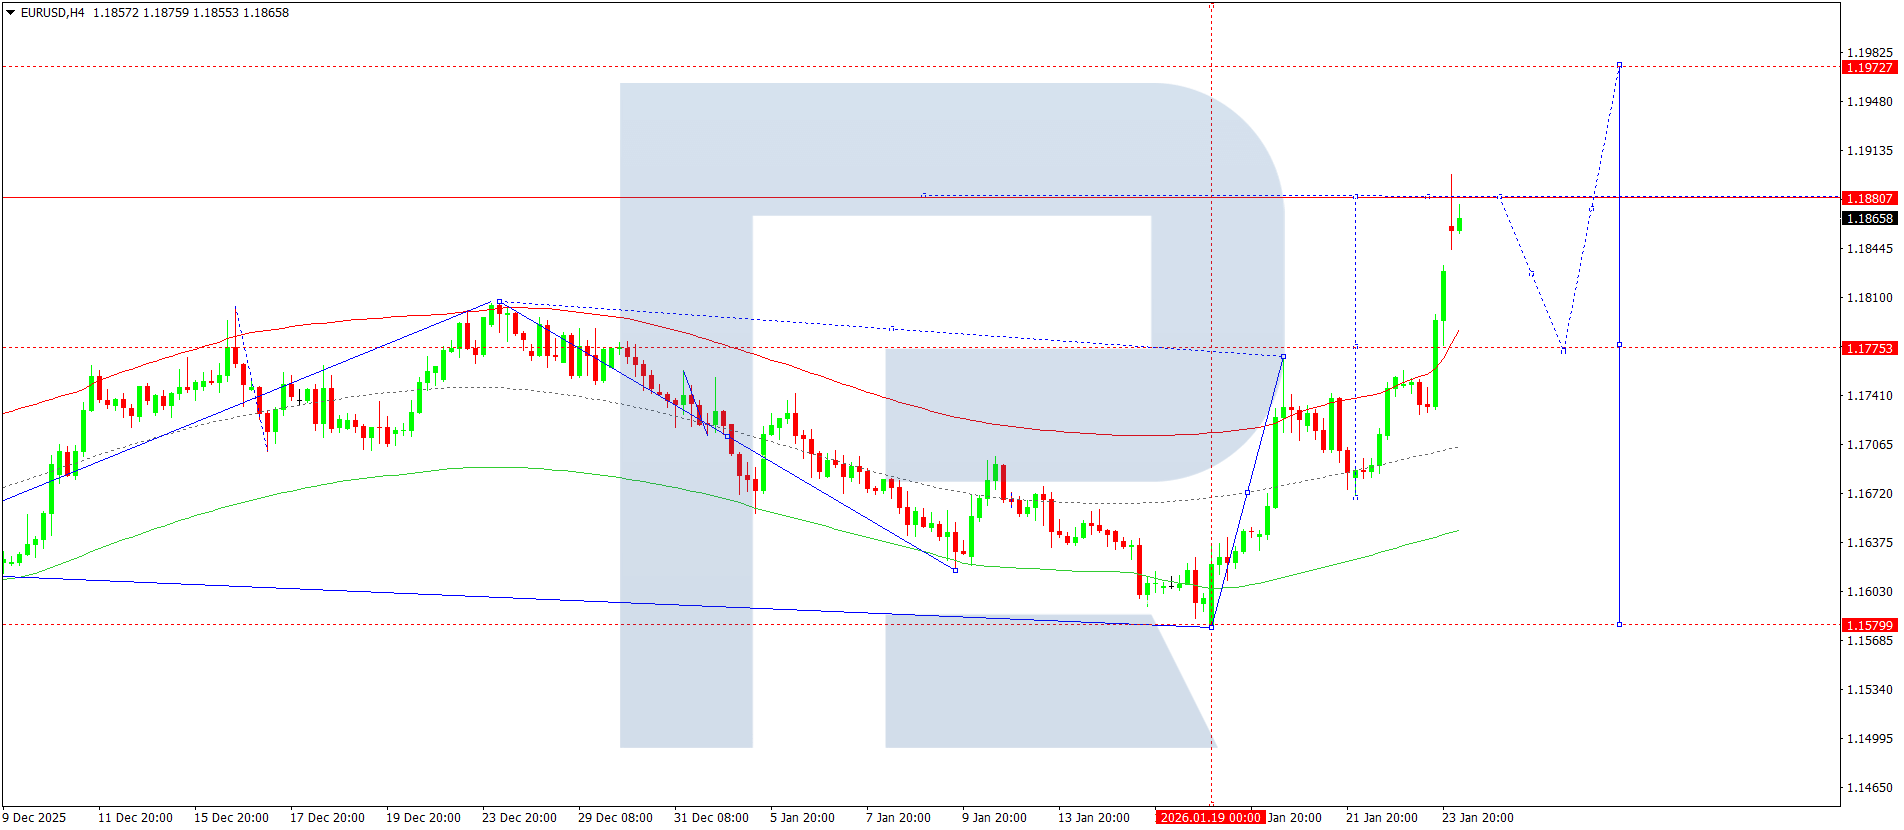
On the EURUSD H4 chart, the market has broken above 1.1888 and is forming a consolidation range below this level. Today, 26 January 2026, a corrective move to the 1.1777 level is possible. Further, growth towards the 1.1833 level is expected.
Technically, this scenario is confirmed by the indicated Elliott wave structure and the upward wave matrix with a pivot point at 1.1680. This level is considered key in the structure of the upward wave for EURUSD. At the moment, the market has started to form a downward wave towards the lower boundary of the Price Envelope at 1.1777, with further growth towards the 1.1833 level expected later today.
Technical indicators for today’s EURUSD forecast suggest a continued move down to the 1.1777 level.
USDJPY forecast
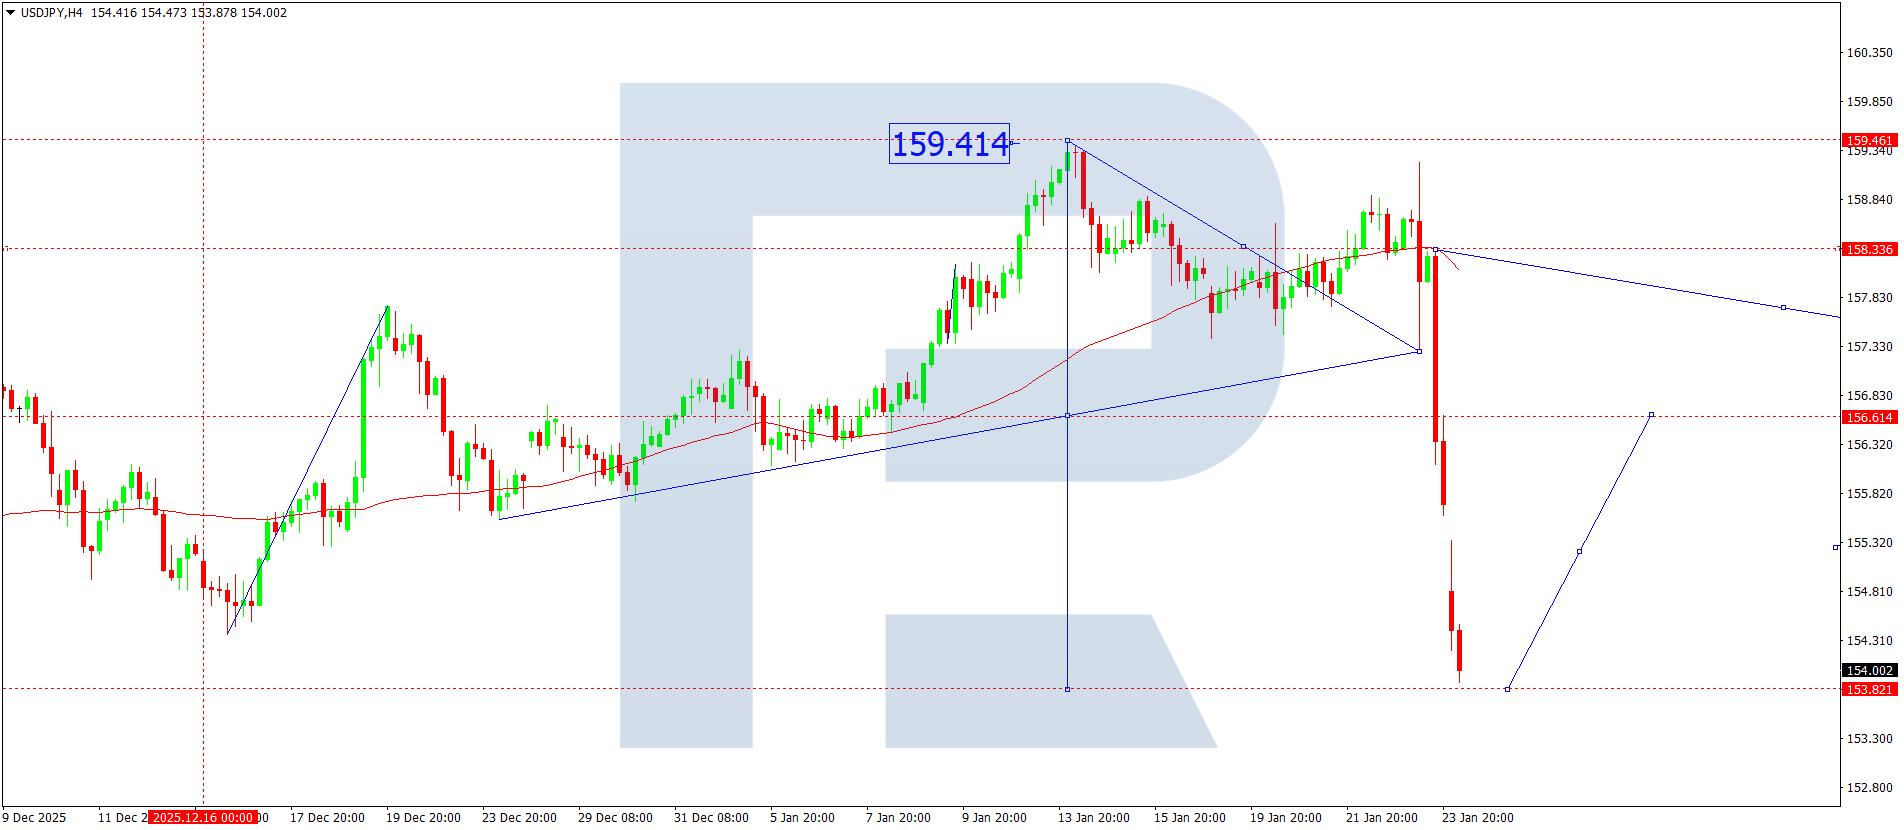
On the USDJPY H4 chart, the market has broken below 156.66 and continues to develop a wave towards the 153.82 level. Today, 26 January 2026, the pair is expected to reach this target level. Further, growth towards the 156.60 level is possible, followed by a decline to 155.55.
Technically, this scenario for USDJPY is confirmed by the indicated Elliott wave structure and the upward wave matrix with a pivot point at 158.00. This level is considered key in the structure of this wave. At the moment, the market is forming a consolidation range around the central line of the Price Envelope at 156.60. A decline towards its lower boundary at 153.82 cannot be ruled out. After that, growth towards its central line at 155.00 is expected, potentially extending towards its upper boundary at 156.66.
Technical indicators for today’s USDJPY forecast suggest a decline to the 153.80 level.
GBPUSD forecast
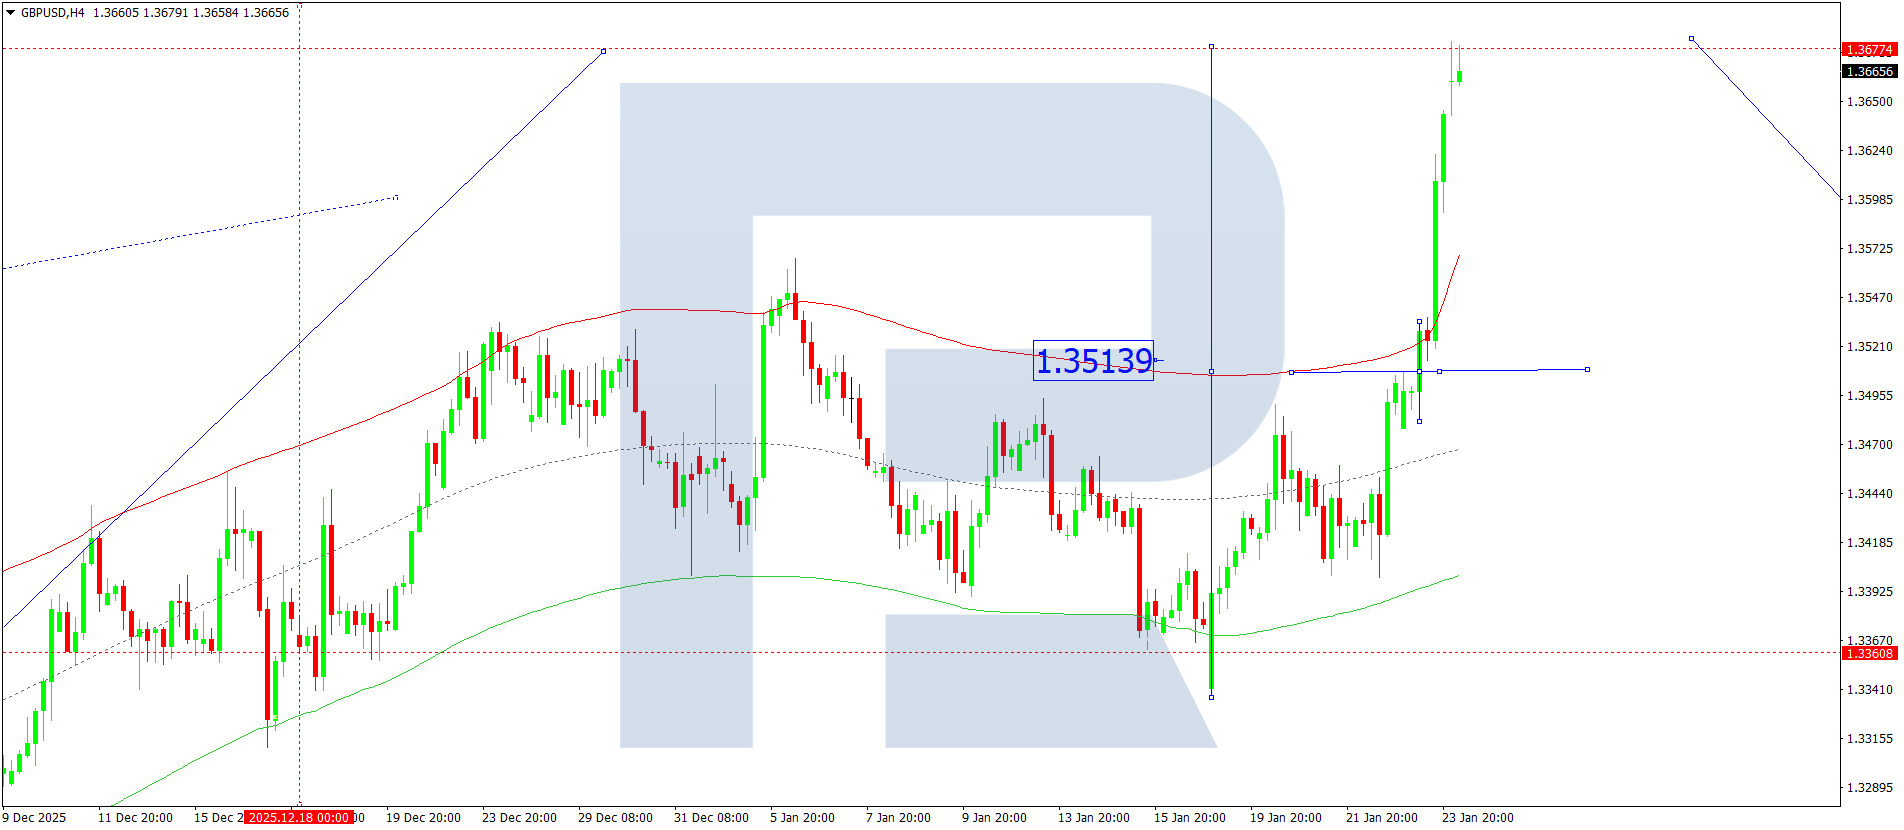
On the GBPUSD H4 chart, the market completed an upward wave to the 1.3677 level. Today, 26 January 2026, a downward wave towards 1.3590 is expected. A breakout below this level would open the potential for a wave towards 1.3511.
Technically, this scenario for GBPUSD is confirmed by the indicated Elliott wave structure and the upward wave matrix with a pivot point at 1.3455. This level is considered key in the structure of this wave. Today, a downward wave towards the lower boundary of the Price Envelope at 1.3535 is possible. Further, an upward move towards its central line at 1.3600 cannot be ruled out, possibly continuing towards its upper boundary at 1.3560.
Technical indicators for today’s GBPUSD forecast suggest a downward wave towards the 1.3511 level.
AUDUSD forecast
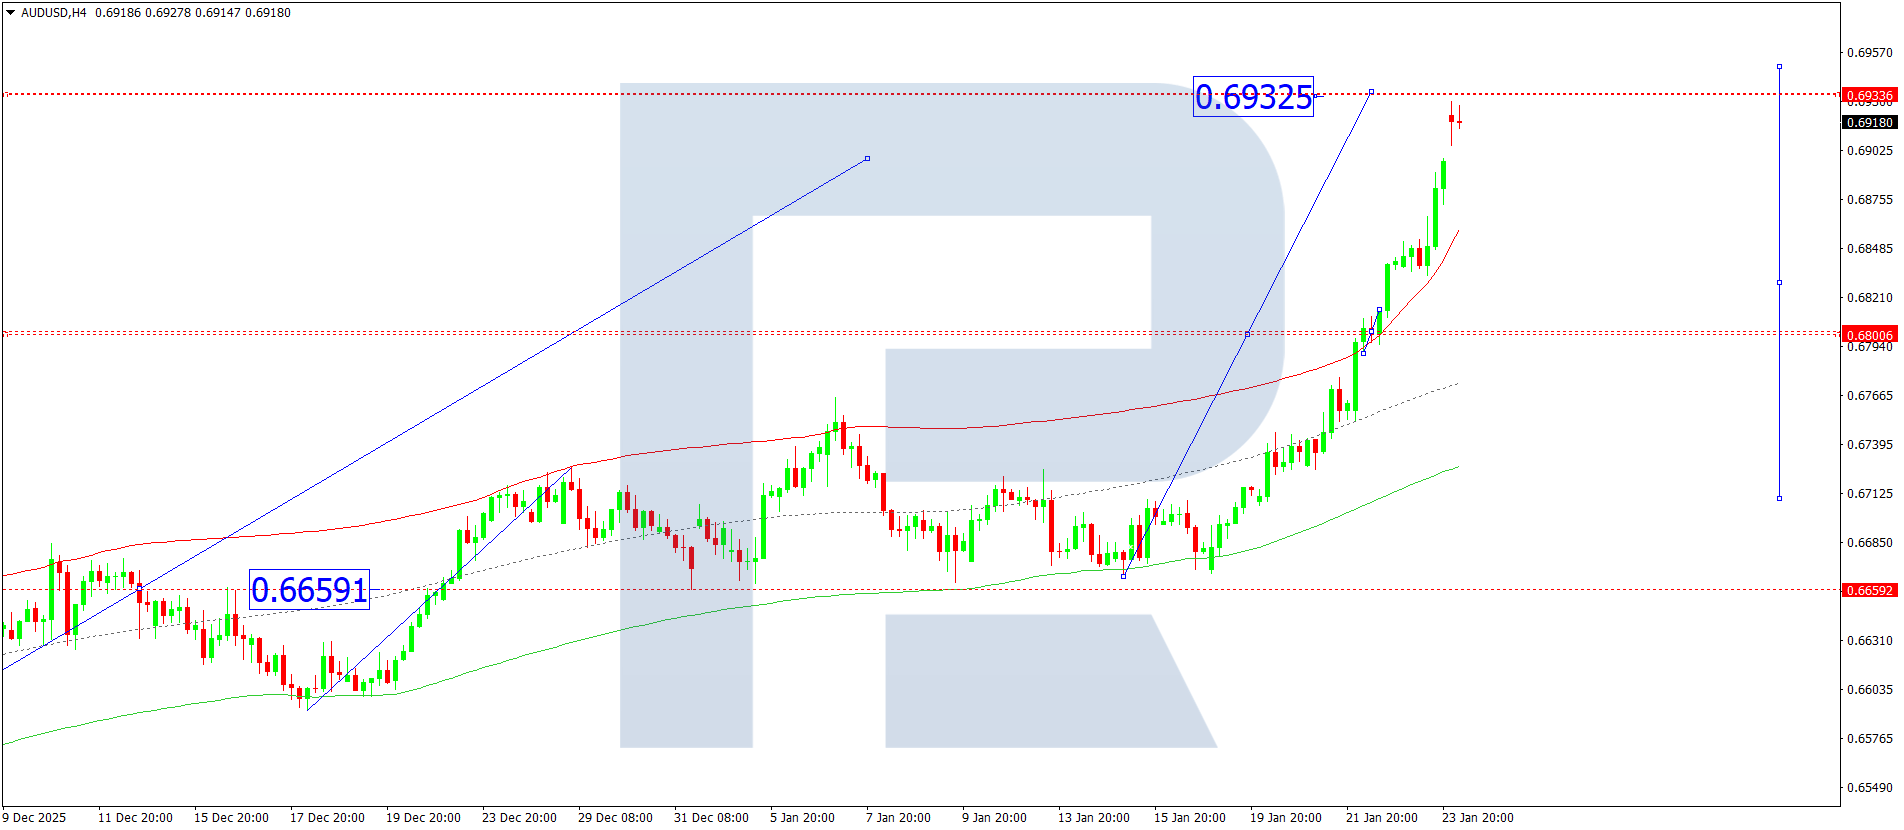
On the AUDUSD H4 chart, the market continues to rise towards the 0.6930 level. Today, 26 January 2026, the pair is expected to reach this target level. After that, a downward wave towards the 0.6840 level could start, followed by growth towards the 0.6900 level.
Technically, this scenario is confirmed by the indicated Elliott wave structure and the upward wave matrix for AUDUSD with a pivot point at 0.6666. This level is considered key in the structure of this wave. At the moment, the market is forming a wave towards the upper boundary of the Price Envelope at 0.6930. Further decline towards its lower boundary at 0.6840 is expected.
Technical indicators for today’s AUDUSD forecast suggest the start of a decline to the 0.6840 level.
USDCAD forecast
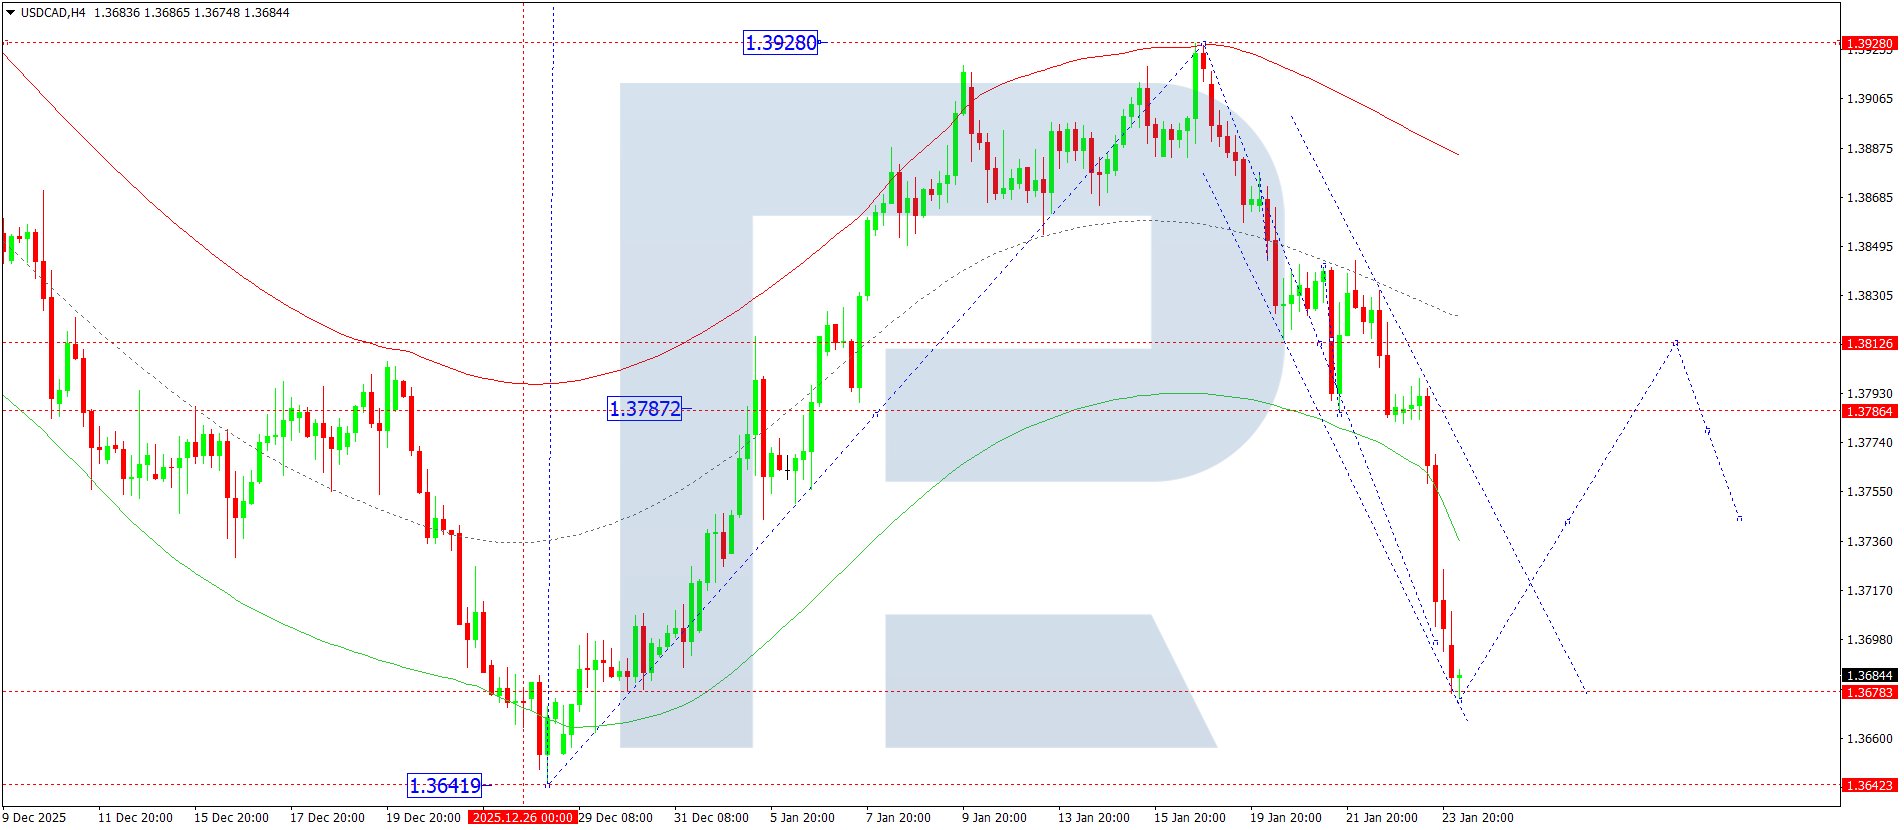
On the USDCAD H4 chart, the market completed a downward wave to the 1.3680 level. Today, 26 January 2026, an upward wave towards the 1.3830 level is expected. Further, a decline to the 1.3700 level could follow.
Technically, this scenario is confirmed by the indicated Elliott wave structure and the downward wave matrix with a pivot point at 1.3833. This level is considered key for USDCAD in the structure of this wave. At the moment, the market completed a correction towards the lower boundary of the Price Envelope at 1.3580. Further growth towards its upper boundary at 1.3830 is expected.
Technical indicators for today’s USDCAD forecast suggest the start of growth towards the 1.3830 level.
XAUUSD forecast
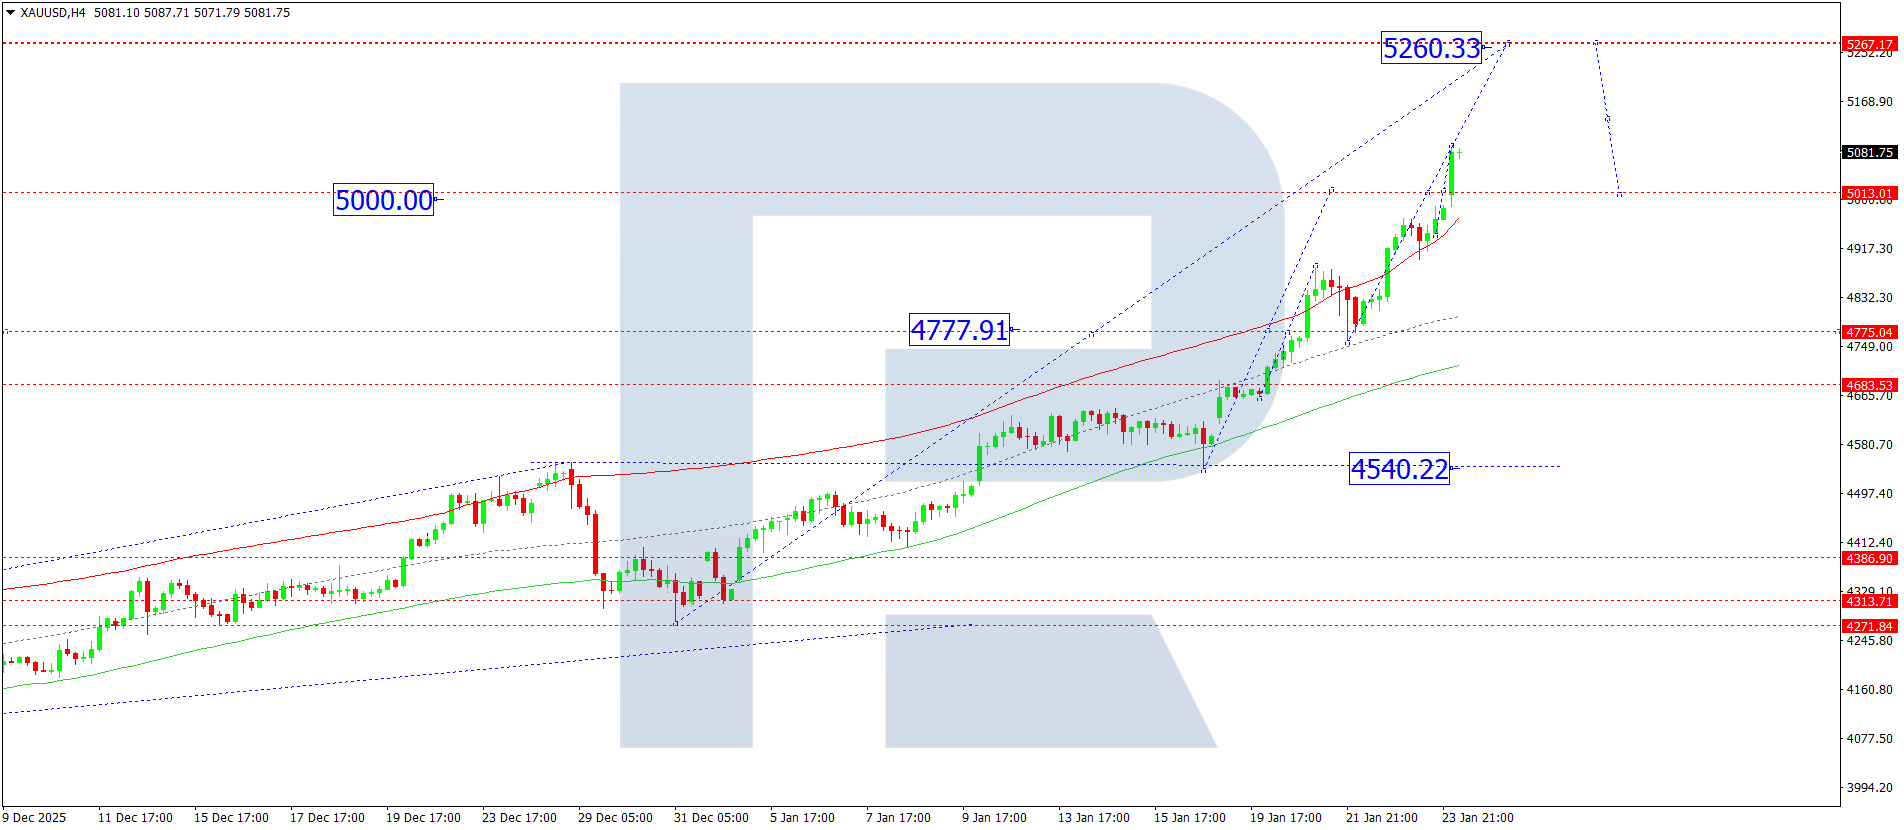
On the XAUUSD H4 chart, the market is forming an upward wave towards the 5,090 level. Today, 26 January 2026, a decline to the 5,011 level is expected. Further, an upward move towards the 5,090 level cannot be ruled out. A breakout above this level would open the door to a wave towards 5,150.
Technically, this scenario is confirmed by the indicated Elliott wave structure and the upward wave matrix with a pivot point at 4,500. This level is considered key for XAUUSD in this wave. At the moment, the market is performing the fifth upward wave towards the upper boundary of the Price Envelope at 5,090. After reaching this level, a corrective move towards its central line at 5,000 is expected.
Technical indicators for today’s XAUUSD forecast suggest a correction towards the 5,000 level.
Brent forecast
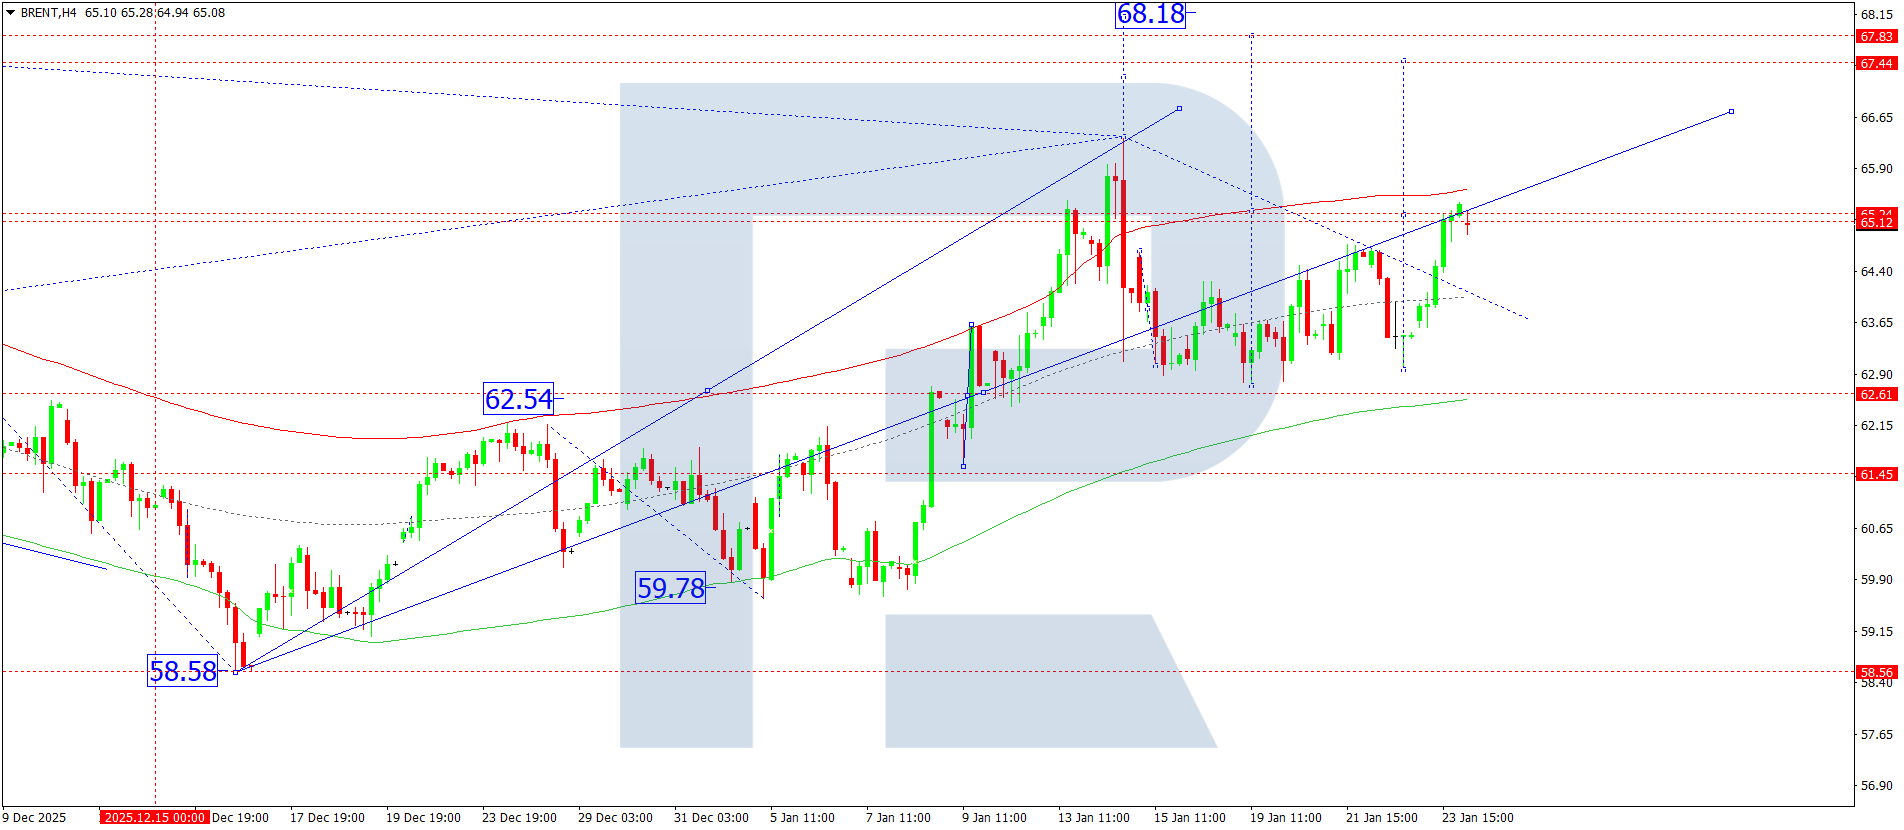
On the Brent H4 chart, the market is forming a consolidation range around the 65.80 level. Today, 26 January 2026, an upward wave towards 67.70 is possible. If this level is broken to the upside, potential opens for a continued move towards 69.75.
Technically, this scenario is confirmed by the indicated Elliott wave structure and the upward wave matrix with a pivot point at the 63.20 level. This level is considered key for Brent in this wave. At the moment, the market is forming an upward move towards the central line of the Price Envelope at 65.25. Further, growth could continue towards its upper boundary at 66.75, possibly extending towards the 69.00 level.
Technical indicators for today’s Brent forecast suggest a rise towards the 66.75 level.
Editors’ picks
 EURUSD 2026-2027 forecast: key market trends and future predictions
This article provides the EURUSD forecast for 2026 and 2027 and highlights the main factors determining the direction of the pair’s movements. We will apply technical analysis, take into account the opinions of leading experts, large banks, and financial institutions, and study AI-based forecasts. This comprehensive insight into EURUSD predictions should help investors and traders make informed decisions.
 Gold (XAUUSD) forecast 2026 and beyond: expert insights, price predictions, and analysis
Dive deep into the Gold (XAUUSD) price outlook for 2026 and beyond, combining technical analysis, expert forecasts, and key macroeconomic factors. It explains the drivers behind gold’s recent surge, explores potential scenarios including a move toward 4,500 to 5,000 USD per ounce, and highlights why the metal remains a strong hedge during global uncertainty.
Forecasts presented in this section only reflect the author’s private opinion and should not be considered as guidance for trading. RoboForex bears no responsibility for trading results based on trading recommendations described in these analytical reviews.