Daily technical analysis and forecast for 9 February 2026
Here is a detailed daily technical analysis and forecast for EURUSD, USDJPY, GBPUSD, AUDUSD, USDCAD, XAUUSD, and Brent for 9 February 2026.
EURUSD forecast
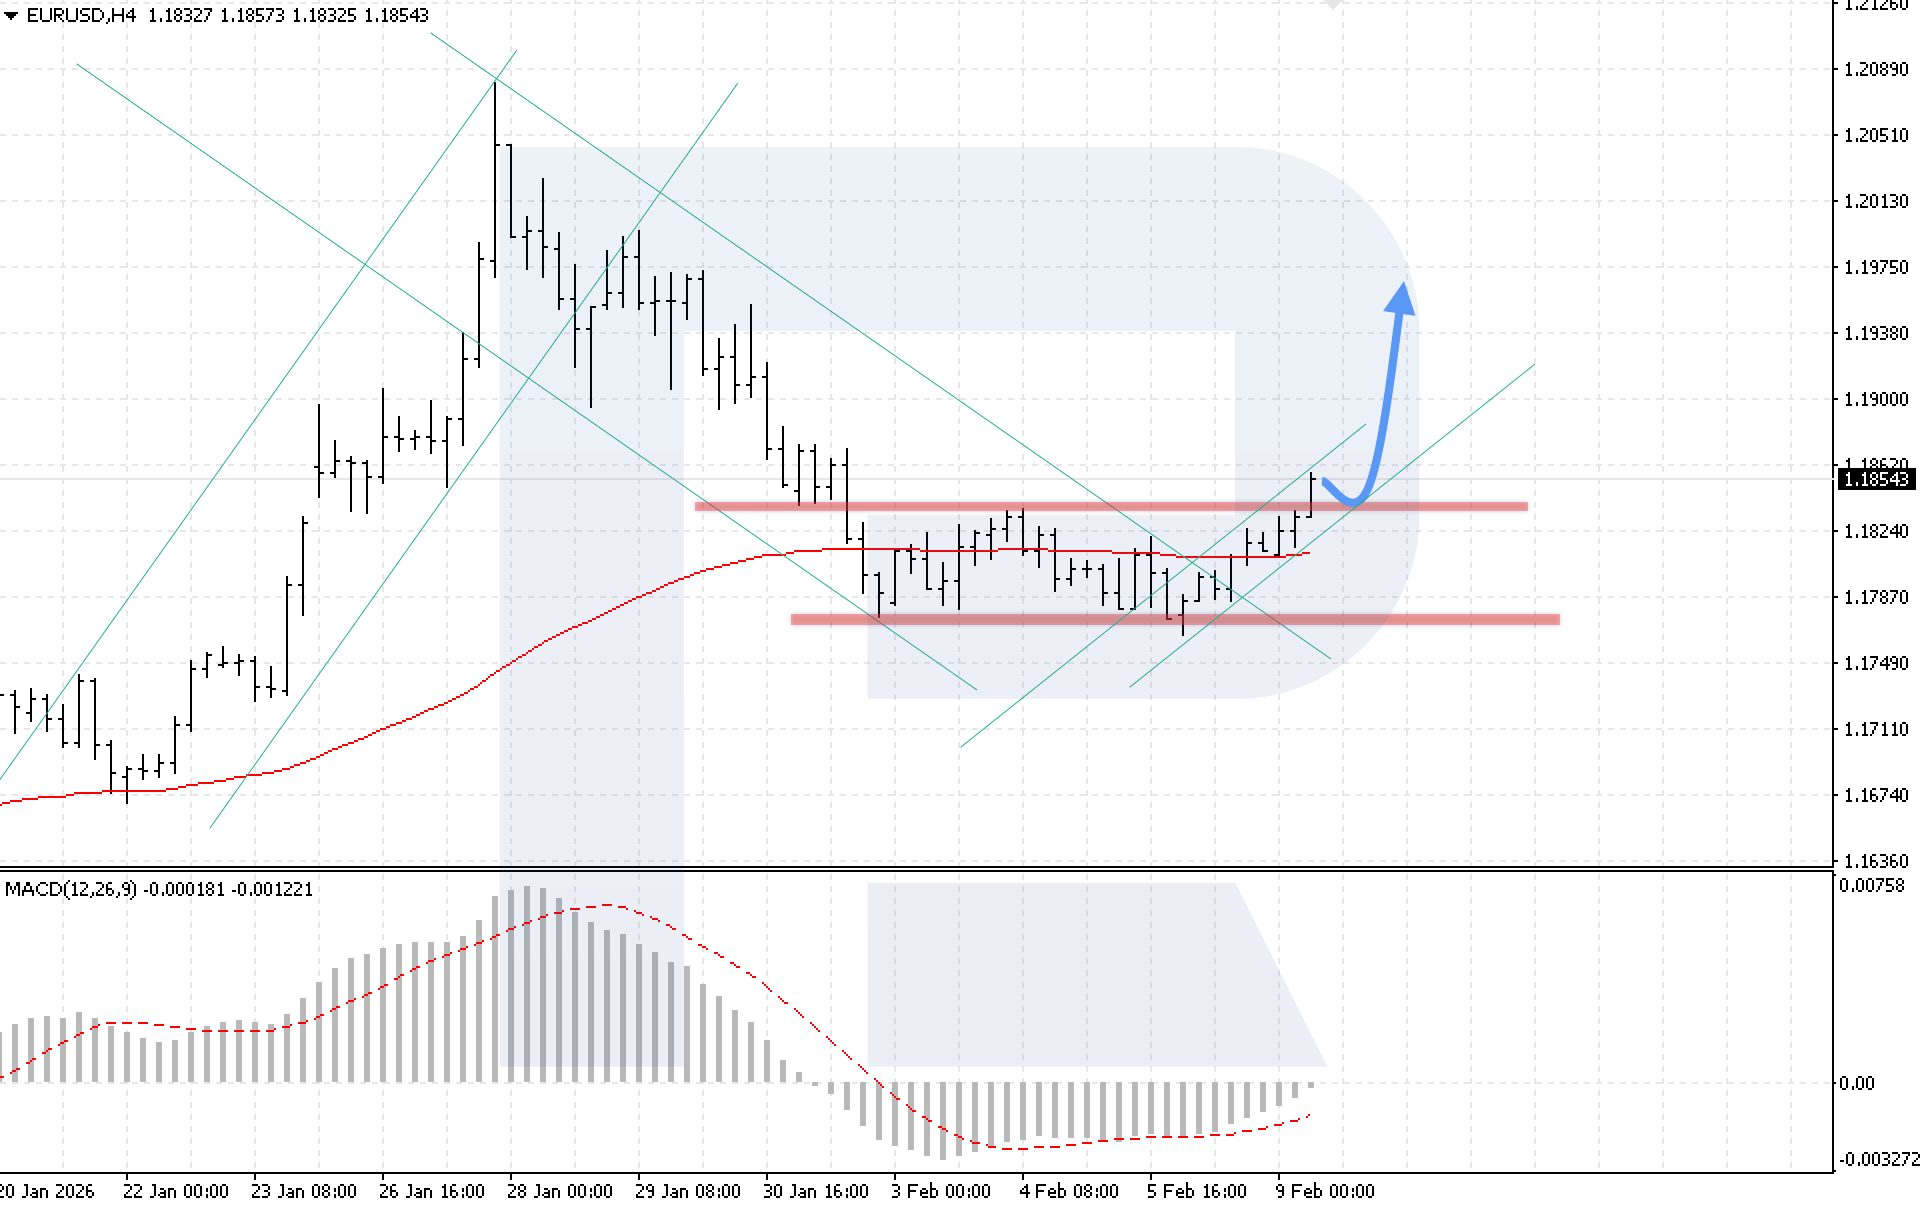
On the EURUSD H4 chart, the market formed an upward wave, after which the price consolidated above the upper boundary of the Double Bottom reversal pattern. Today, 9 February 2026, the baseline scenario suggests a rebound from the 1.1835 support level and the formation of a new bullish wave, with a target at 1.1975 following the reversal pattern signal.
The technical picture confirms this scenario. The MACD indicator shows histogram growth and is approaching the zero line, a crossover of which will signal an acceleration of the upward momentum. The key technical condition for further growth remains confident price consolidation above the 1.1865 level.
The alternative scenario will activate if the price declines below 1.1815. This signal will indicate a breakout below the support level and form conditions for a continued decline towards 1.1765.
USDJPY forecast
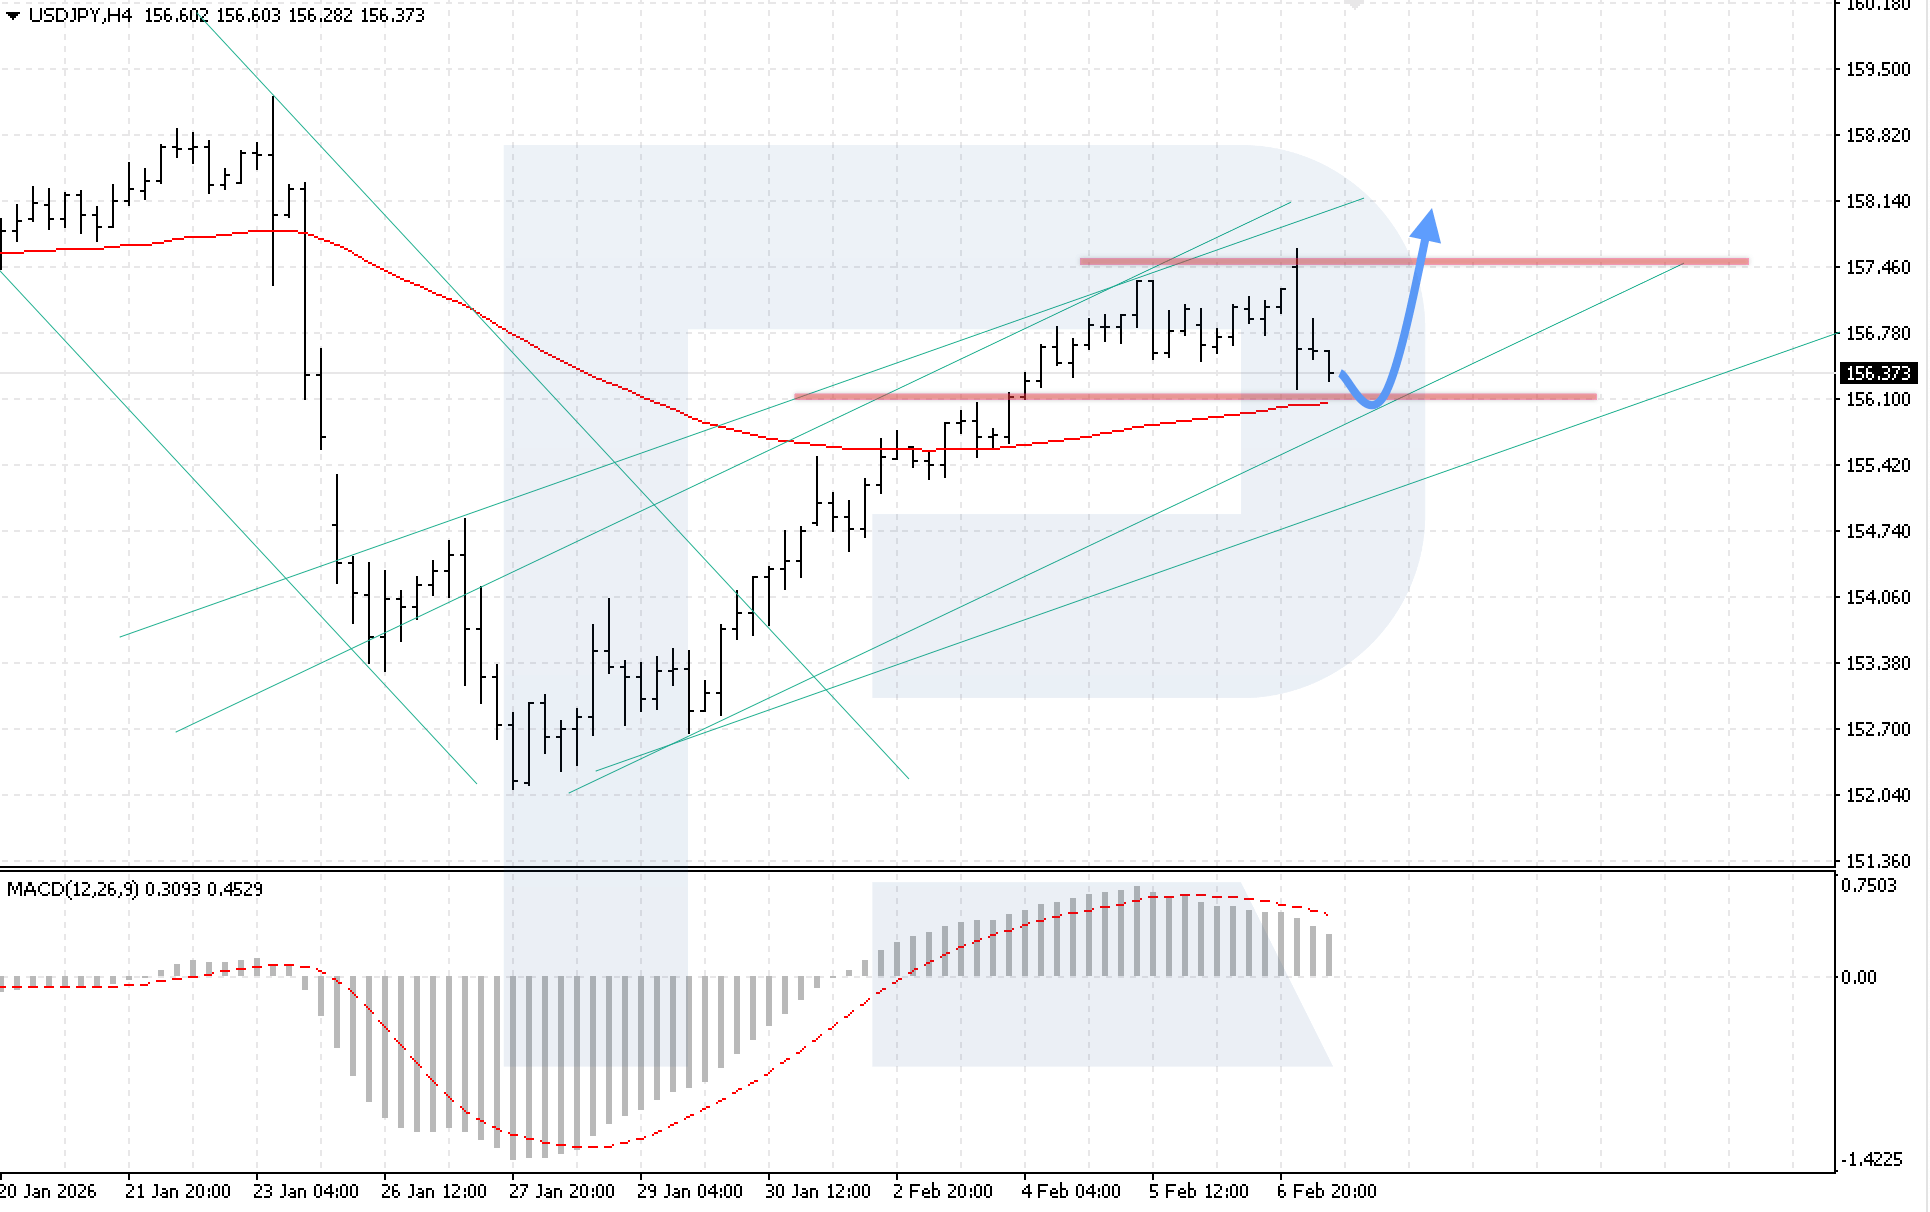
On the USDJPY H4 chart, the market is in a bearish correction phase; however, buyers are holding prices above the EMA-85, preserving the potential for a resumption of the upward movement. The nearest support zone is located in the 156.0 area. Today, 9 February 2026, the baseline scenario suggests renewed growth, with a target at 158.15.
The technical picture confirms this scenario. The MACD indicator shows a slowdown in the histogram decline, indicating easing selling pressure and increasing buyer activity. The key condition for the upward movement remains a breakout above the nearest resistance level, with price consolidation above 156.85.
The alternative scenario will activate if the lower boundary of the channel is broken and the price consolidates below the 155.45 level. This signal will create conditions for a resumption of the downward movement and further decline in USDJPY prices.
GBPUSD forecast
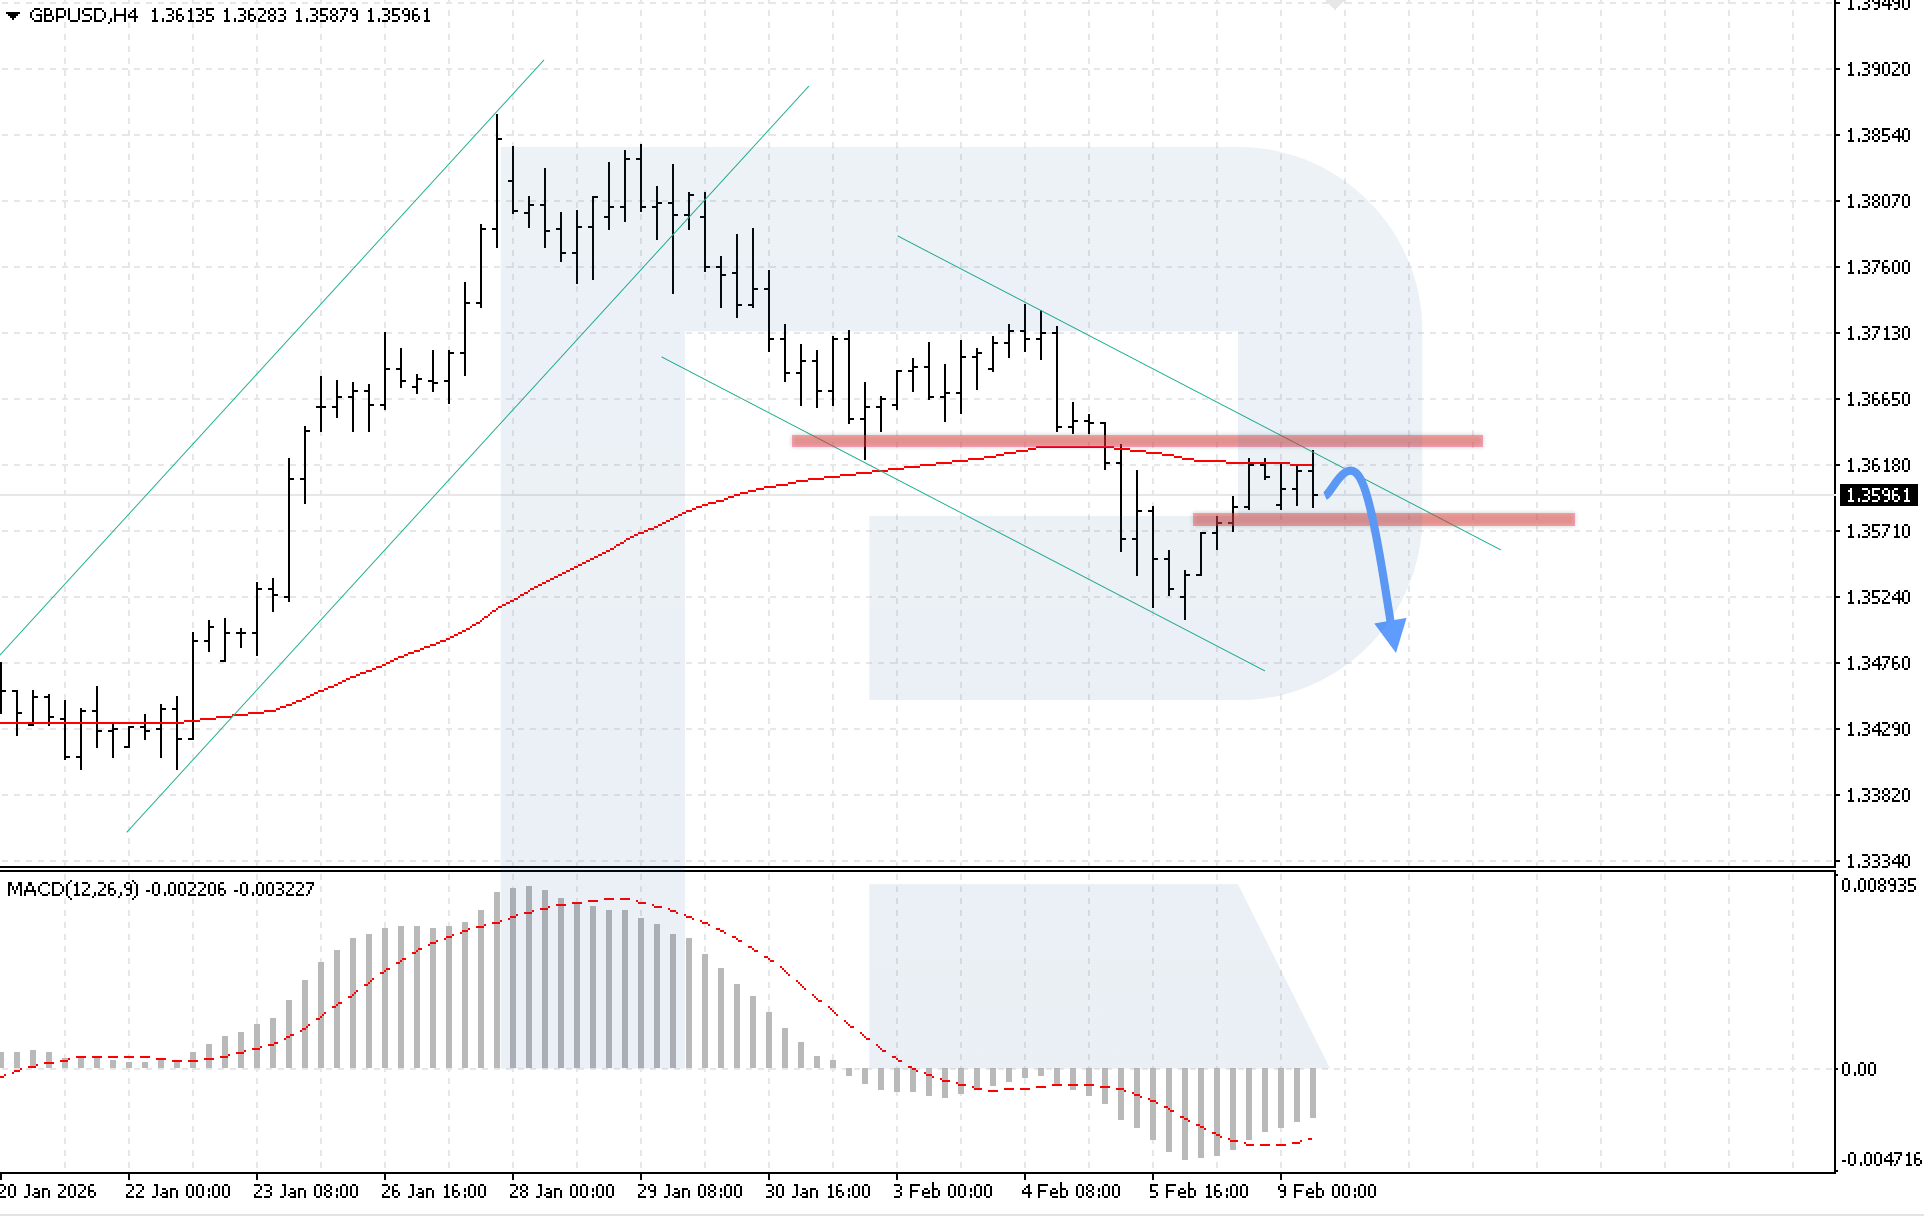
On the GBPUSD H4 chart, prices continue to rebound from the EMA-85 line, indicating persistent bearish pressure. The nearest support level is located at 1.3575. Today, 9 February 2026, the price could rebound from the upper boundary of the downward channel and decline further towards the 1.3475 level.
The technical picture confirms this scenario. The MACD indicator shows a slowdown in histogram growth, indicating persistent selling pressure. The key condition for the downward movement remains price consolidation below the 1.3575 support level.
The alternative scenario will activate if the upper boundary of the downward channel at the 1.3645 level is broken. In this case, the current decline will likely be complete, and the GBPUSD pair could resume growth.
AUDUSD forecast
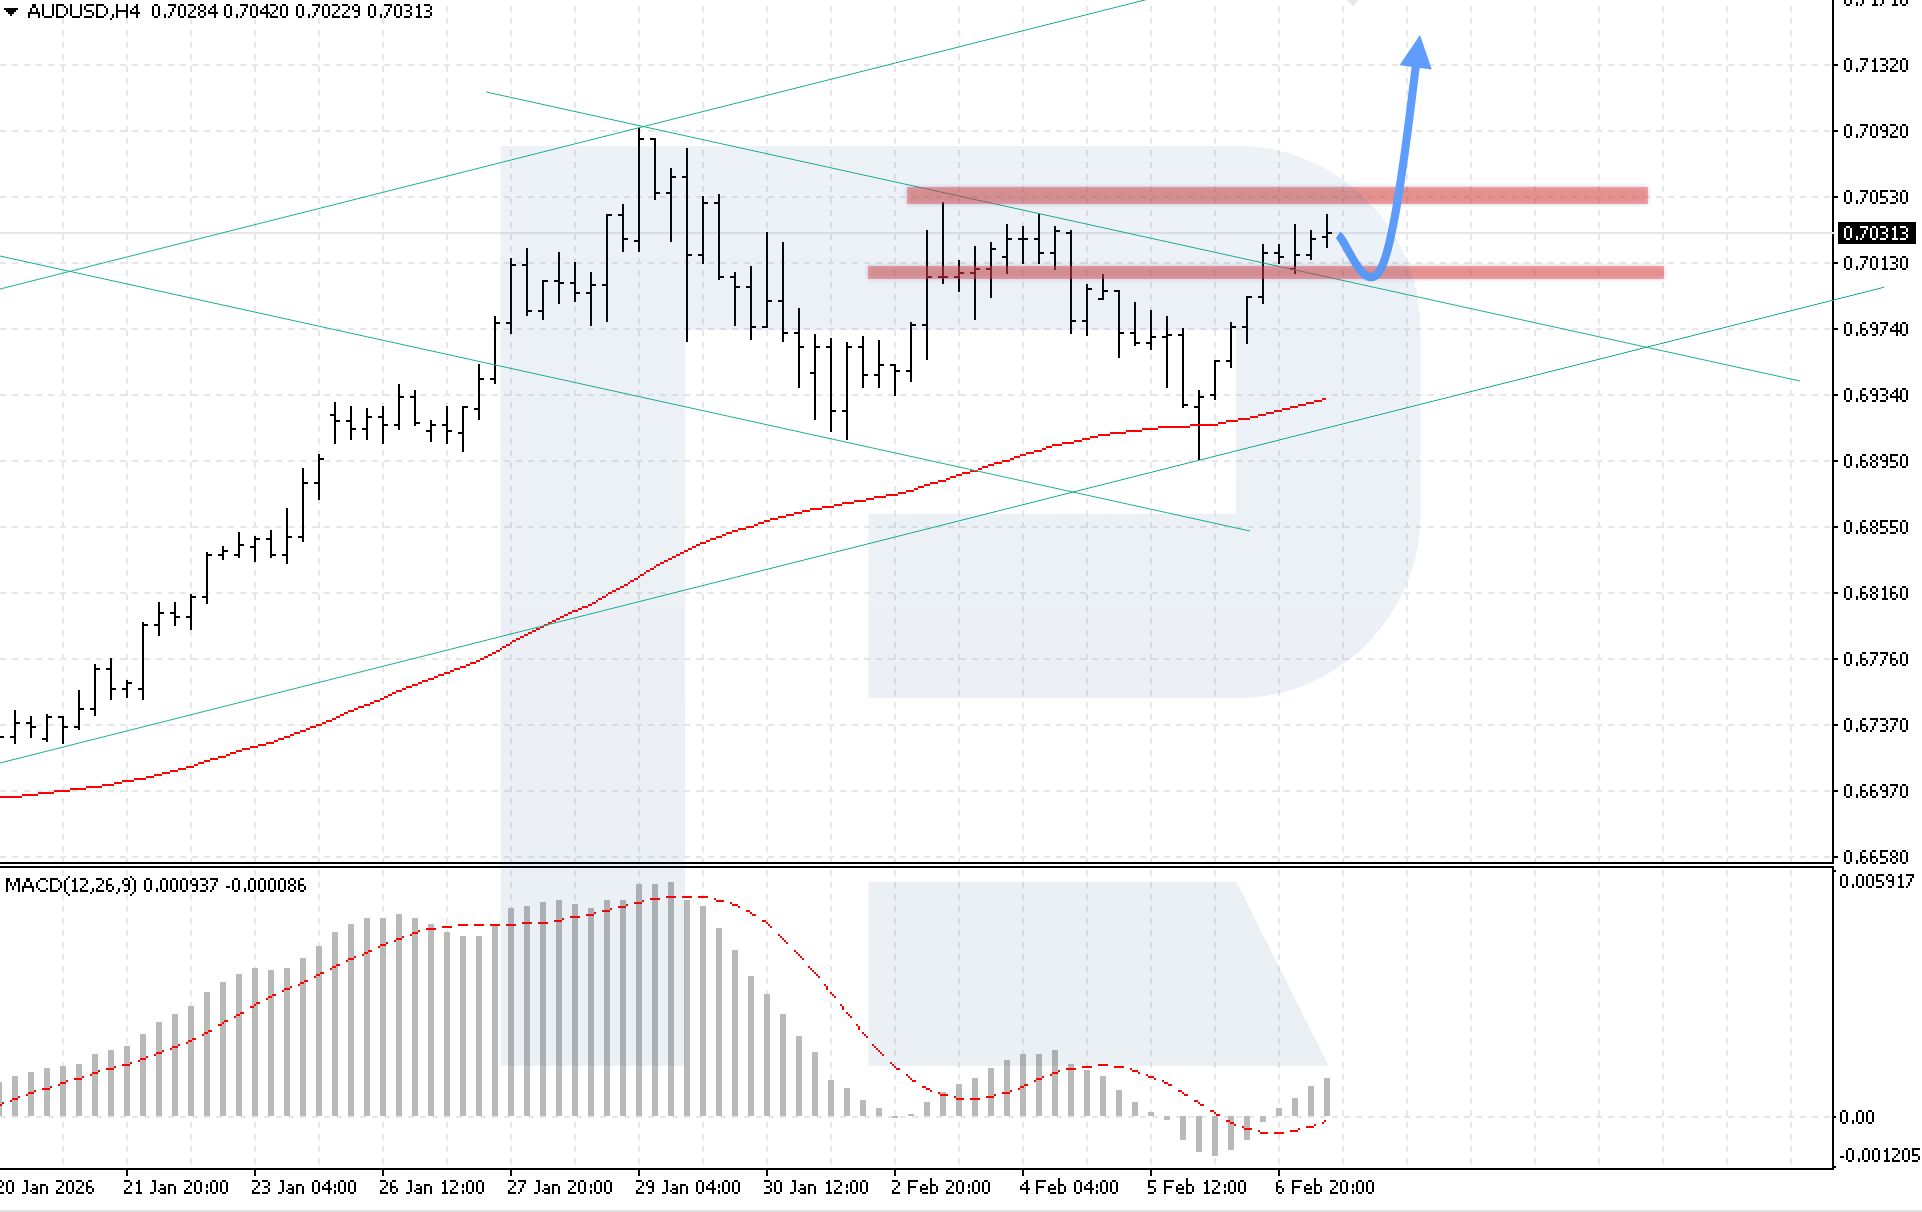
On the AUDUSD H4 chart, the market is rising after breaking above the upper boundary of the downward channel. Prices have now met resistance at the 0.7050 level, where bearish pressure proved too strong. Today, 9 February 2026, the bullish wave could continue with a target at 0.7145.
The technical picture confirms this scenario. The MACD indicator shows active histogram growth, indicating that the current bullish momentum remains strong. The key condition for growth remains price consolidation above the 0.7050 resistance level.
The alternative scenario will activate if prices pull back and consolidate below 0.6995. This signal will indicate a return of prices into the downward channel and a continued decline in the AUDUSD rate.
USDCAD forecast
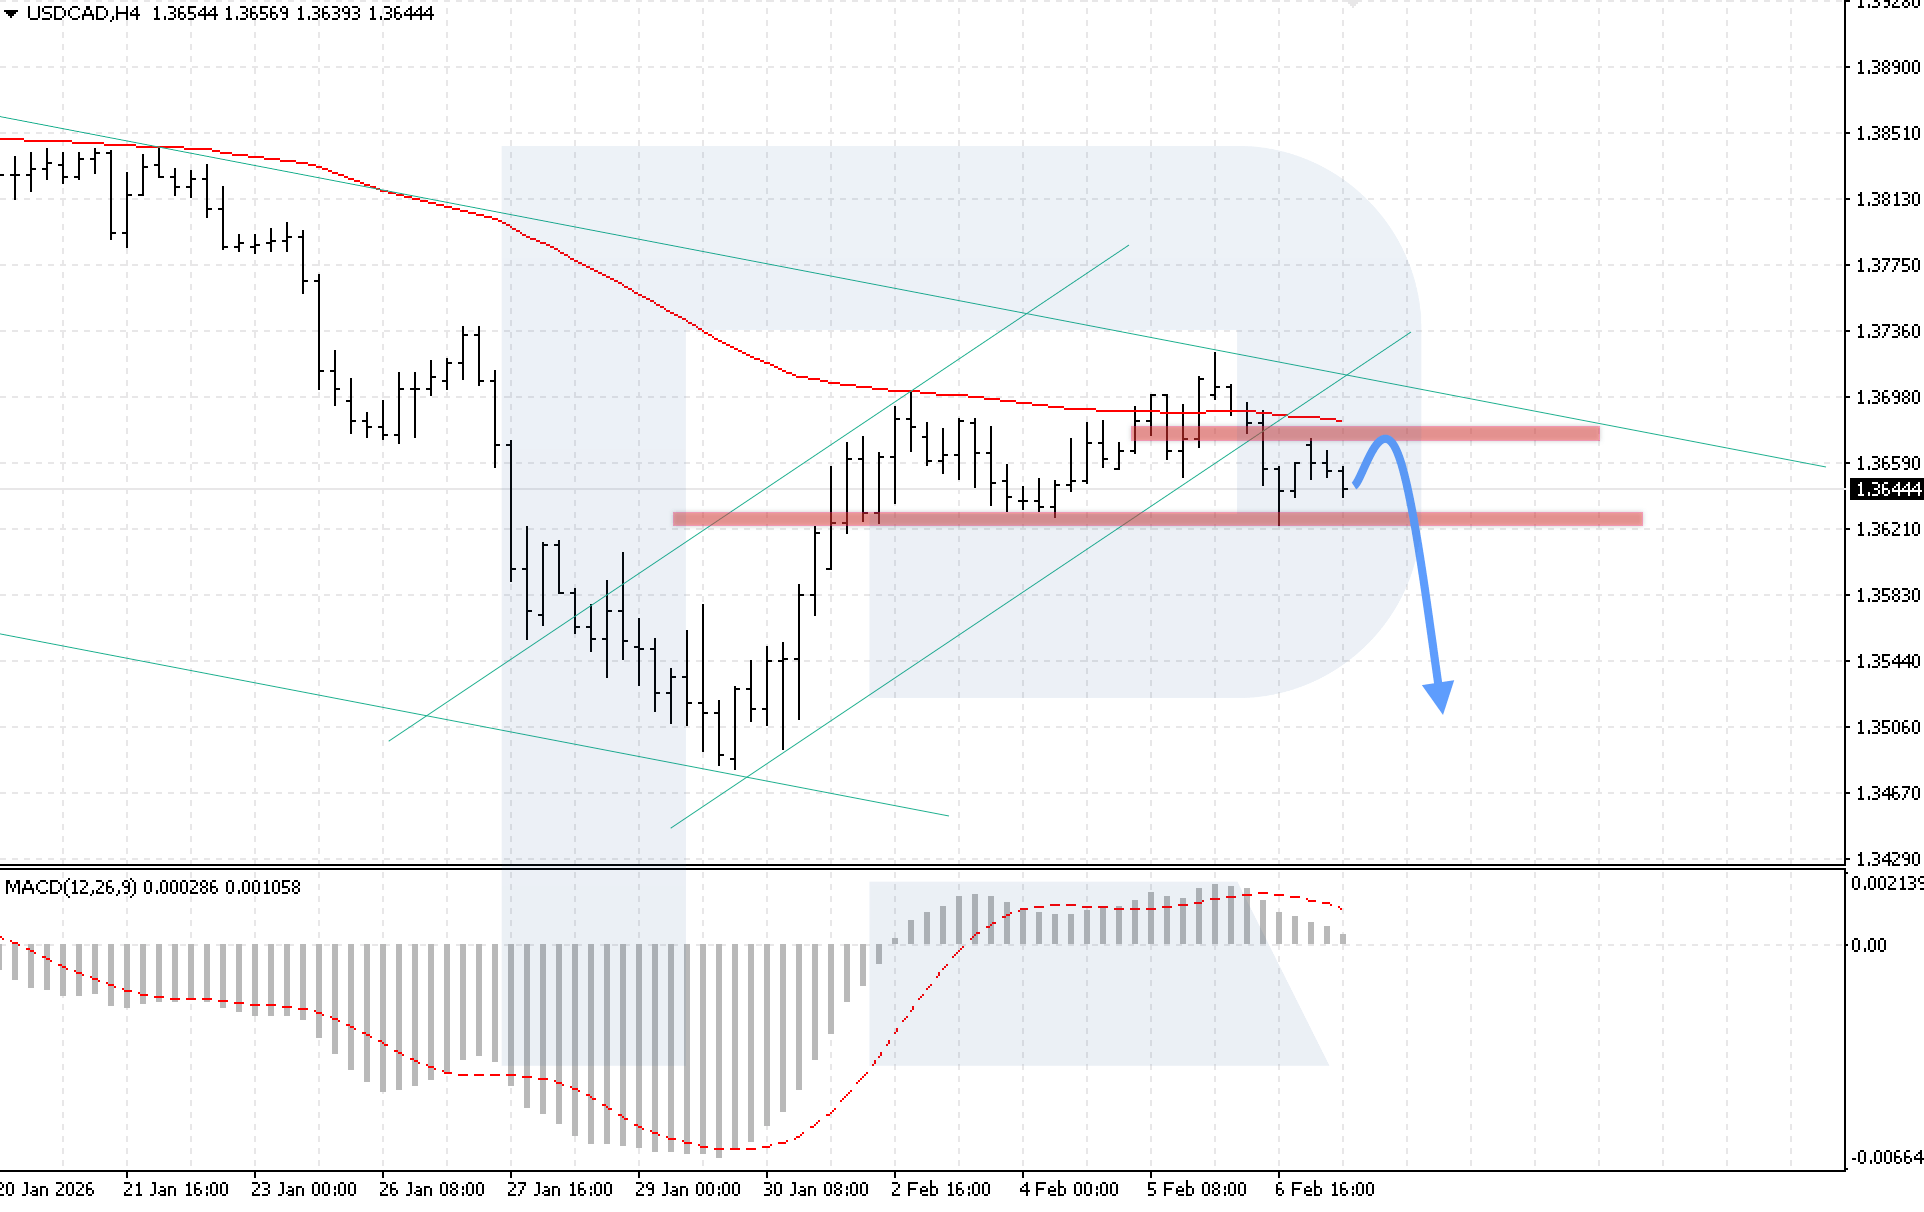
On the USDCAD H4 chart, the market has rebounded from the 1.3685 resistance level and maintains bearish pressure with attempts to break below the 1.3620 support level. Today, 9 February 2026, the decline could continue towards the target of 1.3505.
The technical picture confirms the bearish scenario. The MACD indicator shows a slowdown in histogram decline, indicating easing selling pressure. The key condition for the decline to continue remains price consolidation below the 1.3620 level, which will confirm a breakout below the lower boundary of the Double Top reversal pattern.
The alternative scenario will activate if the upper boundary of the downward channel is broken and prices consolidate above 1.3705. This signal will indicate a renewed bullish correction in the USDCAD pair.
XAUUSD forecast
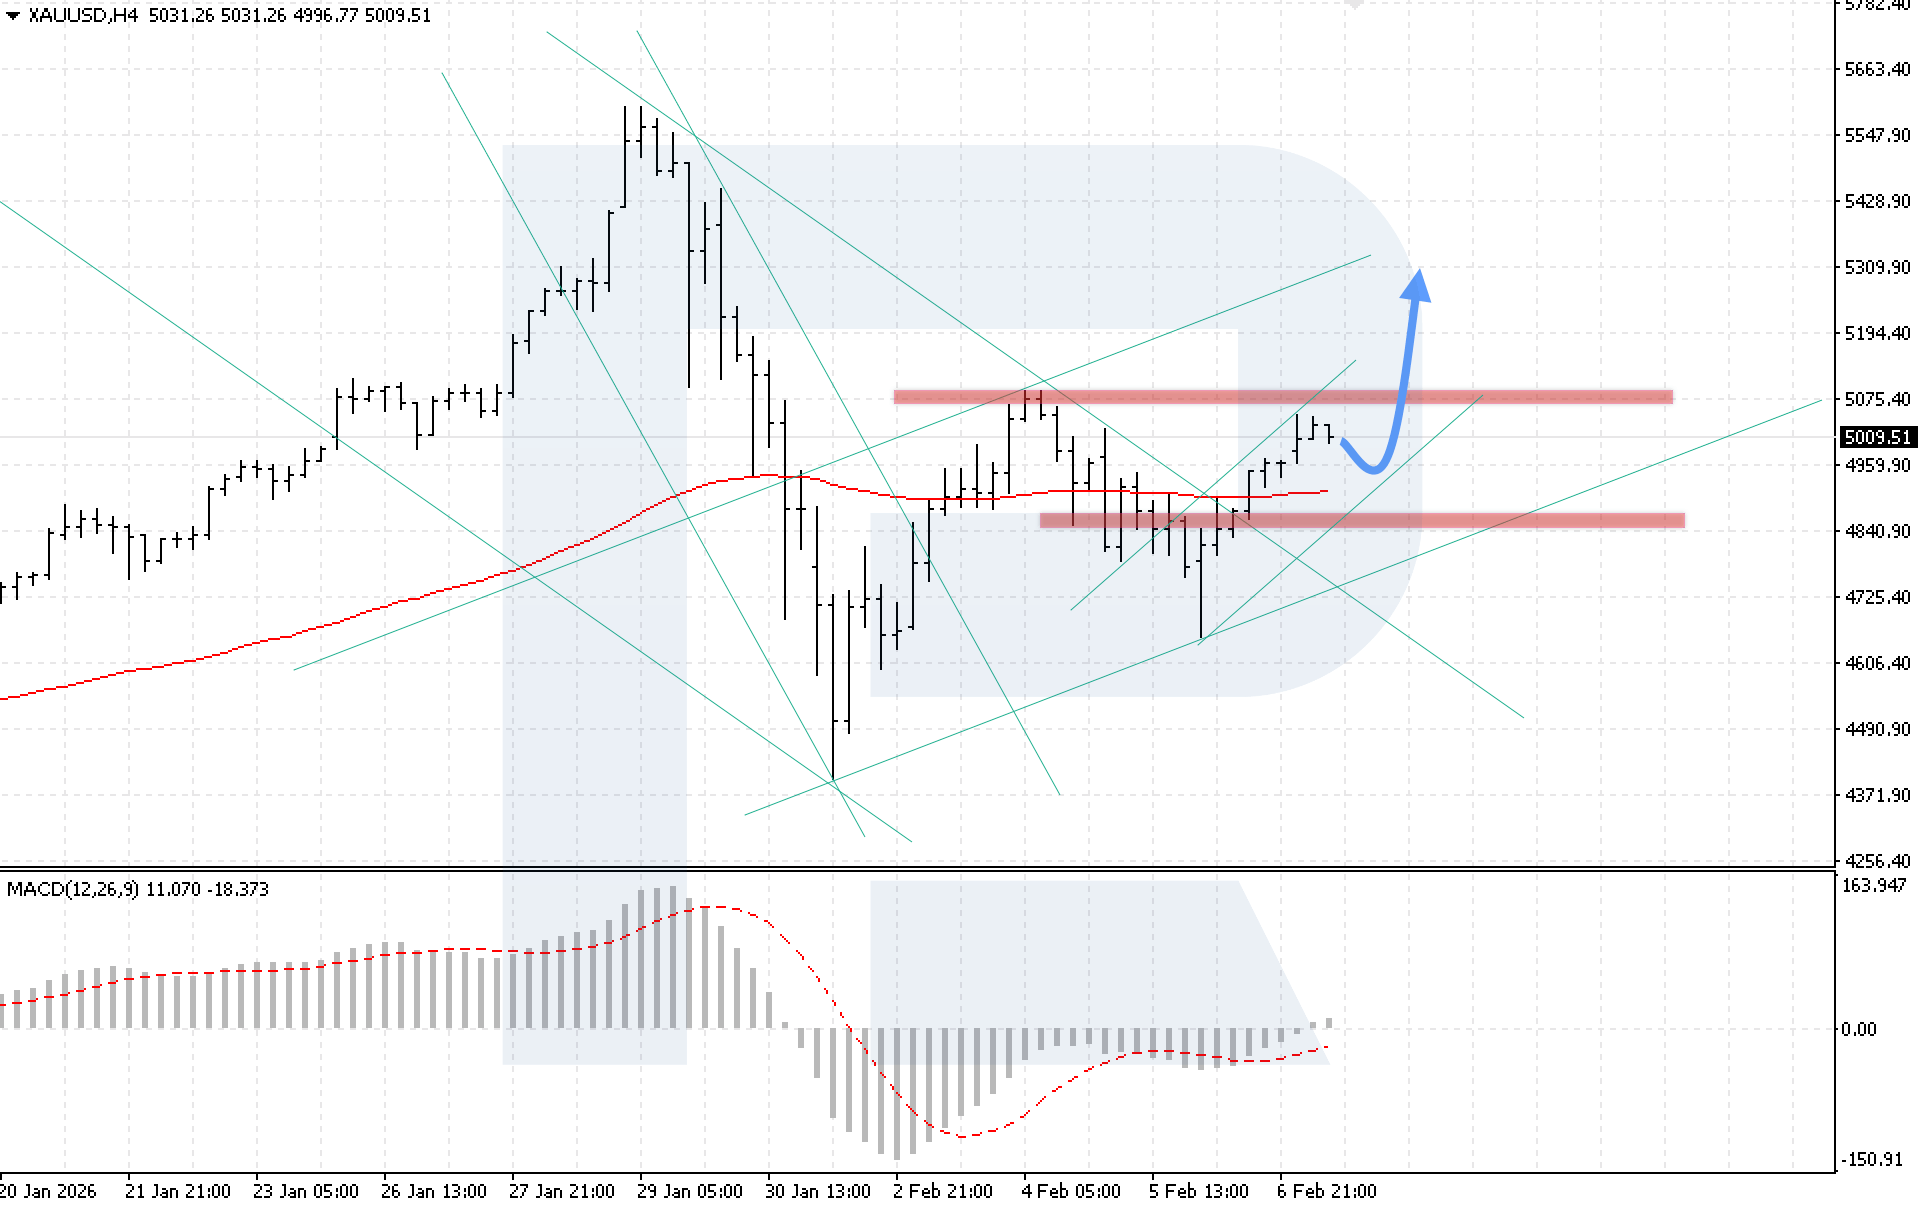
On the XAUUSD H4 chart, the market is developing an upward wave, with buyers approaching the key resistance level at 5,075. The nearest support is located at 4,955. Today, 9 February 2026, prices could rebound from the lower boundary of the ascending channel before rising towards the 5,310 target.
The technical picture confirms this scenario. The MACD indicator shows histogram growth and has crossed above the zero line, indicating the strength of the bullish momentum. The key condition for growth remains price consolidation above the 5,075 level, which will confirm buyer activity.
The alternative scenario will activate if the lower boundary of the channel is broken and prices consolidate below 4,830. This signal may trigger a continued decline with a target at 4,385.
Brent forecast
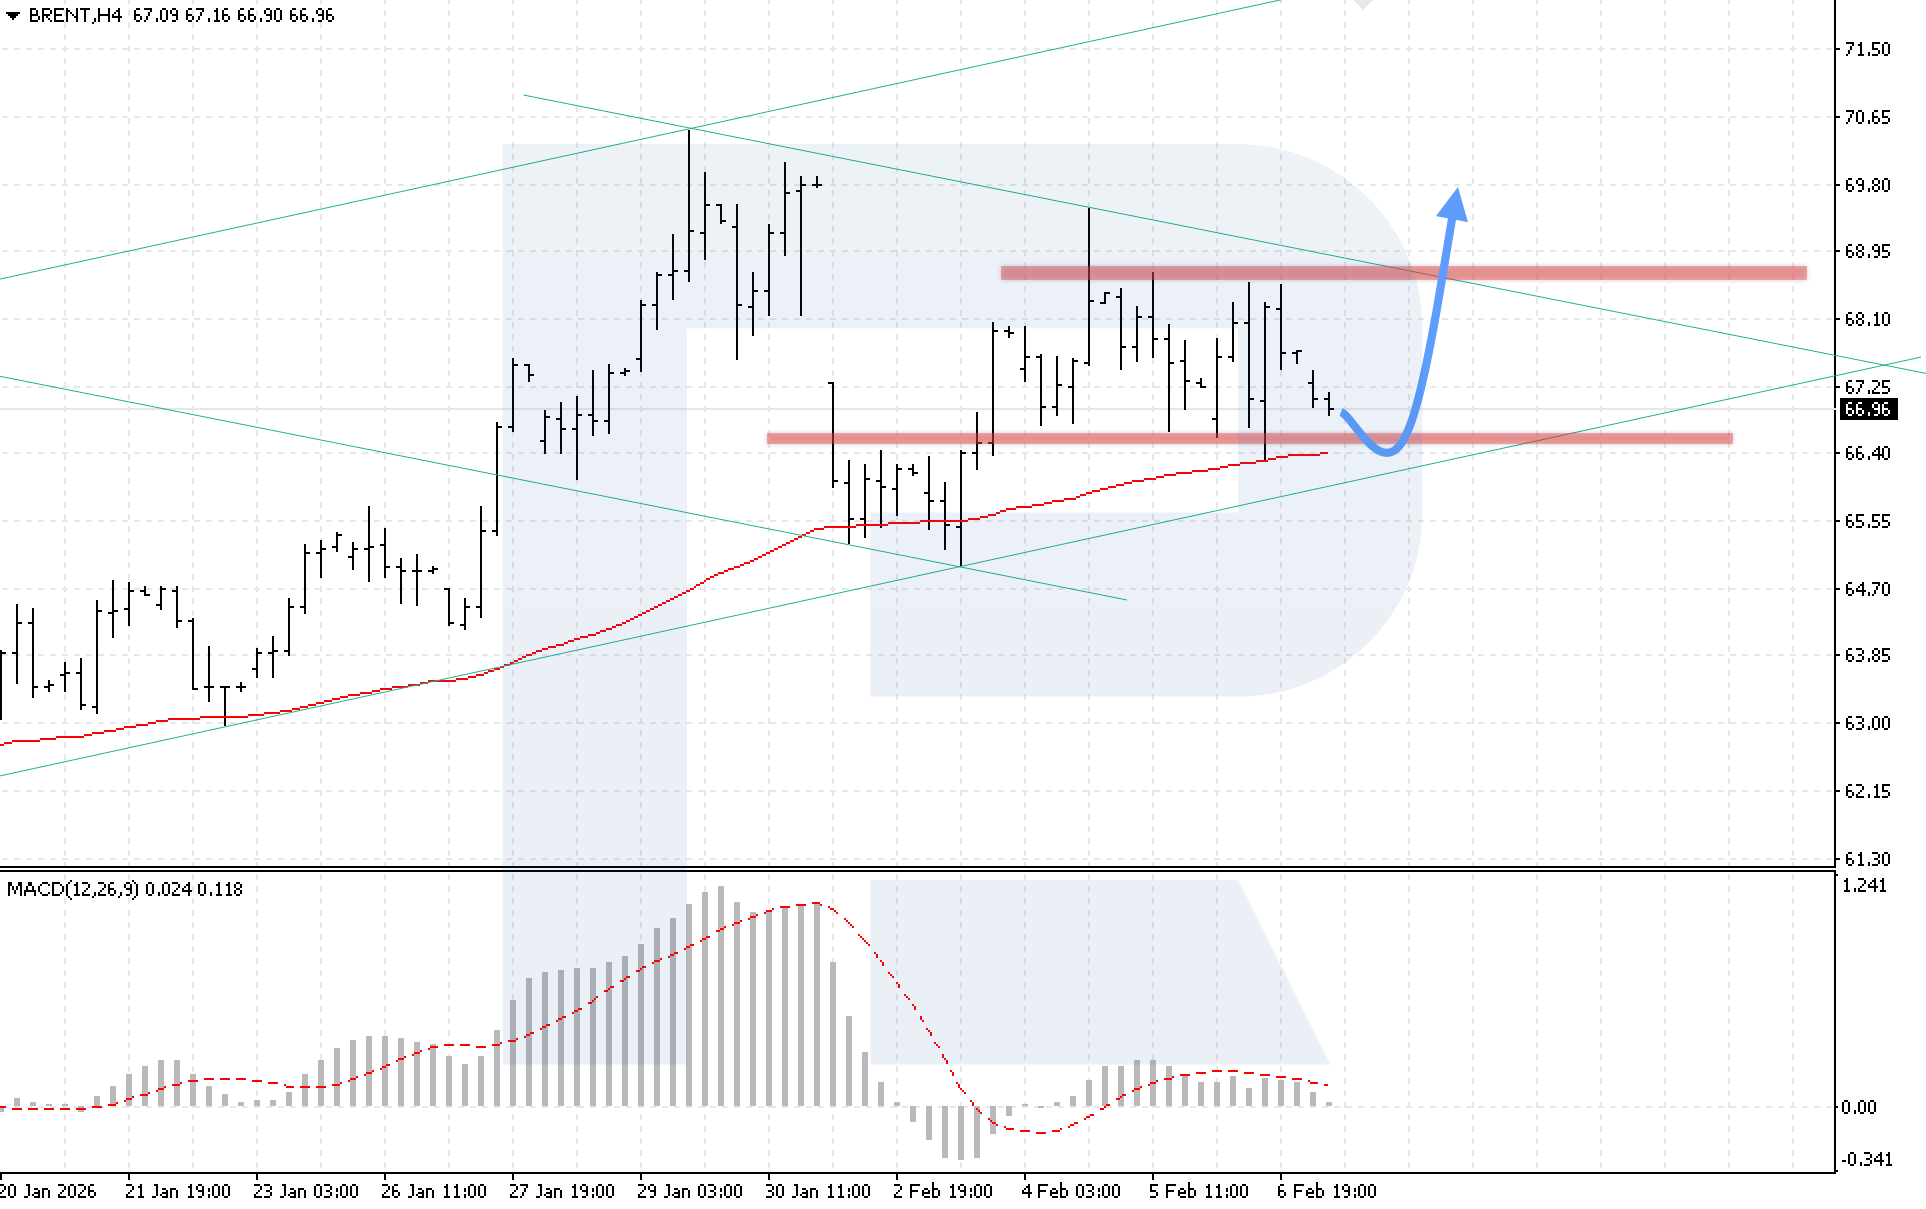
On the Brent H4 chart, the market continues to move within a correction, with buyers holding prices above the EMA-85. The nearest support level is located at 66,45. Today, 9 February 2026, the upward wave could resume, aiming for the 69,80 level.
The technical picture confirms the bullish scenario. The MACD indicator shows a slowdown in histogram decline, indicating weakening selling pressure. The key condition for growth will be price consolidation above the 69,05 level, which will confirm a breakout above the upper boundary of the correction channel.
The alternative scenario will activate if the lower boundary of the channel is broken with consolidation below 65,55. This signal will indicate a breakout below the lower boundary of the long-term bullish channel and the formation of conditions for a continued decline in Brent prices.
Editors’ picks
 EURUSD 2026-2027 forecast: key market trends and future predictions
This article provides the EURUSD forecast for 2026 and 2027 and highlights the main factors determining the direction of the pair’s movements. We will apply technical analysis, take into account the opinions of leading experts, large banks, and financial institutions, and study AI-based forecasts. This comprehensive insight into EURUSD predictions should help investors and traders make informed decisions.
 Gold (XAUUSD) forecast 2026 and beyond: expert insights, price predictions, and analysis
Dive deep into the Gold (XAUUSD) price outlook for 2026 and beyond, combining technical analysis, expert forecasts, and key macroeconomic factors. It explains the drivers behind gold’s recent surge, explores potential scenarios including a move toward 4,500 to 5,000 USD per ounce, and highlights why the metal remains a strong hedge during global uncertainty.
Forecasts presented in this section only reflect the author’s private opinion and should not be considered as guidance for trading. RoboForex bears no responsibility for trading results based on trading recommendations described in these analytical reviews.