Daily technical analysis and forecast for 10 February 2026
Here is a detailed daily technical analysis and forecast for EURUSD, USDJPY, GBPUSD, AUDUSD, USDCAD, XAUUSD, and Brent for 10 February 2026.
EURUSD forecast
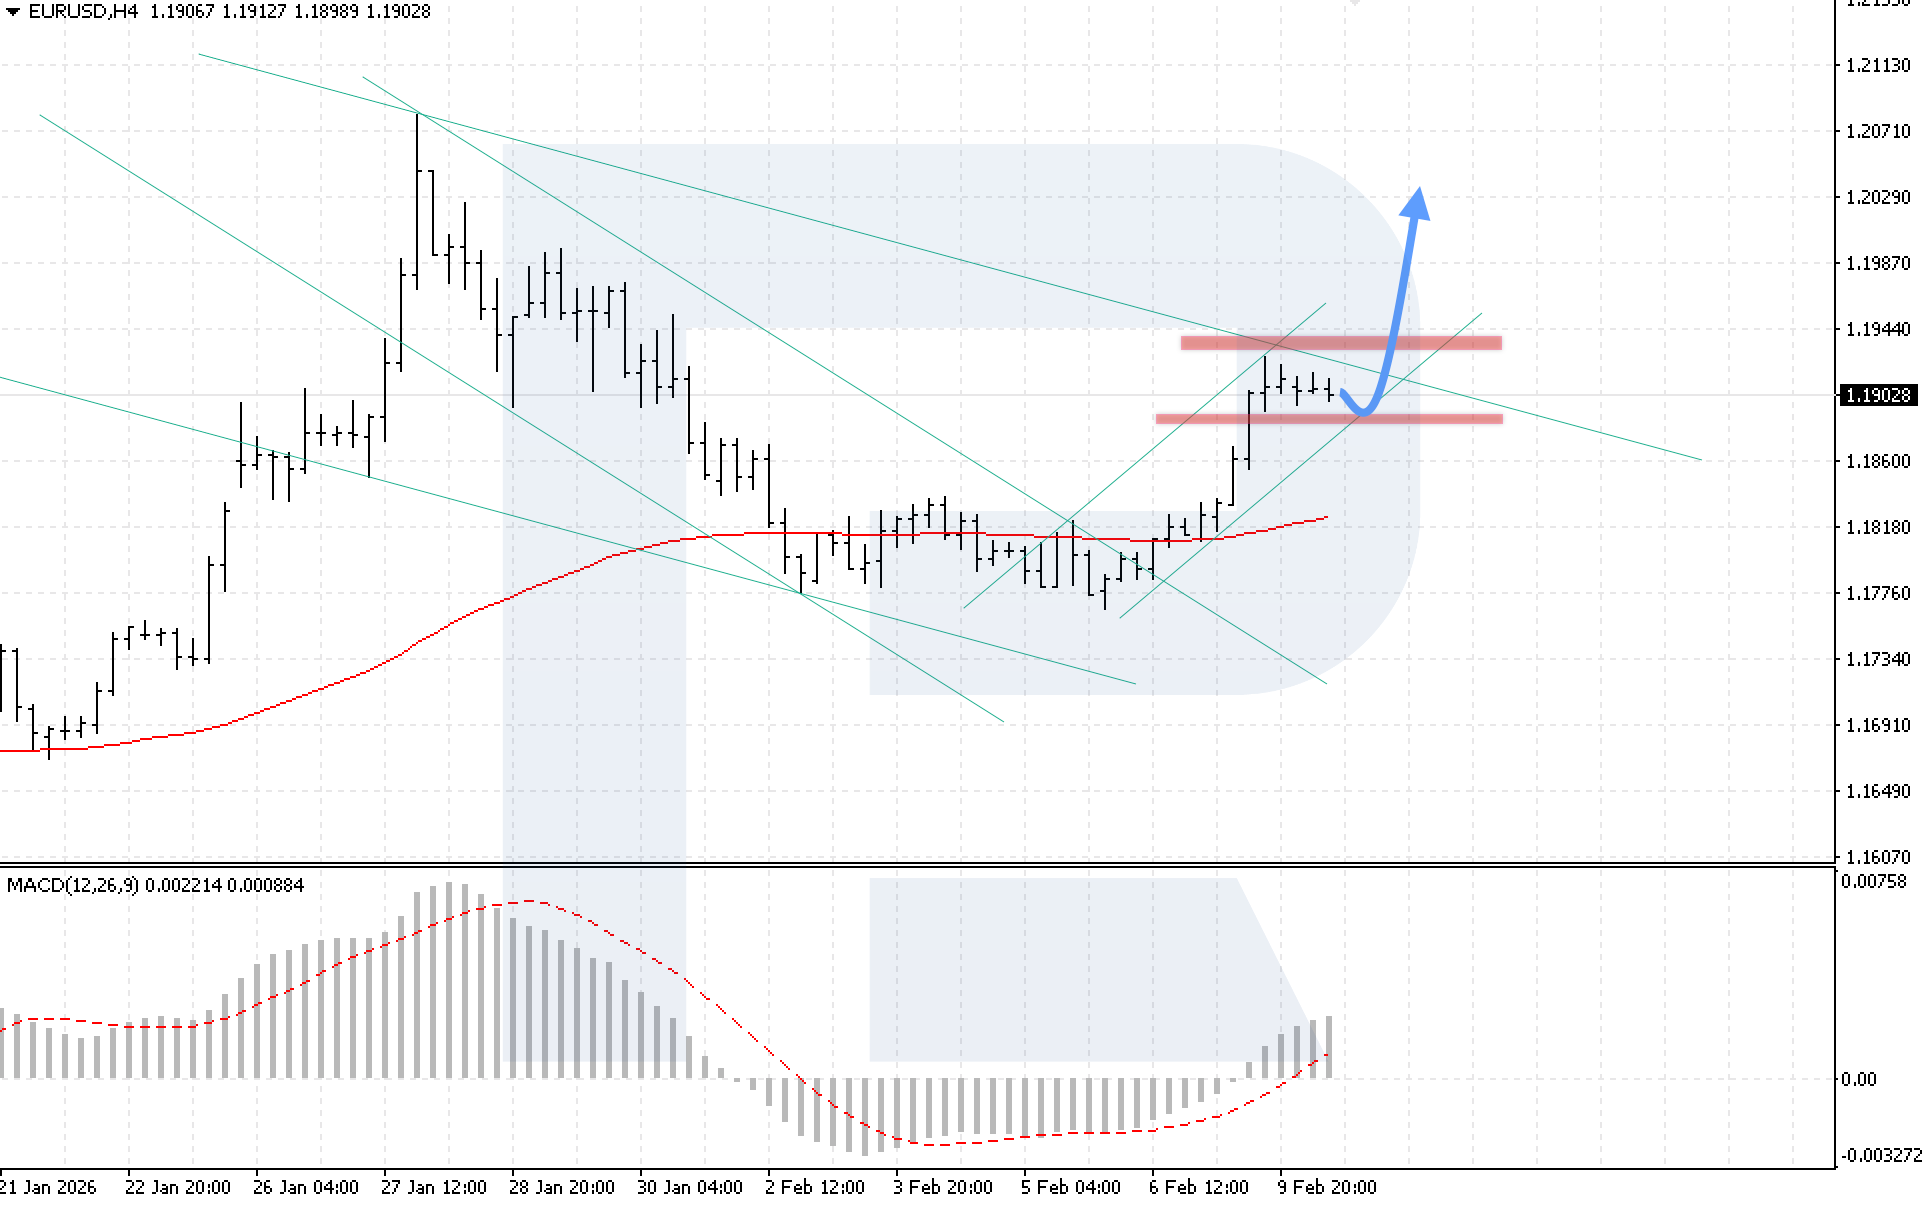
On the EURUSD H4 chart, the market is rebounding from the upper boundary of the downward channel. Despite the current correction, buying pressure remains significant. Today, 10 February 2026, the baseline scenario suggests a rebound from the lower boundary of the upward channel at 1.1895, followed by a new bullish wave with a target at 1.2030.
The technical picture confirms this scenario. The MACD indicator shows active histogram growth even after crossing the zero line, which increases the probability of continued upward movement. The key condition for growth remains confident price consolidation above the 1.1935 level, which will signal a breakout above the upper boundary of the downward channel.
The alternative scenario will activate if the price declines below 1.1865, indicating a breakout below the channel’s lower boundary and increasing the likelihood of a corrective wave with a target at 1.1820.
USDJPY forecast
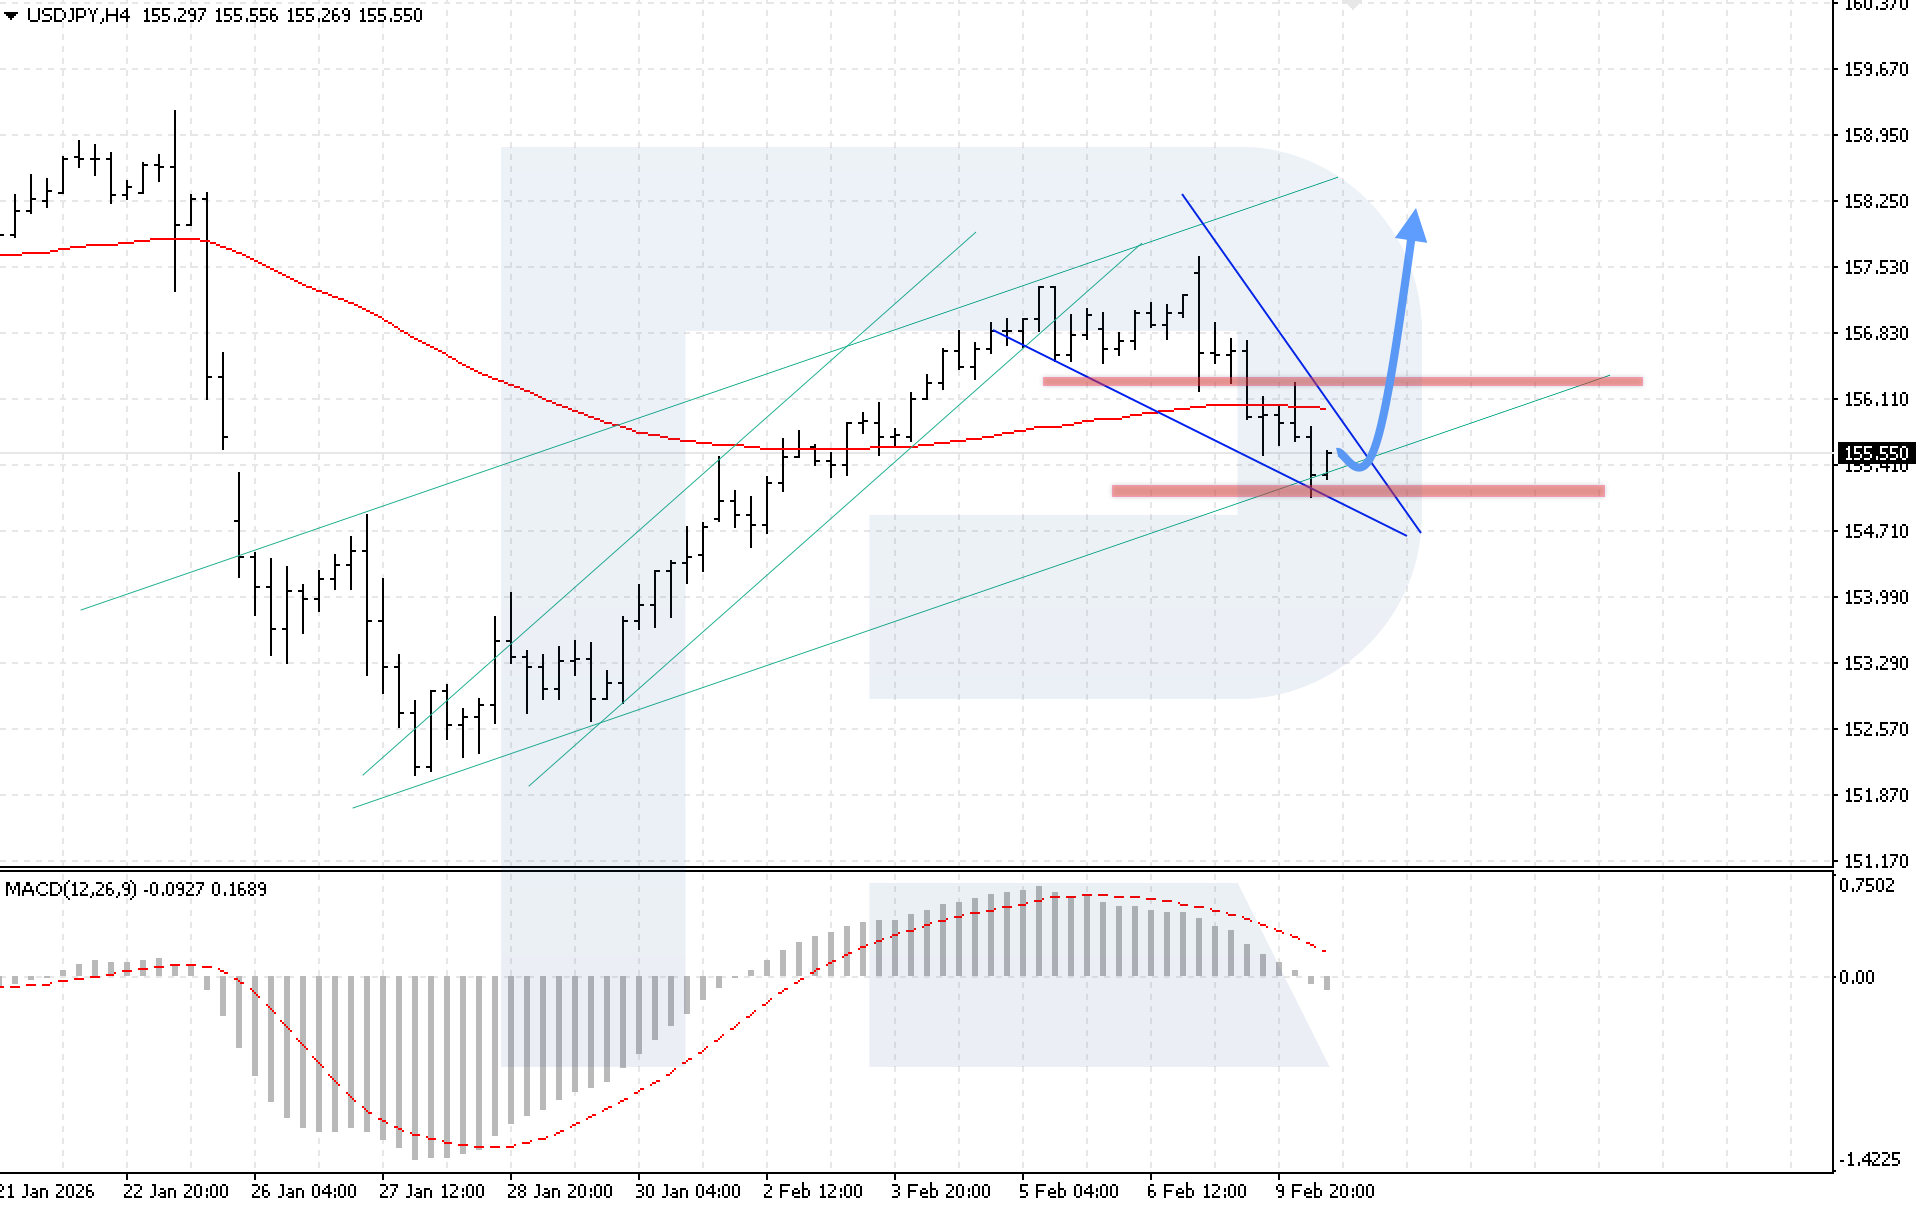
On the USDJPY H4 chart, the market is in a phase of active bearish correction. Despite prices moving below the EMA-85, the potential for forming a Wedge reversal pattern remains. The nearest support zone is located in the 154.90 area. Today, 10 February 2026, the baseline scenario suggests renewed growth with a target at 158.25 following the reversal pattern signal.
The technical picture confirms this scenario. The MACD indicator shows a slowdown in the histogram decline, signalling easing bearish pressure. The key condition for the bullish movement remains a breakout above the upper boundary of the Wedge reversal pattern with price consolidation above the 156.05 level.
The alternative scenario will activate if the lower boundary of the pattern is broken and the price consolidates below the 154.55 level, which will create conditions for a renewed decline and further correction in the USDJPY pair.
GBPUSD forecast
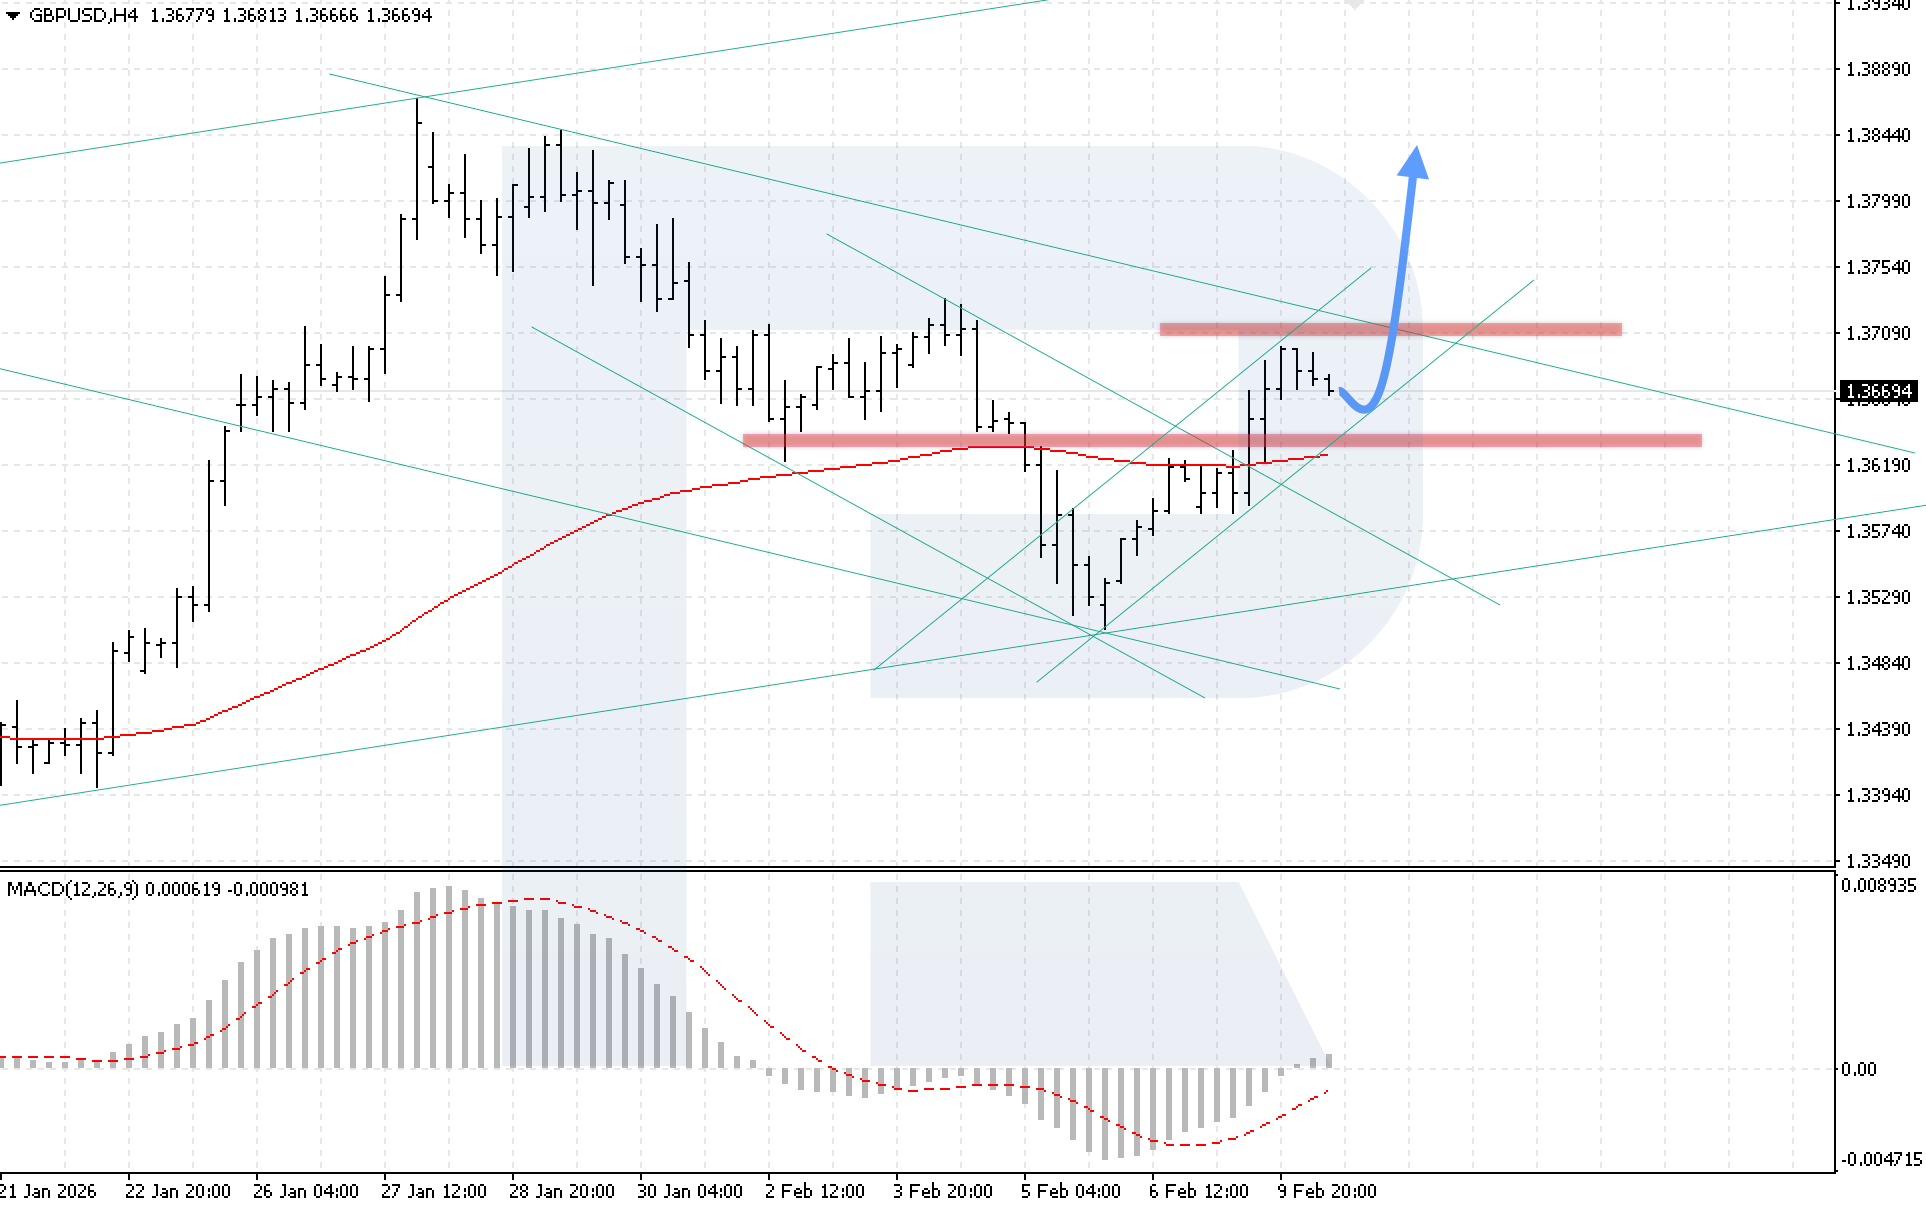
On the GBPUSD H4 chart, prices continue to rise actively after breaking above the EMA-85. Buyers encountered resistance near the 1.3695 level; however, bullish pressure remains strong. Today, 10 February 2026, the pair could rebound from the lower boundary of the upward channel before rising further towards the 1.3845 level.
The technical picture confirms this scenario. The MACD indicator shows growth after crossing the zero line, which increases the probability of continued upward movement. The key condition for the bullish momentum remains price consolidation above the 1.3725 level, which will confirm buyer strength and indicate a breakout above the upper boundary of the downward channel.
The alternative scenario will activate if the lower boundary of the bullish channel is broken with consolidation below 1.3615, creating conditions for a continued decline towards the EMA-85.
AUDUSD forecast
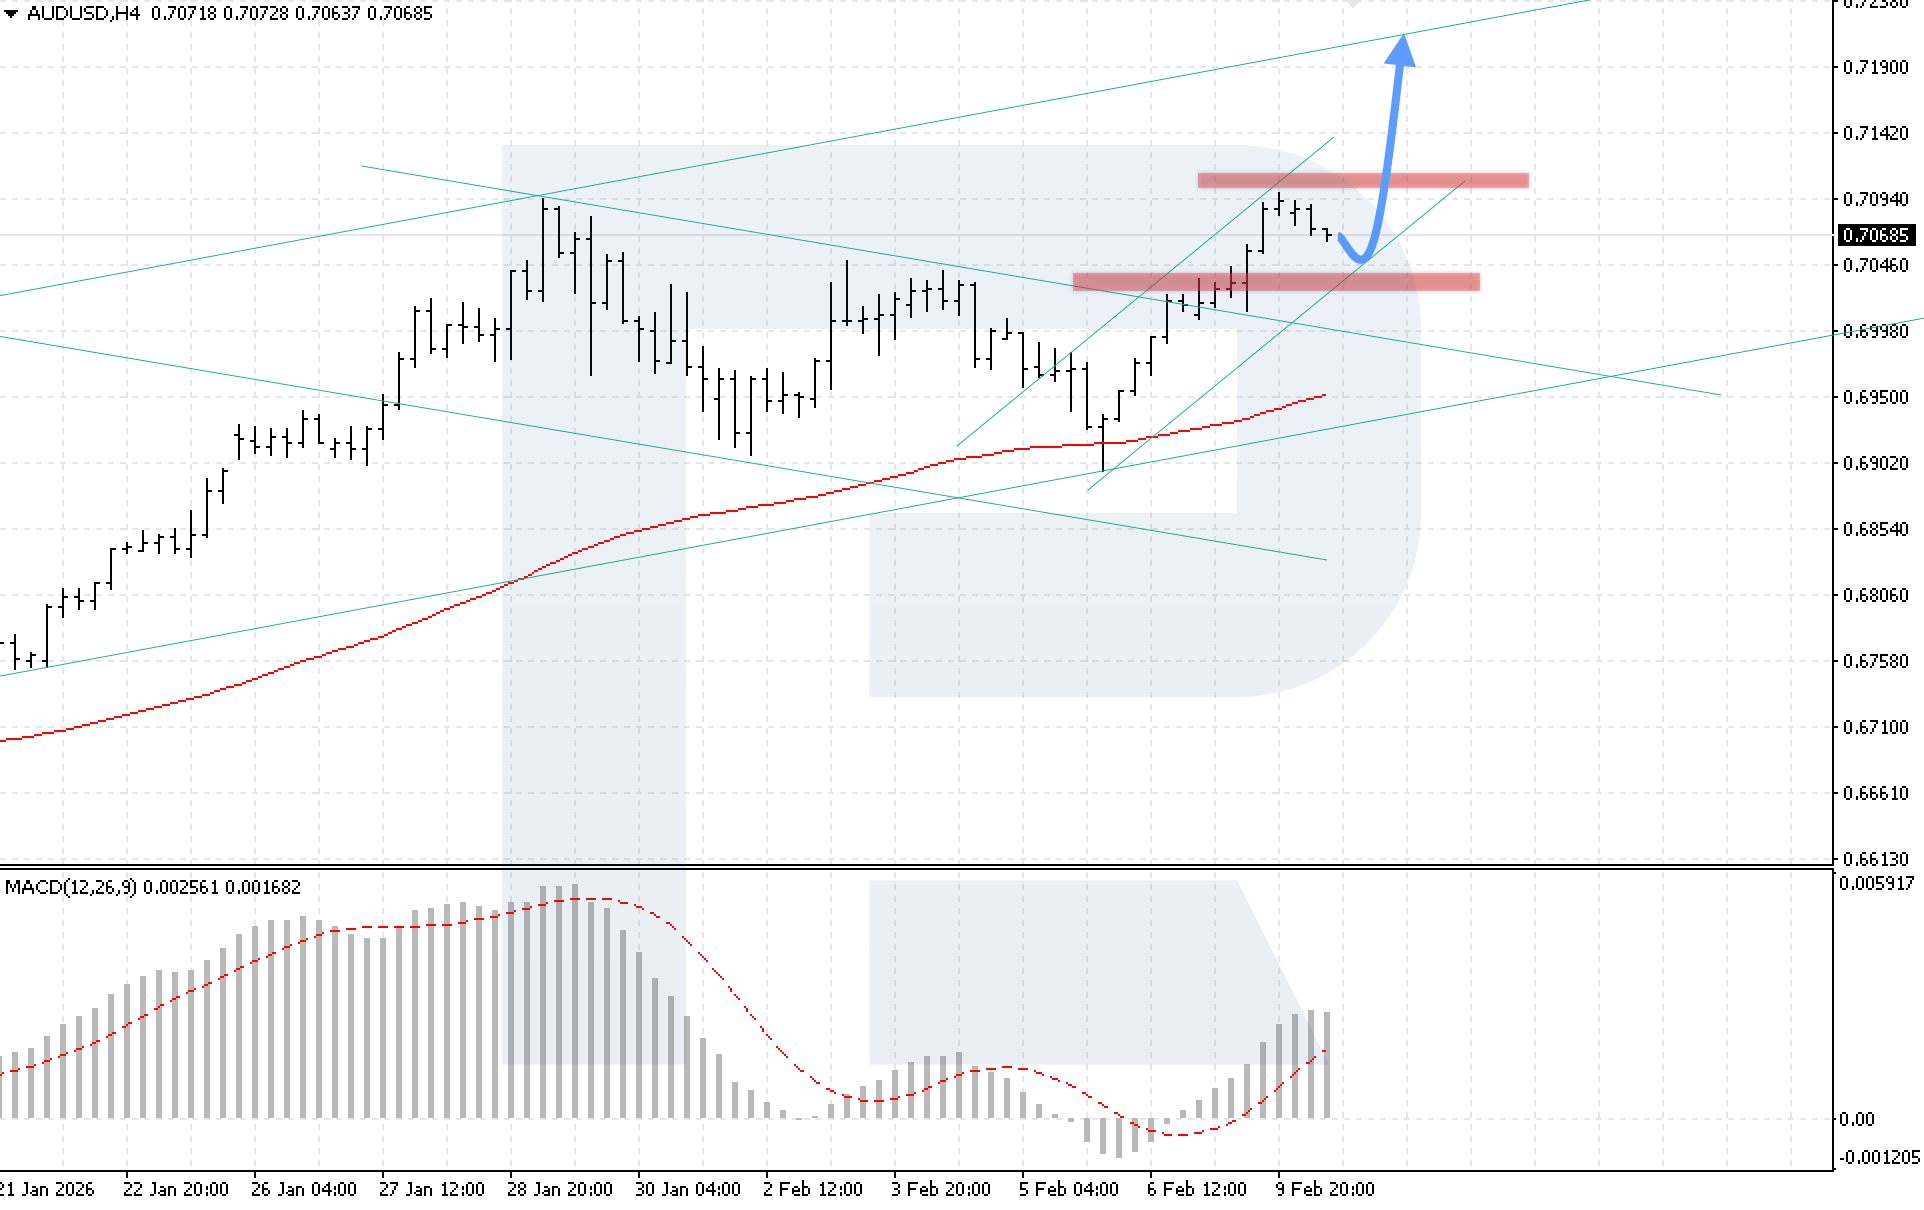
On the AUDUSD H4 chart, the market is showing a correction after rebounding from the 0.7095 resistance level; however, buying pressure remains. Today, 10 February 2026, the bullish momentum could continue towards the target of 0.7195 after a rebound from the 0.7045 support level.
The technical picture confirms this scenario. The MACD indicator shows active histogram growth after a brief slowdown, indicating that the current momentum remains strong. The key condition for the upward movement remains price consolidation above the 0.7095 resistance level.
The alternative scenario will activate if the price breaks and consolidates below the 0.7035 level, signalling a potential breakout of the upper boundary of the downward channel and a continued AUDUSD decline.
USDCAD forecast
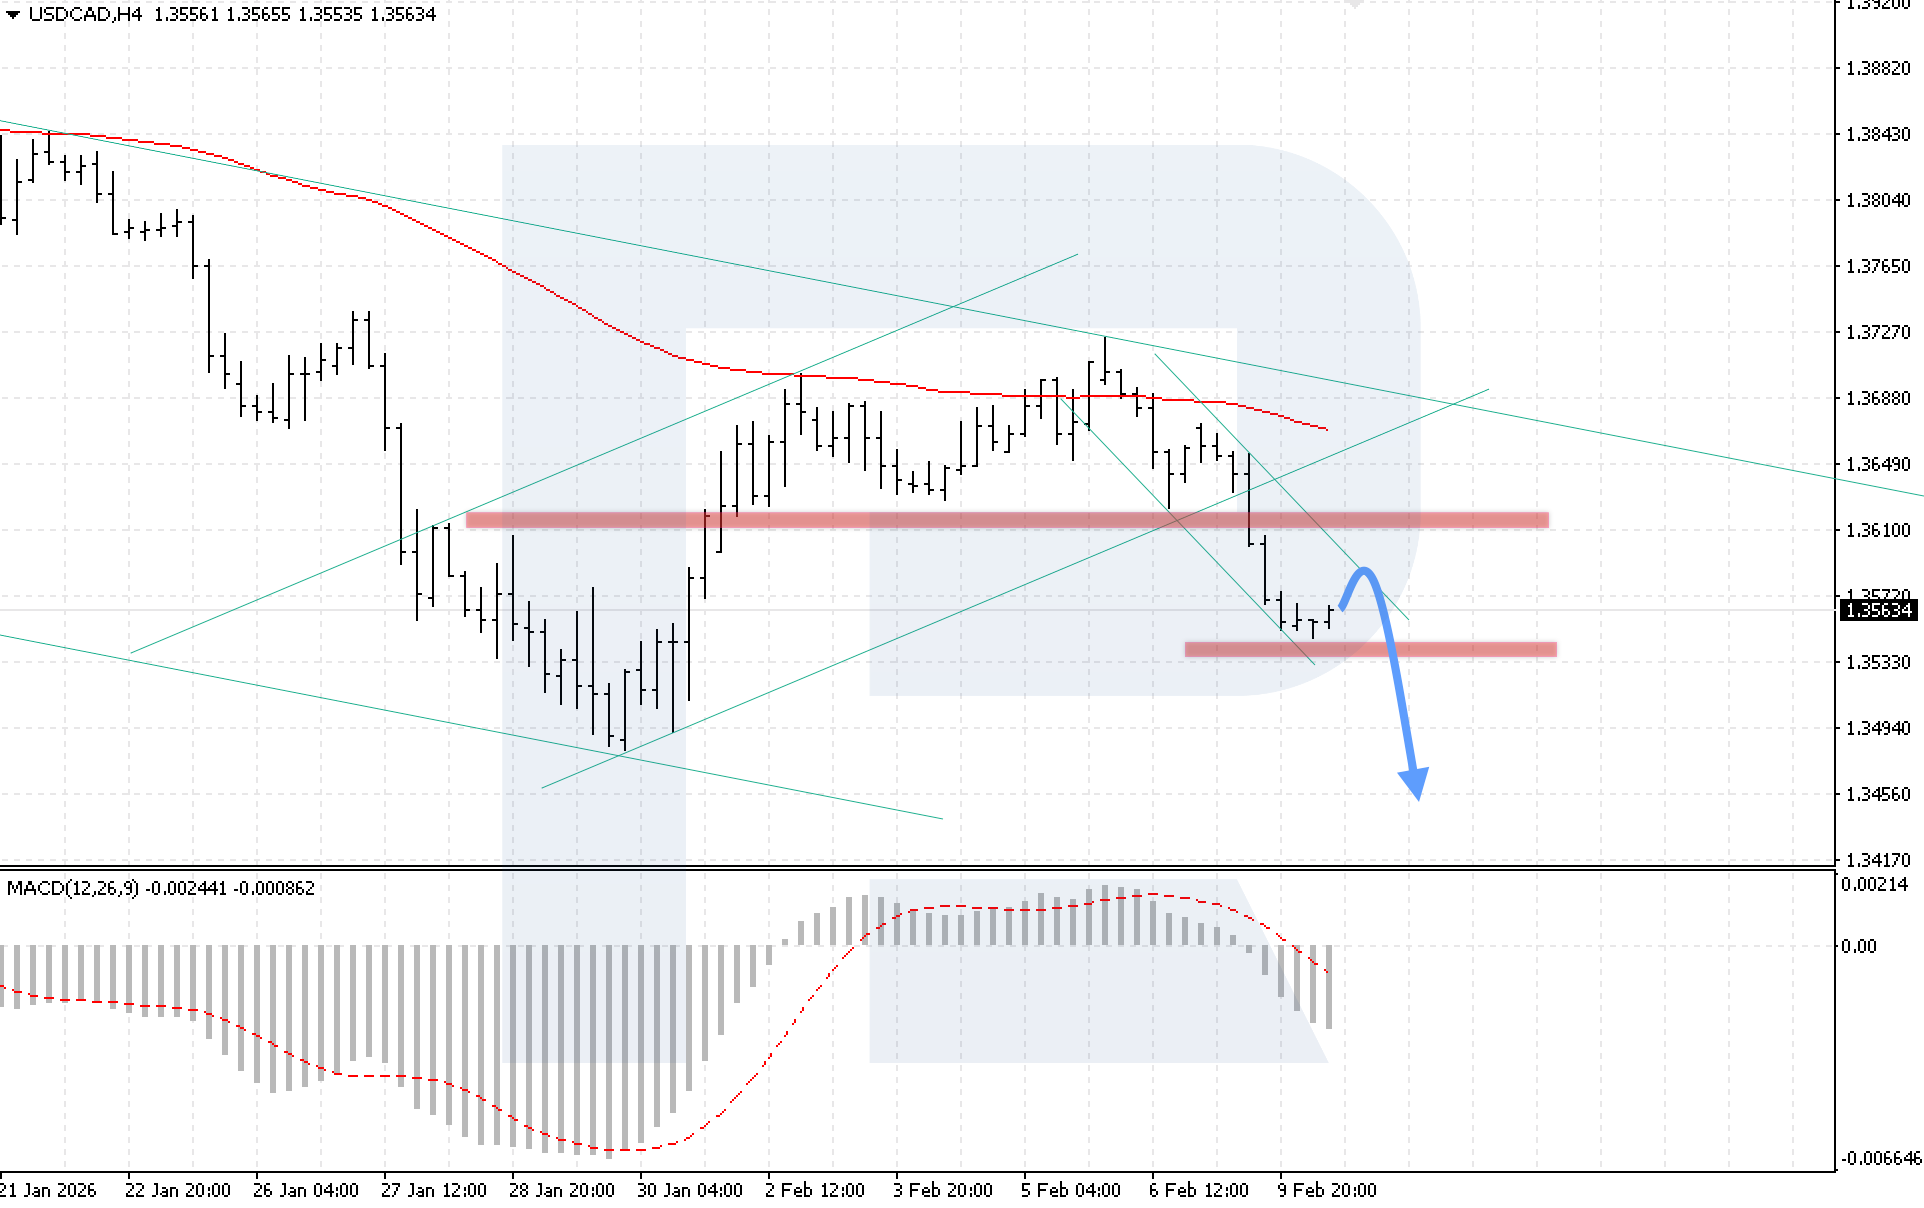
On the USDCAD H4 chart, the market continues to decline within a strong downward impulse after breaking the lower boundary of the Double Top reversal pattern. Today, 10 February 2026, the baseline scenario suggests a continued decline with a target at 1.3455.
The technical picture confirms the bearish scenario. The MACD indicator shows an active decline after crossing the zero line, indicating increasing selling pressure. The key condition for the decline to continue remains price consolidation below the local support level at 1.3535.
The alternative scenario will activate if the upper boundary of the downward channel is broken with consolidation above 1.3615, which will signal a renewed upward movement in the USDCAD pair.
XAUUSD forecast
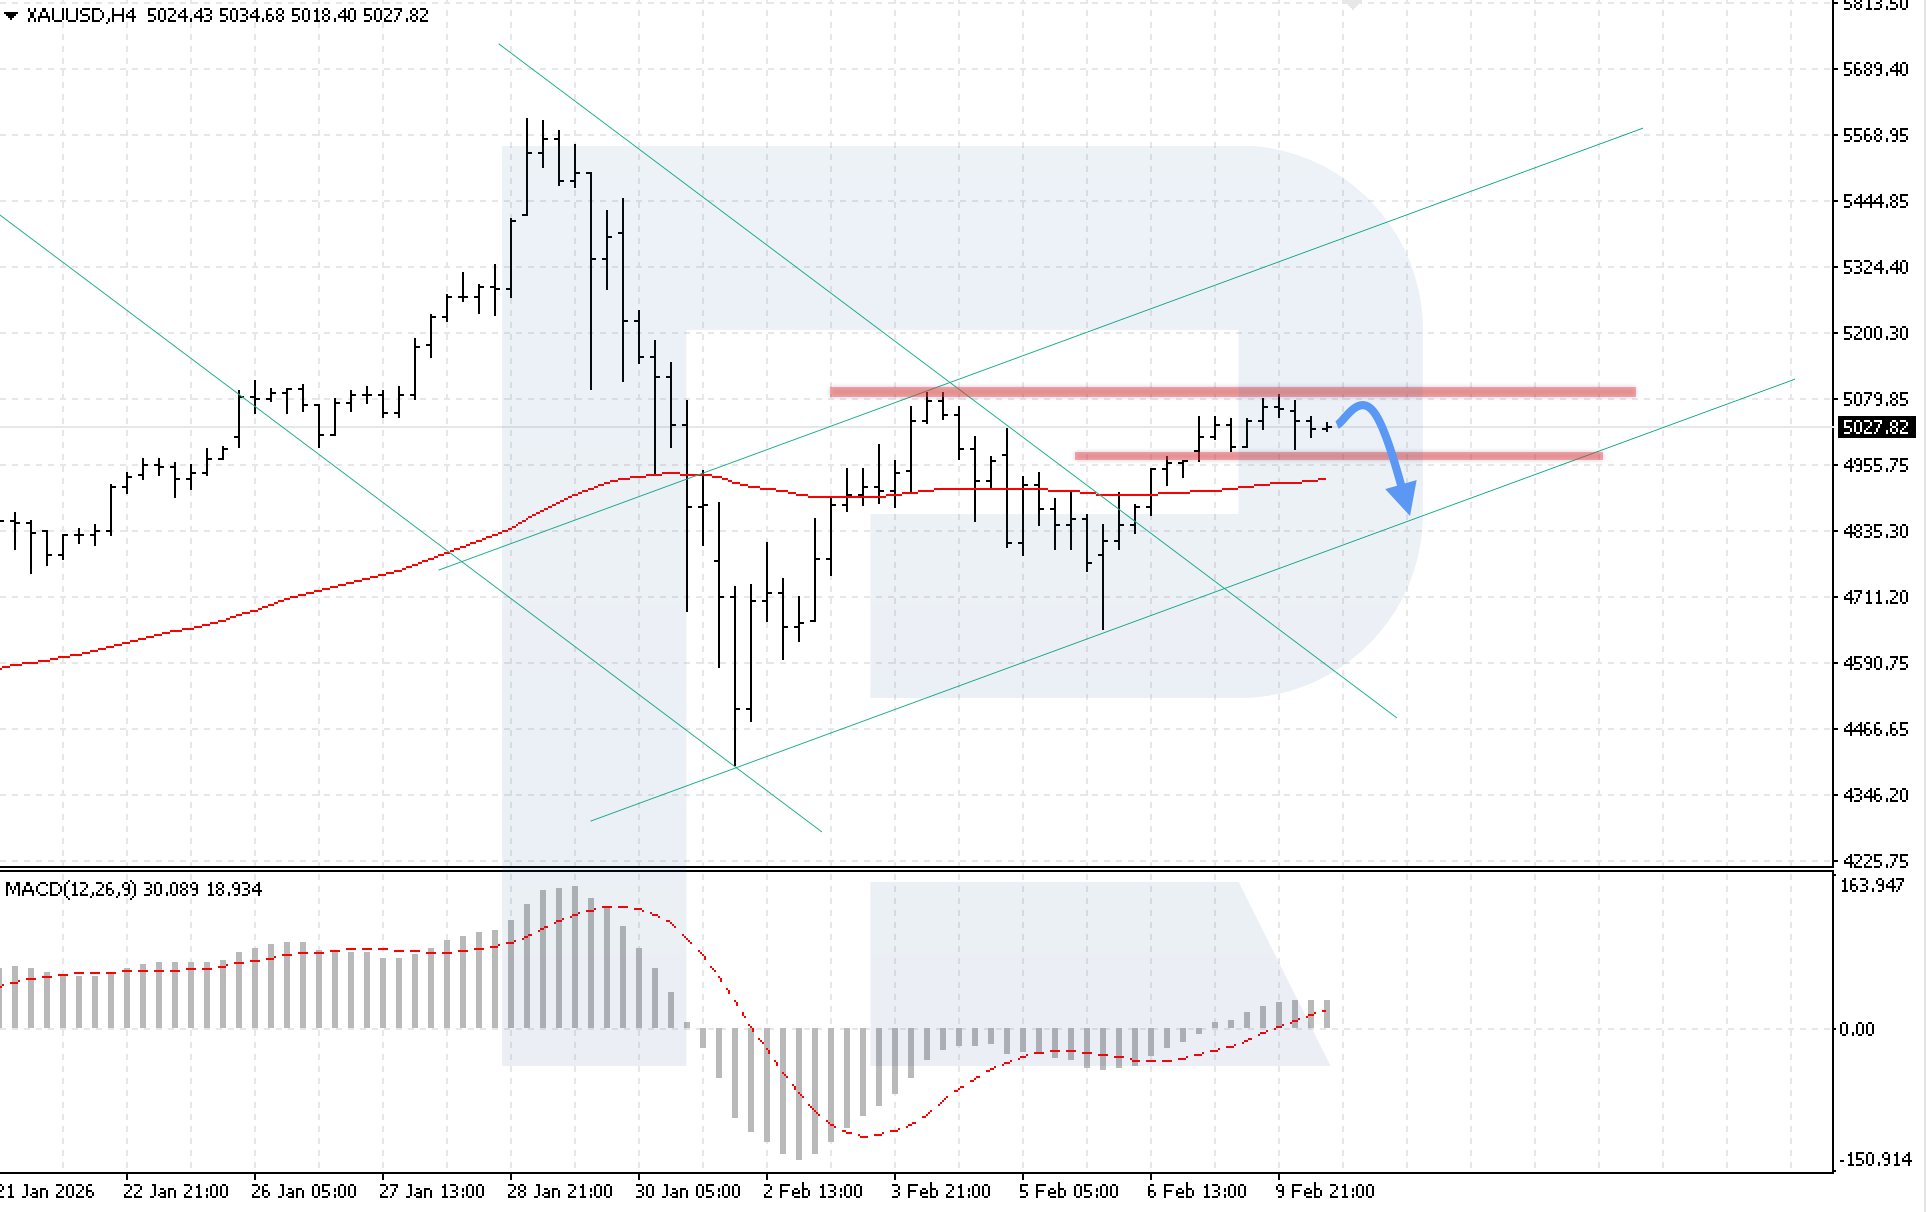
On the XAUUSD H4 chart, the market is declining after rebounding from the local resistance level at 5,080. The nearest support is located at 4,955. Today, 10 February 2026, the pair could continue to decline after rebounding, with a target at 4,845.
The technical picture confirms this scenario. The MACD indicator shows a slowdown in growth, and there remains potential for the formation of a Head and Shoulders reversal pattern. The key condition for the decline remains price consolidation below the 4,955 level, which will indicate a breakout below the lower boundary of the reversal pattern and strengthening bearish momentum.
The alternative scenario will activate if the local resistance level is broken with consolidation above 5,080, which may trigger continued growth towards the upper boundary of the bullish channel.
Brent forecast
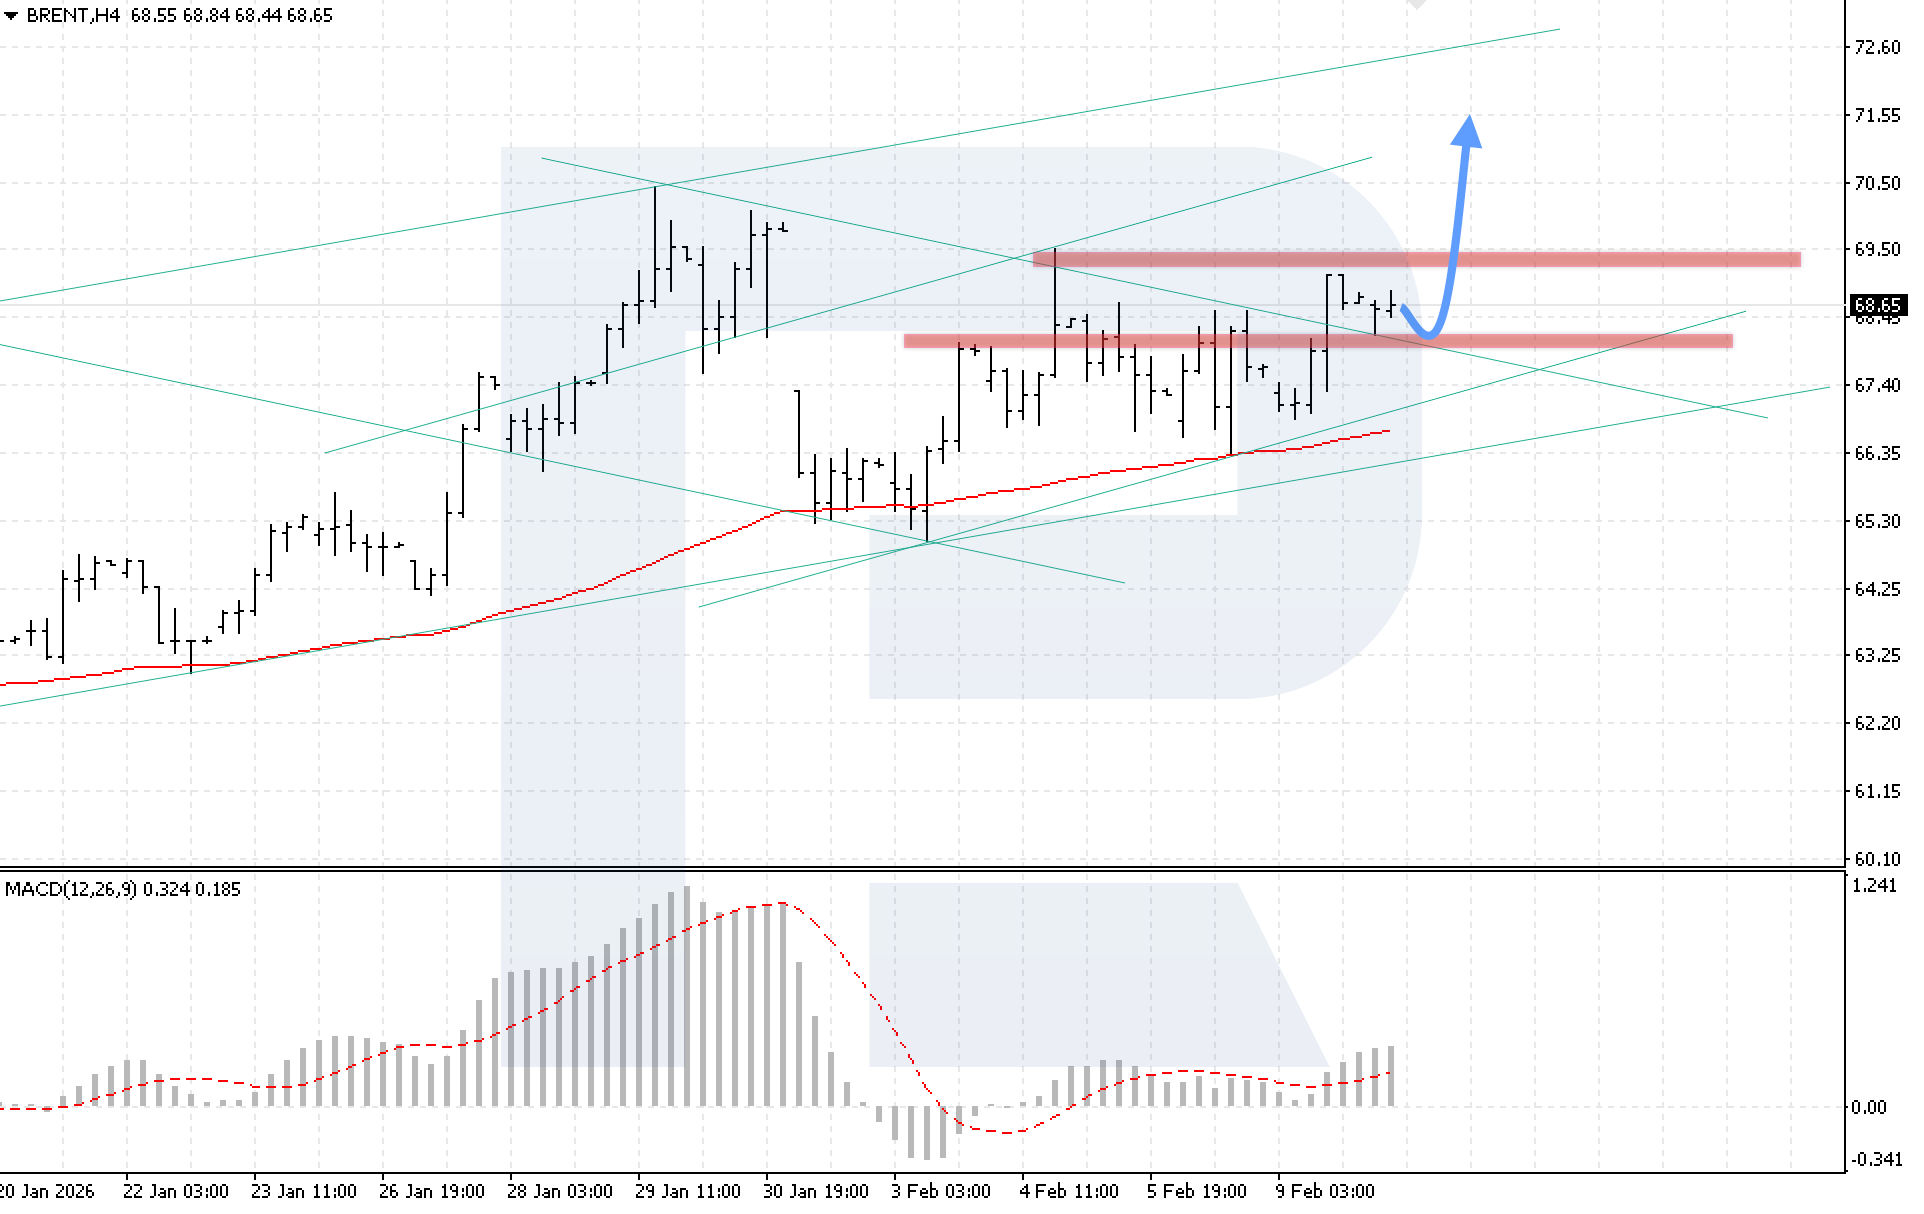
On the Brent H4 chart, the market completed a small growth wave, which allowed buyers to consolidate above the upper boundary of the downward channel. The nearest resistance level is located at 69,50. Today, 10 February 2026, the upward wave could continue with a target at 71,55 after a rebound from the upper boundary of the broken channel.
The technical picture confirms the bullish scenario. The MACD indicator shows histogram growth, and buyers have managed to neutralise the formation of a bearish divergence. The key condition for growth will be price consolidation above the 69,05 level, which will confirm a breakout above the upper boundary of the correction channel.
The alternative scenario will activate if the lower boundary of the channel is broken with consolidation below 69,50, indicating resumed bearish pressure and a continued decline.
Editors’ picks
 EURUSD 2026-2027 forecast: key market trends and future predictions
This article provides the EURUSD forecast for 2026 and 2027 and highlights the main factors determining the direction of the pair’s movements. We will apply technical analysis, take into account the opinions of leading experts, large banks, and financial institutions, and study AI-based forecasts. This comprehensive insight into EURUSD predictions should help investors and traders make informed decisions.
 Gold (XAUUSD) forecast 2026 and beyond: expert insights, price predictions, and analysis
Dive deep into the Gold (XAUUSD) price outlook for 2026 and beyond, combining technical analysis, expert forecasts, and key macroeconomic factors. It explains the drivers behind gold’s recent surge, explores potential scenarios including a move toward 4,500 to 5,000 USD per ounce, and highlights why the metal remains a strong hedge during global uncertainty.
Forecasts presented in this section only reflect the author’s private opinion and should not be considered as guidance for trading. RoboForex bears no responsibility for trading results based on trading recommendations described in these analytical reviews.