Daily technical analysis and forecast for 12 February 2026
Here is a detailed daily technical analysis and forecast for EURUSD, USDJPY, GBPUSD, AUDUSD, USDCAD, XAUUSD, and Brent for 12 February 2026.
EURUSD forecast
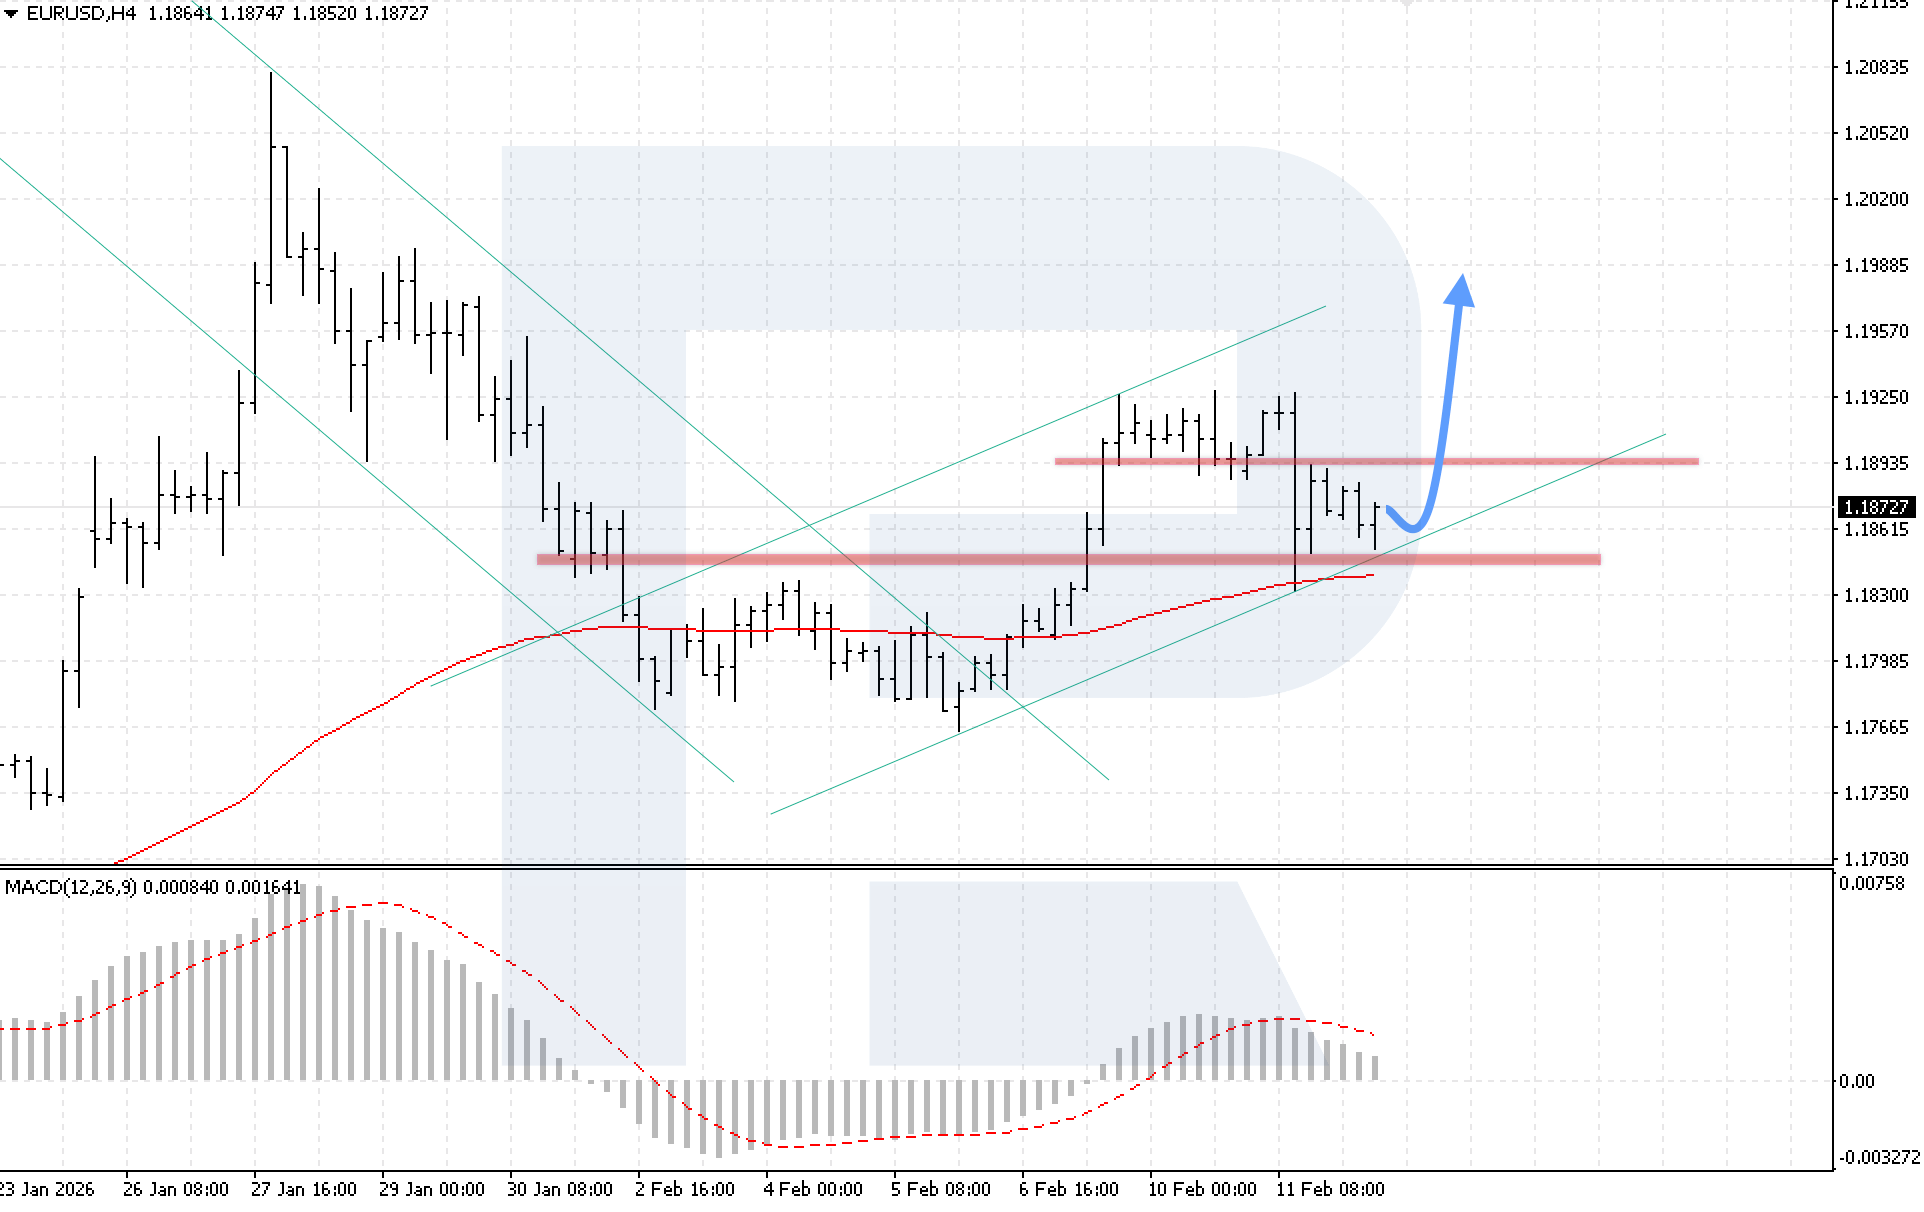
On the H4 chart of the EURUSD currency pair, the market is in a correction phase after breaking out of consolidation. Despite the recent decline, buyers are holding prices above the EMA-85. Today, 12 February 2026, the baseline scenario remains a rebound from the lower boundary of the ascending channel at 1.1905, followed by growth towards 1.1985.
The technical picture confirms this scenario. The MACD indicator shows a slowdown in histogram decline, while prices have tested the 1.1840 support level twice, which may indicate the formation of a Double Bottom reversal pattern. The key condition for continued growth will be confident consolidation above 1.1905, signalling a breakout above the upper boundary of the reversal pattern and confirming the resumption of bullish movement.
The alternative scenario will activate if the price declines below 1.1815. Such a breakout of the lower channel boundary would indicate a continued decline towards 1.1770.
USDJPY forecast
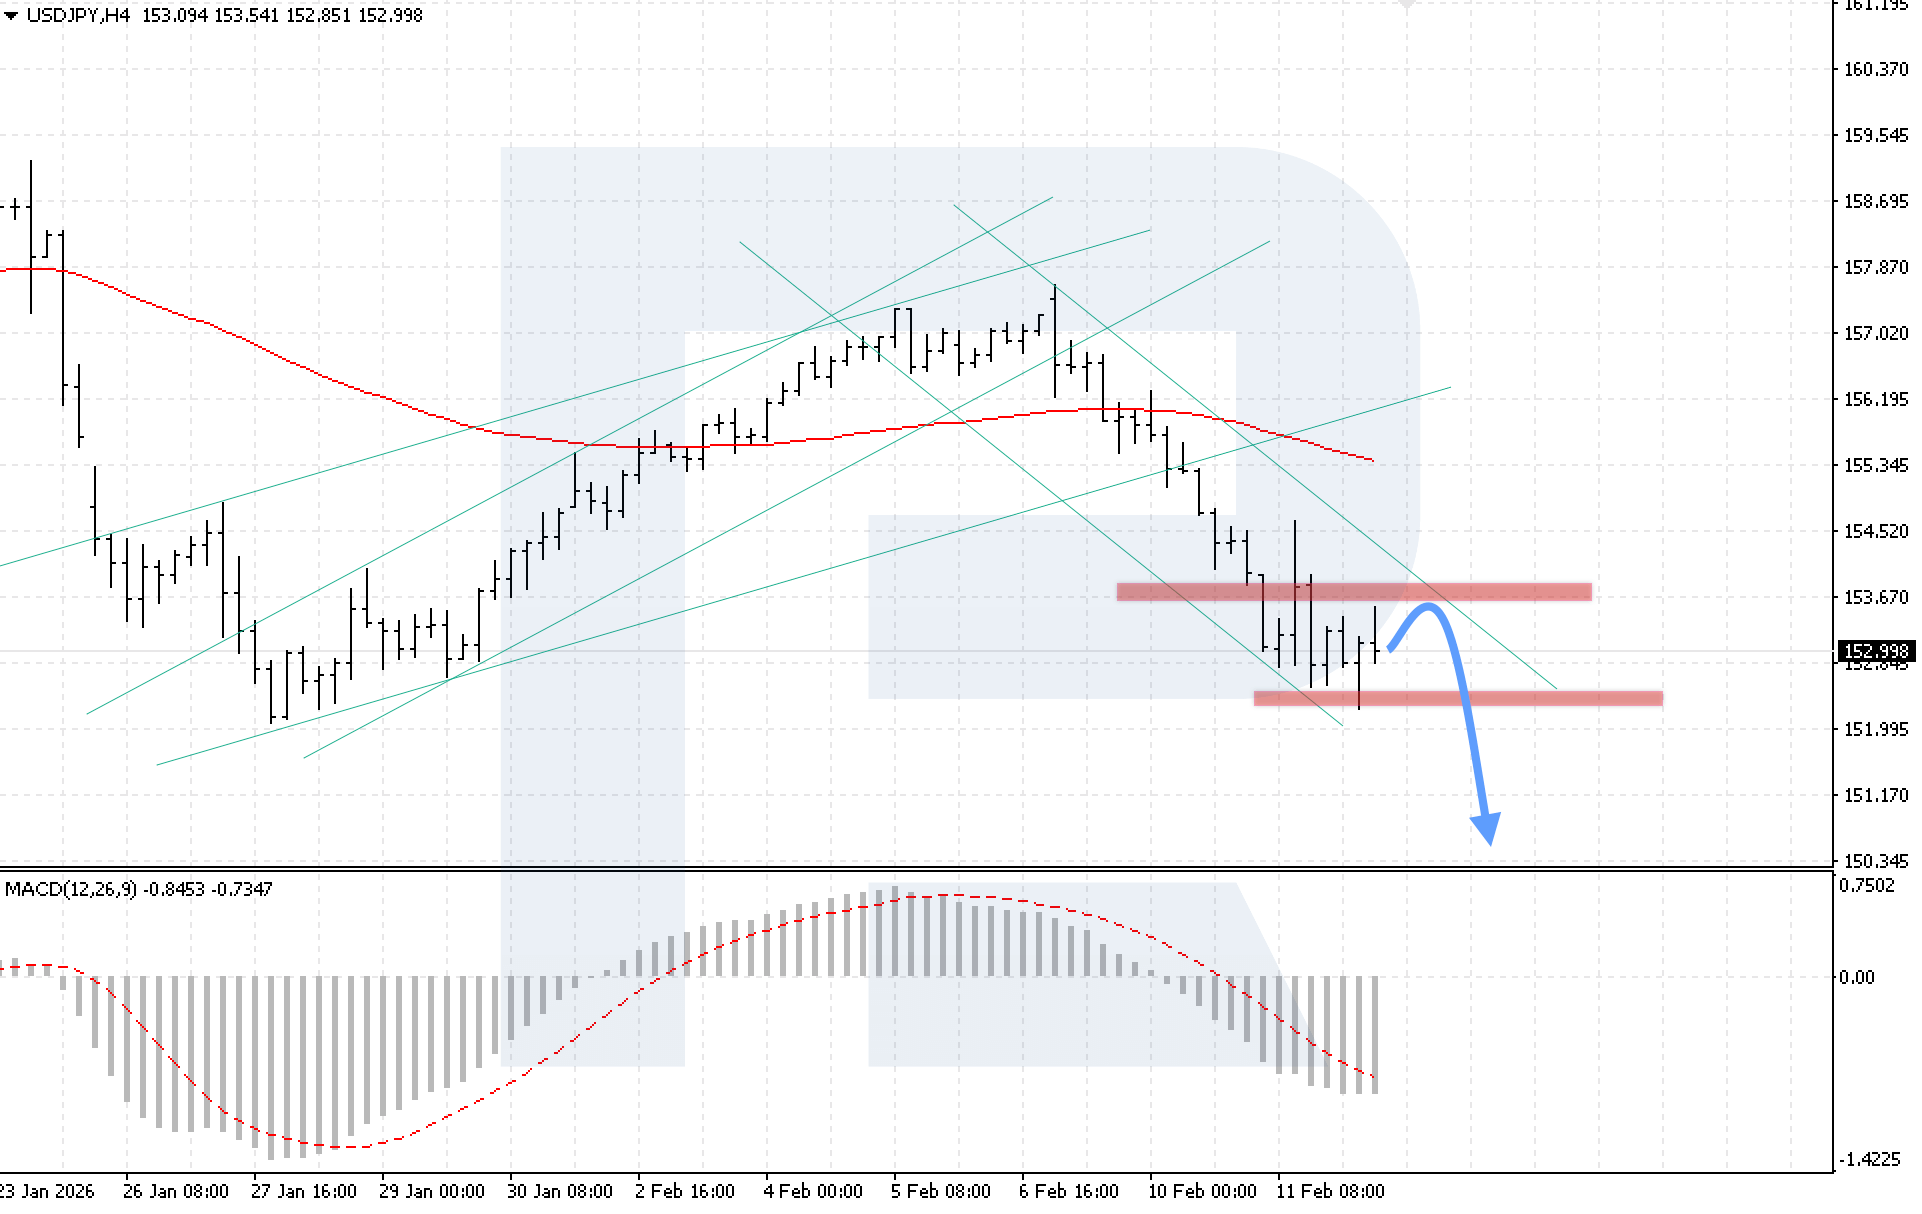
On the H4 chart of the USDJPY currency pair, the market is declining sharply within a descending channel after rebounding from the 153.65 resistance level. The nearest support zone is located at 152.15. Today, 12 February 2026, the baseline scenario suggests a continued decline towards a target of 150.55.
The technical picture confirms this scenario. The MACD indicator shows an active histogram decline despite some slowdown. The key condition for the bearish movement will be a breakout below the support level, followed by consolidation below 151.95, confirming continued downward momentum.
The alternative scenario will activate if the upper boundary of the descending channel is broken with consolidation above 153.15. Such a signal would create conditions for renewed growth in USDJPY.
GBPUSD forecast
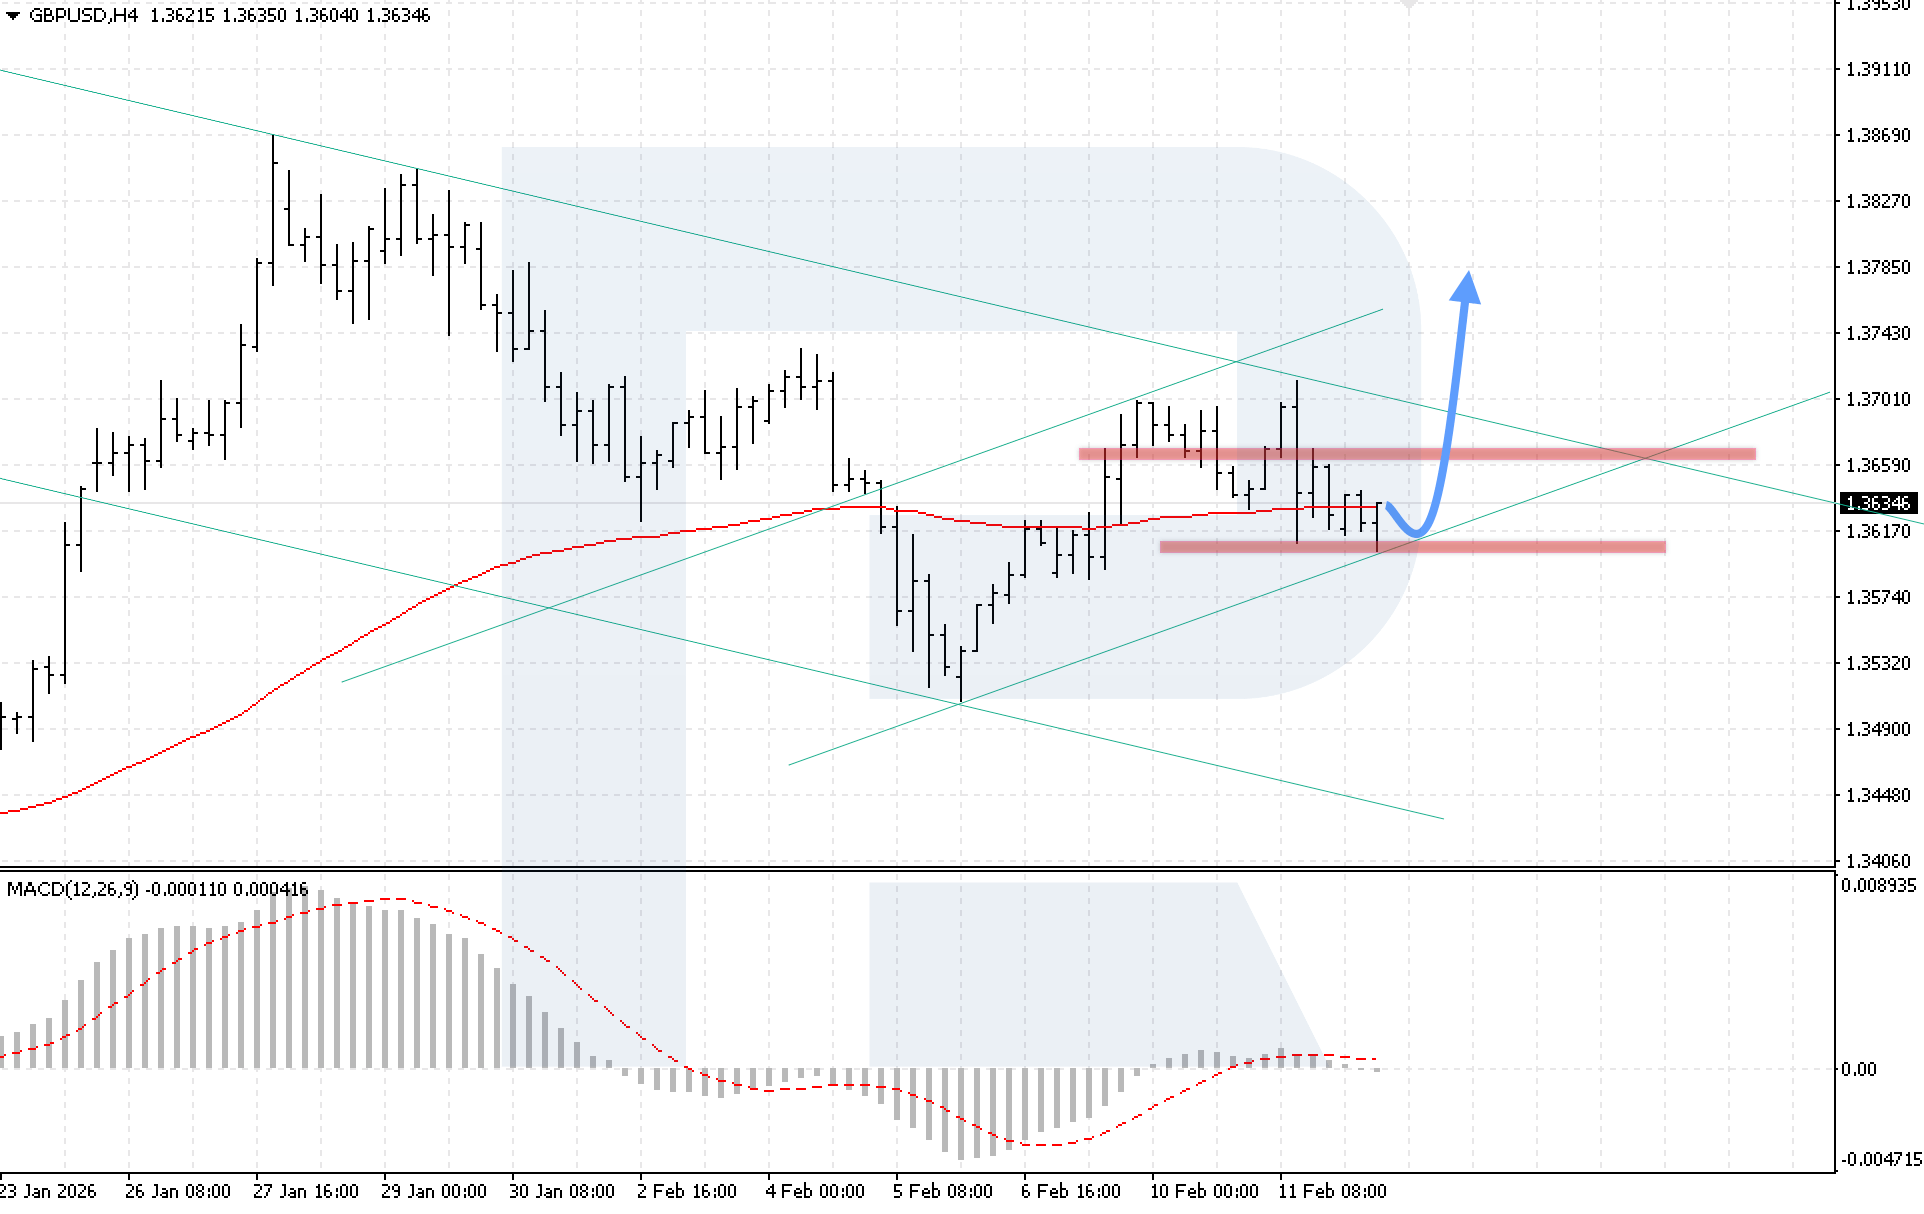
On the H4 chart of the GBPUSD currency pair, quotes continue to move within a correction, while buyers attempt to secure positions above the EMA-85. The nearest support level is located at 1.3605. Today, 12 February 2026, the baseline scenario suggests a rebound from the lower boundary of the bullish channel, followed by growth towards 1.3785.
The technical picture confirms this scenario. The MACD indicator shows a slowing decline, indicating a consolidation phase. The Head and Shoulders reversal pattern remains active. The key condition for continued growth will be consolidation above 1.3705, confirming a breakout above the upper boundary of the descending channel and strengthening the bullish outlook.
The alternative scenario will activate if the lower boundary of the bullish channel is broken with consolidation below 1.3605. Such a signal may trigger a deeper decline.
AUDUSD forecast
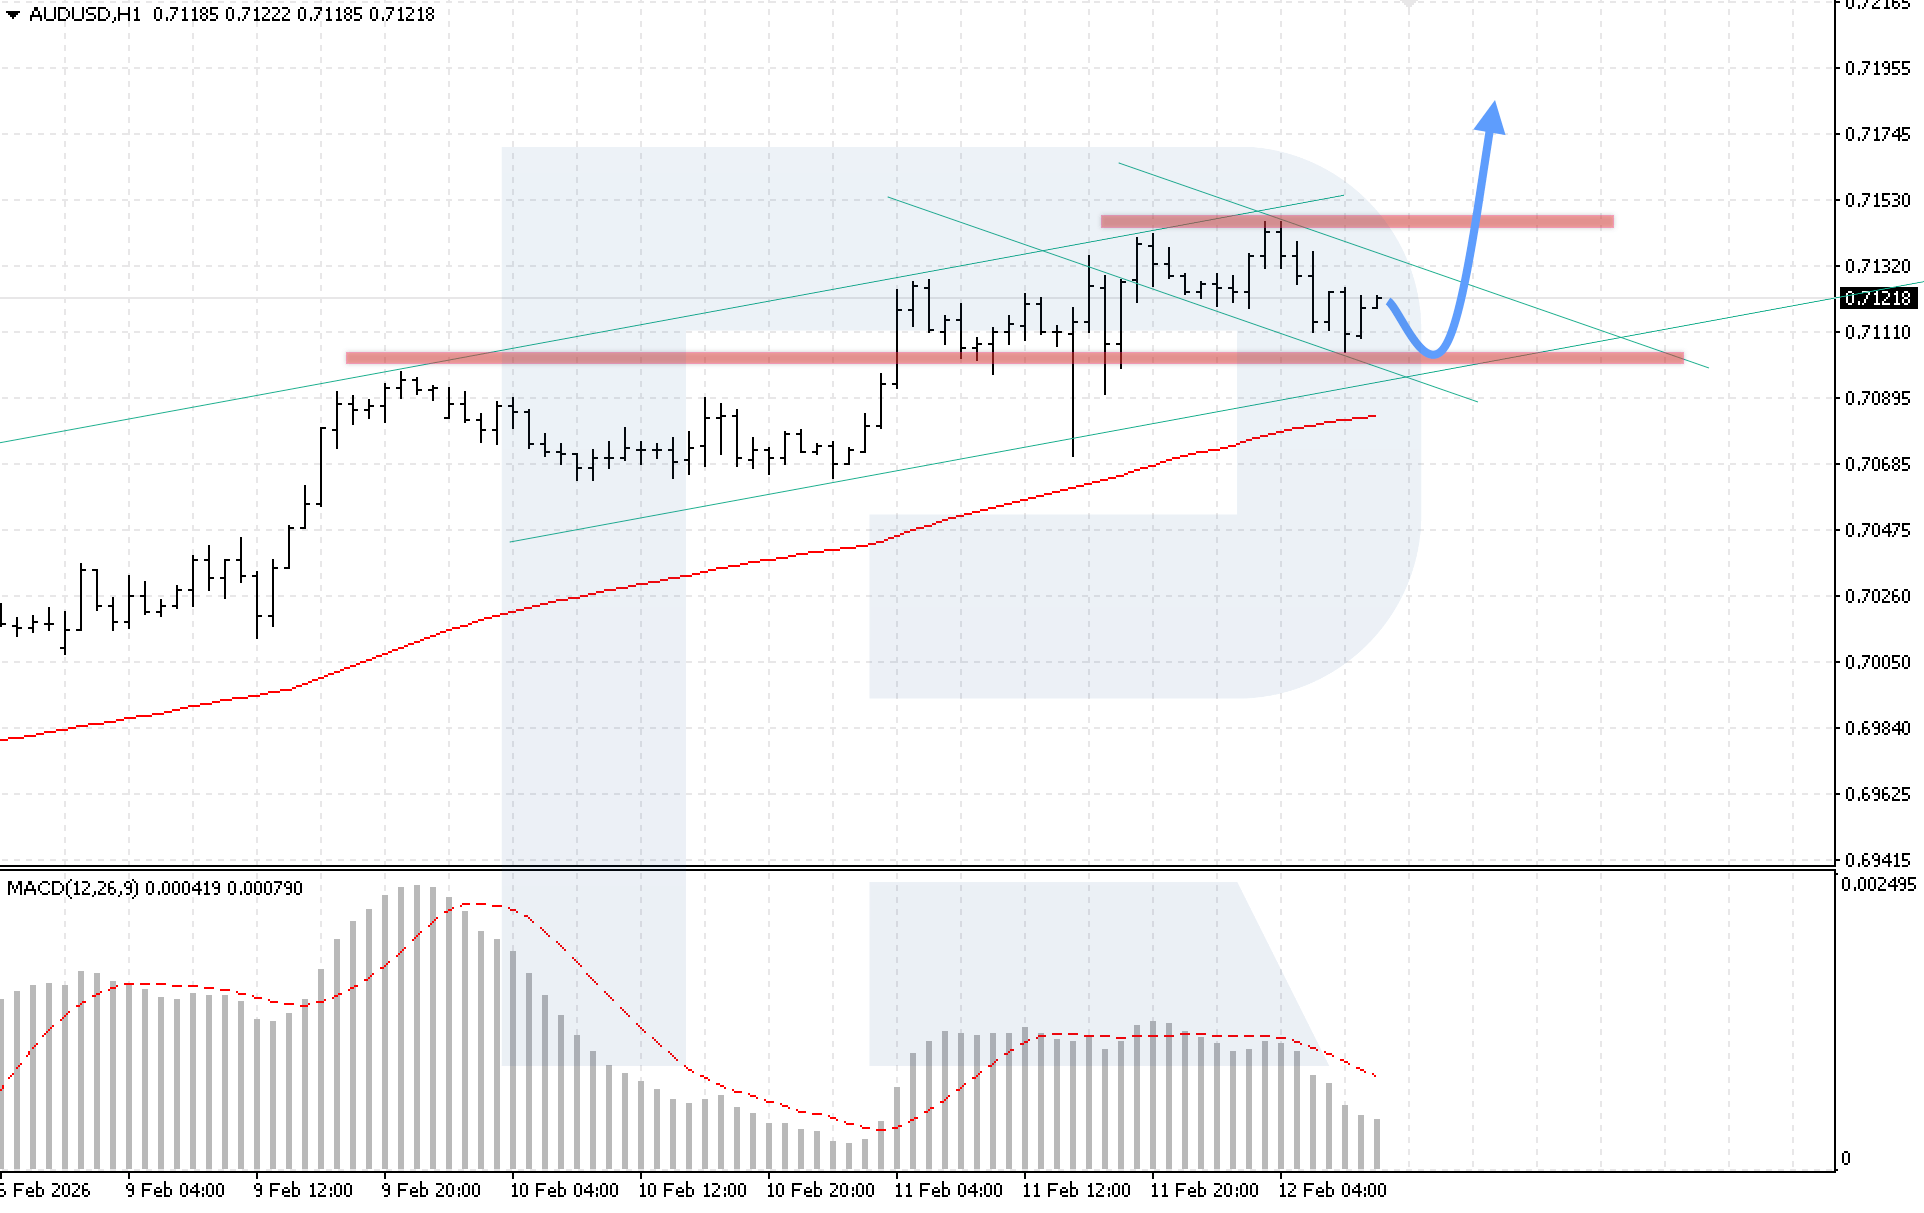
On the H4 chart of the AUDUSD currency pair, the market continues to correct, while prices remain above the EMA-85, indicating sustained bullish pressure. Today, 12 February 2026, the baseline scenario suggests continued bullish momentum after a rebound from the lower channel boundary, with a target at 0.7185.
The technical picture confirms this scenario. The MACD indicator shows renewed growth after a slowdown in histogram decline. The key condition for upward movement will be consolidation above 0.7135, signalling a breakout above the upper boundary of the descending correction channel.
The alternative scenario will activate if the price breaks below the support level and consolidates below 0.7065. Such a signal would indicate a potential breakout below the lower boundary of the bullish channel and further decline towards lower levels.
USDCAD forecast
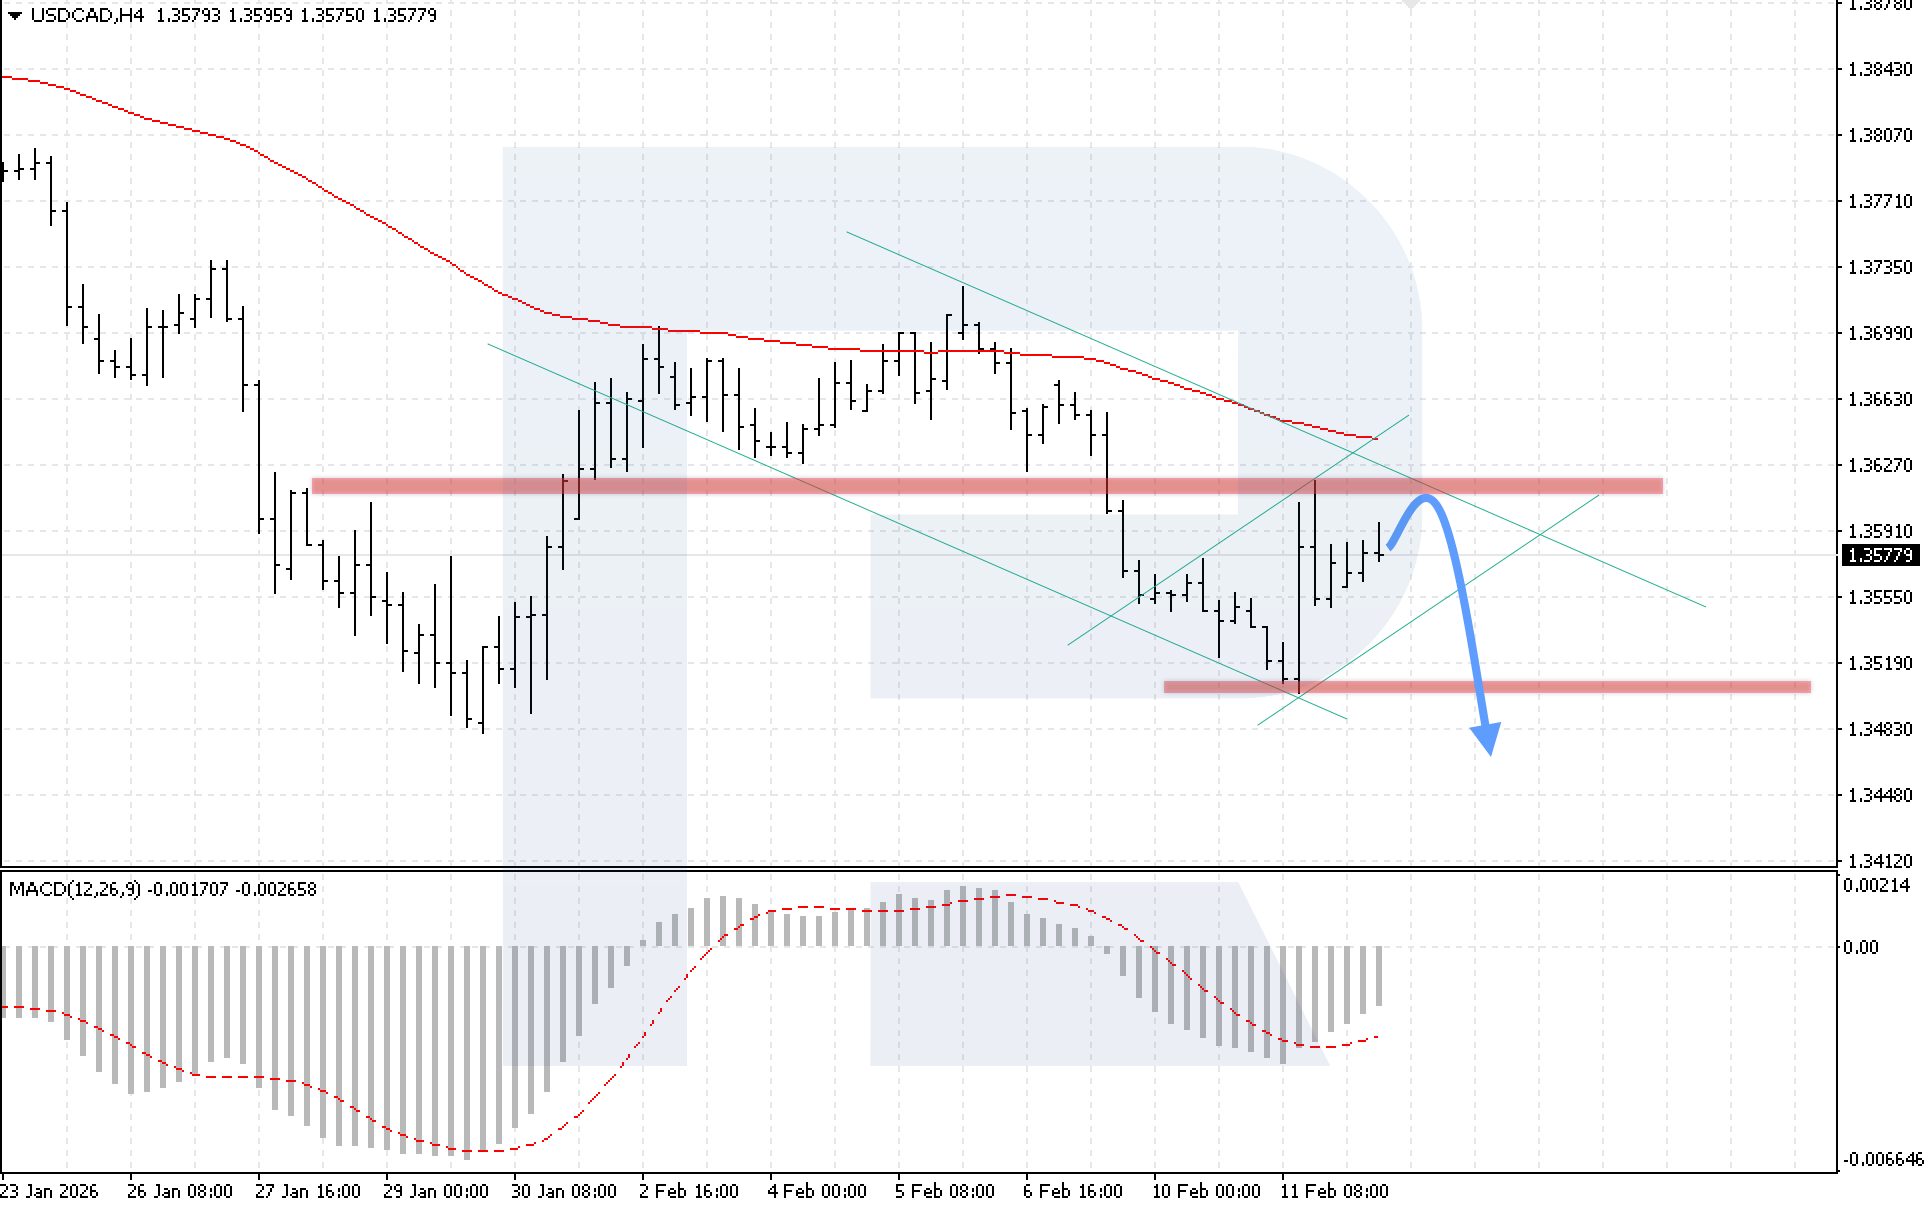
On the H4 chart of the USDCAD currency pair, the market continues to move within a bullish correction, while prices remain below the EMA-85, indicating persistent bearish pressure. Today, 12 February 2026, the baseline scenario suggests a continued decline with a target at 1.3475 after a rebound from the upper boundary of the descending channel at 1.3595.
The technical picture confirms the bearish scenario. The MACD indicator shows slowing growth, and another rebound from 1.3595 would signal strengthening selling pressure. The key condition for continued decline will be consolidation below 1.3535, indicating a breakout below the lower boundary of the correction channel.
The alternative scenario will activate if the upper boundary of the descending channel is broken with consolidation above 1.3625. Such a signal would indicate renewed growth in the USDCAD pair.
XAUUSD forecast
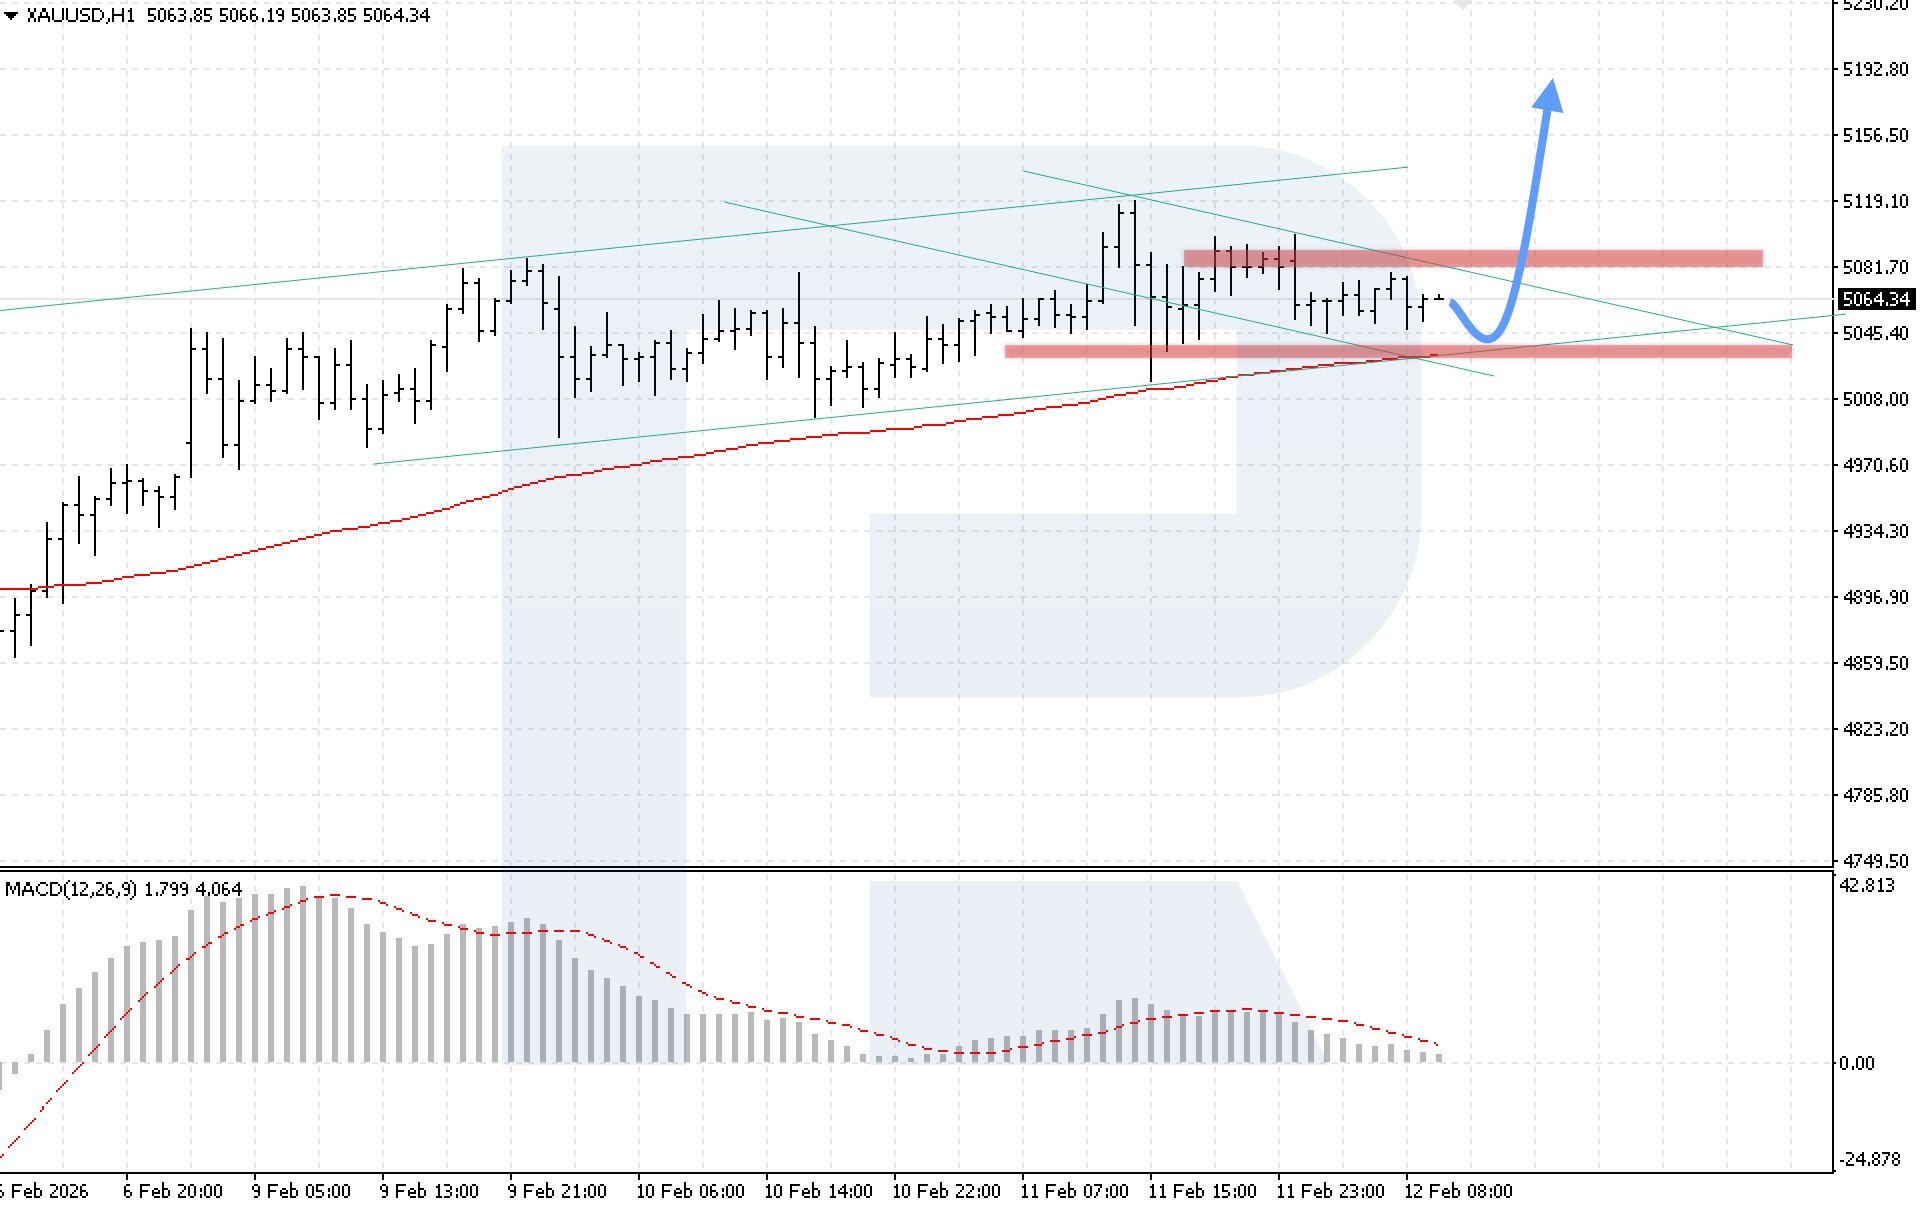
On the XAUUSD H4 chart, the market continues to move within consolidation. Prices are trapped between the 5,080 resistance level and the 5,040 support level. Today, 12 February 2026, the baseline scenario suggests continued growth after a rebound from local support, with a target at 5,195.
The technical picture confirms this scenario. The MACD indicator shows renewed growth, while buyers keep prices above the EMA-85 line. The key condition for upward movement will be consolidation above 5,080, signalling a breakout above the upper boundary of the correction channel.
The alternative scenario will activate if the price breaks below the local support level and consolidates below 5,025. Such a signal may trigger a continued correction.
Brent forecast
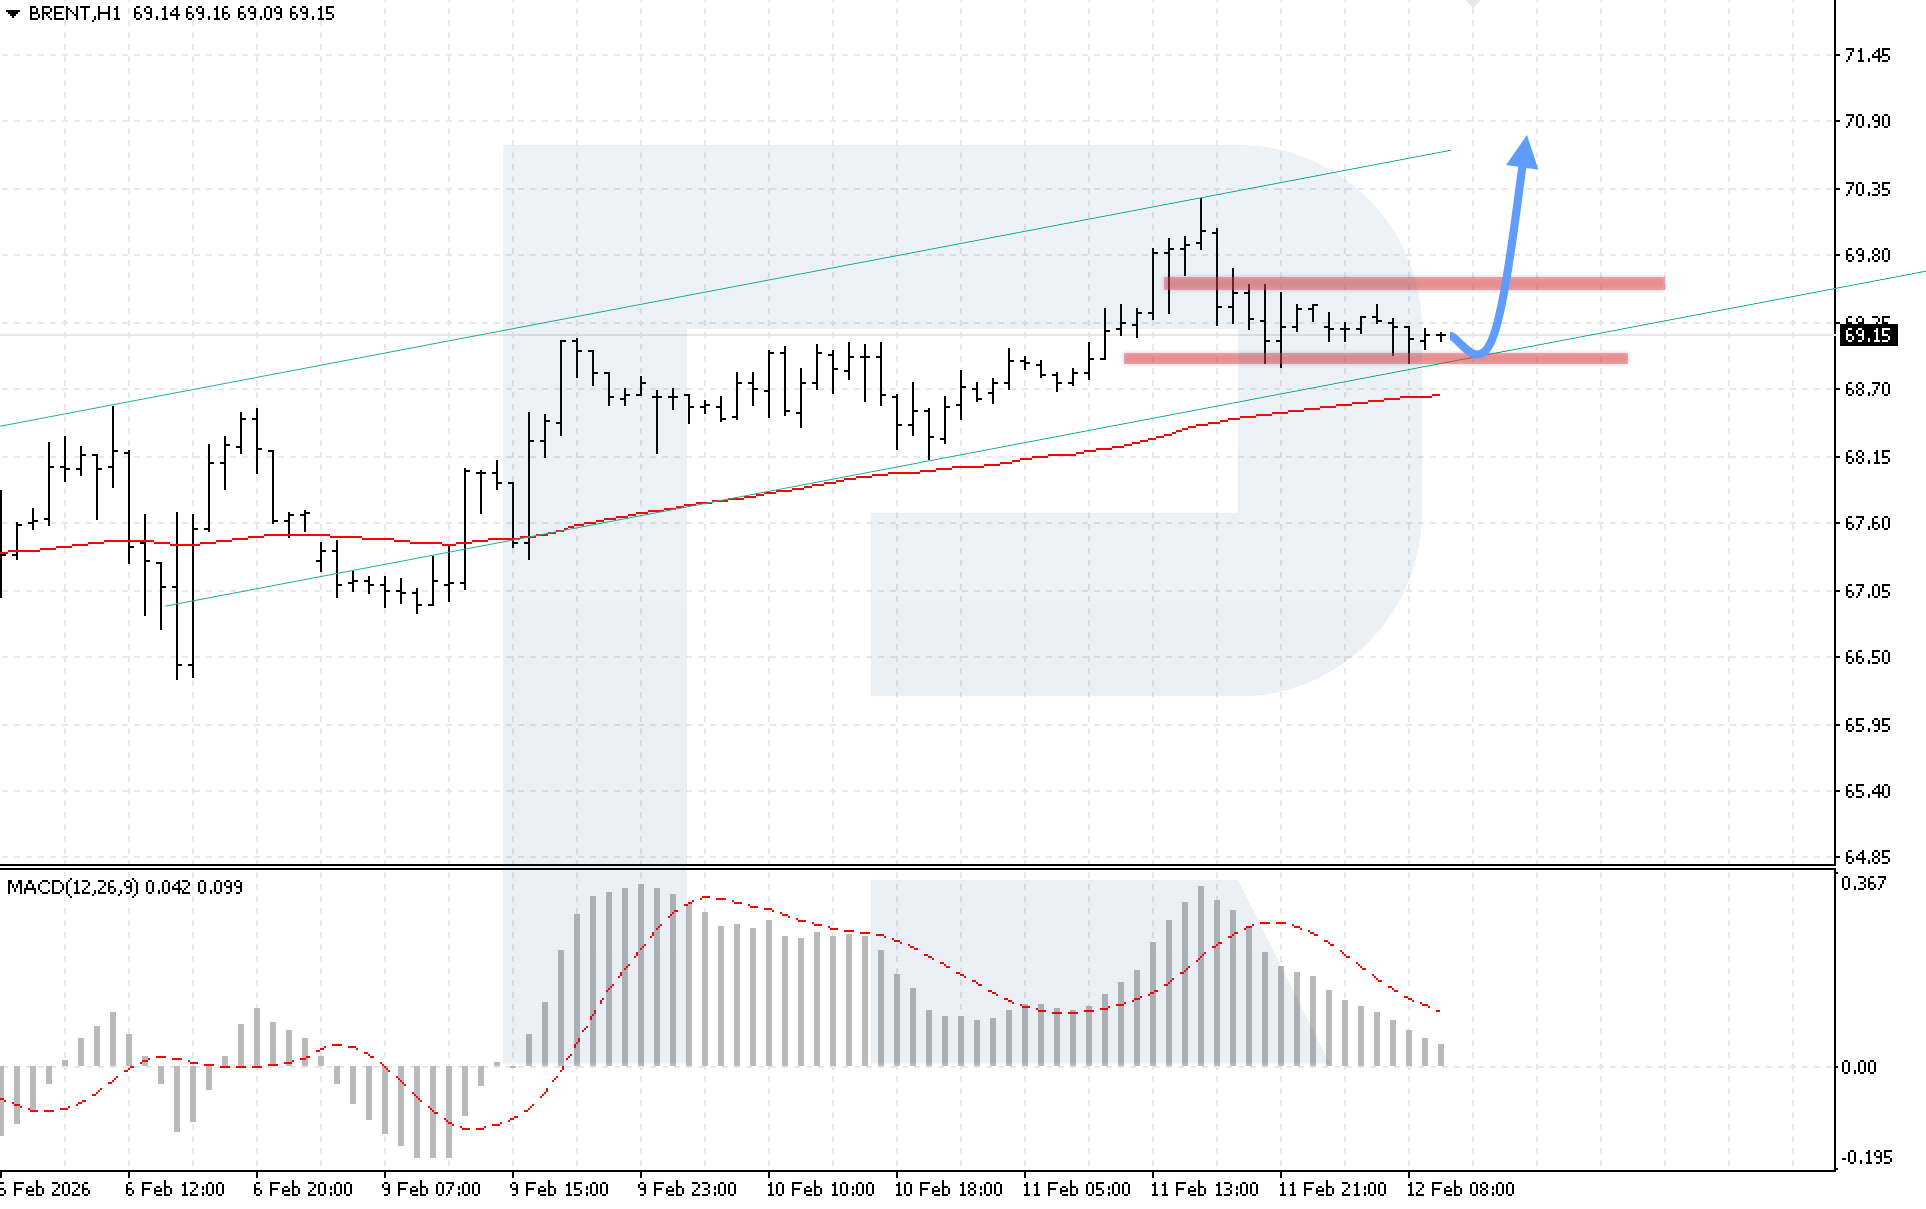
On the H4 chart of Brent crude oil, the market is correcting within a bullish channel, with buyers keeping prices above the EMA-85. There are still risks of a Double Bottom reversal pattern forming, as prices rebounded from the 69.00 support level for the second time. Today, 12 February 2026, the baseline scenario suggests continued upward movement after a rebound from the lower channel boundary, with a target at 70.85.
The technical picture confirms the bullish scenario. The MACD indicator shows a slowing histogram decline. The key condition for growth will be consolidation above 69.10, confirming a breakout above the upper boundary of the Double Bottom pattern and signalling the start of pattern implementation with higher targets.
The alternative scenario will activate if the lower boundary of the channel is broken with consolidation below 68.55. Such a signal would indicate renewed bearish pressure and a continued decline towards 67.05.
Editors’ picks
 EURUSD 2026-2027 forecast: key market trends and future predictions
This article provides the EURUSD forecast for 2026 and 2027 and highlights the main factors determining the direction of the pair’s movements. We will apply technical analysis, take into account the opinions of leading experts, large banks, and financial institutions, and study AI-based forecasts. This comprehensive insight into EURUSD predictions should help investors and traders make informed decisions.
 Gold (XAUUSD) forecast 2026 and beyond: expert insights, price predictions, and analysis
Dive deep into the Gold (XAUUSD) price outlook for 2026 and beyond, combining technical analysis, expert forecasts, and key macroeconomic factors. It explains the drivers behind gold’s recent surge, explores potential scenarios including a move toward 4,500 to 5,000 USD per ounce, and highlights why the metal remains a strong hedge during global uncertainty.
Forecasts presented in this section only reflect the author’s private opinion and should not be considered as guidance for trading. RoboForex bears no responsibility for trading results based on trading recommendations described in these analytical reviews.