Monthly technical analysis and forecast for December 2025
In this monthly technical analysis, we examine key chart patterns and levels for the EURUSD, USDJPY, GBPUSD, AUDUSD, USDCAD pairs, gold (XAUUSD), and Brent crude oil to forecast potential developments for December 2025.
Major technical levels to watch in December 2025
- EURUSD: Support 1.1470, 1.1400. Resistance 1.1616, 1.1720
- USDJPY: Support 154.90, 151.90. Resistance 158.00, 161.00
- GBPUSD: Support 1.2888, 1.2580. Resistance 1.3300, 1.3400
- AUDUSD: Support 0.6370, 0.6200. Resistance 0.6550, 0.6600
- USDCAD: Support 1.3970, 1.3900. Resistance 1.4160, 1.4270
- Gold (XAUUSD): Support: 4140, 4070. Resistance: 4285, 4400
- Brent: Support: 60.00, 59.00. Resistance: 69.10, 78.30
EURUSD forecast
Two key forces shape December for the currency market:
- structural pressure on the dollar due to US fiscal policy.
- mounting economic strain within the eurozone related to energy and seasonal factors.
US
Despite aggressive tariff measures and the administration’s attempts to increase revenues, the chronic deficit remains the dominant risk factor. Rising debt burdens and the constant need for borrowing create medium-term preconditions for dollar weakness, although in the short term, the USD retains support due to high yields and safe-haven status.
Eurozone
By year-end, pressure on the economy rises due to:
- increased seasonal expenditures in the energy sector, amplified by a cold winter;
- deepening political tensions within the bloc over the budget and support for energy programs;
- a rising probability of a recession scenario in several core EU countries.
This imbalance makes the euro vulnerable and supports the development of deeper downside waves.
Overall, December’s fundamental backdrop favours a bearish EURUSD model, despite the US long-term fiscal weaknesses.
EURUSD technical analysis
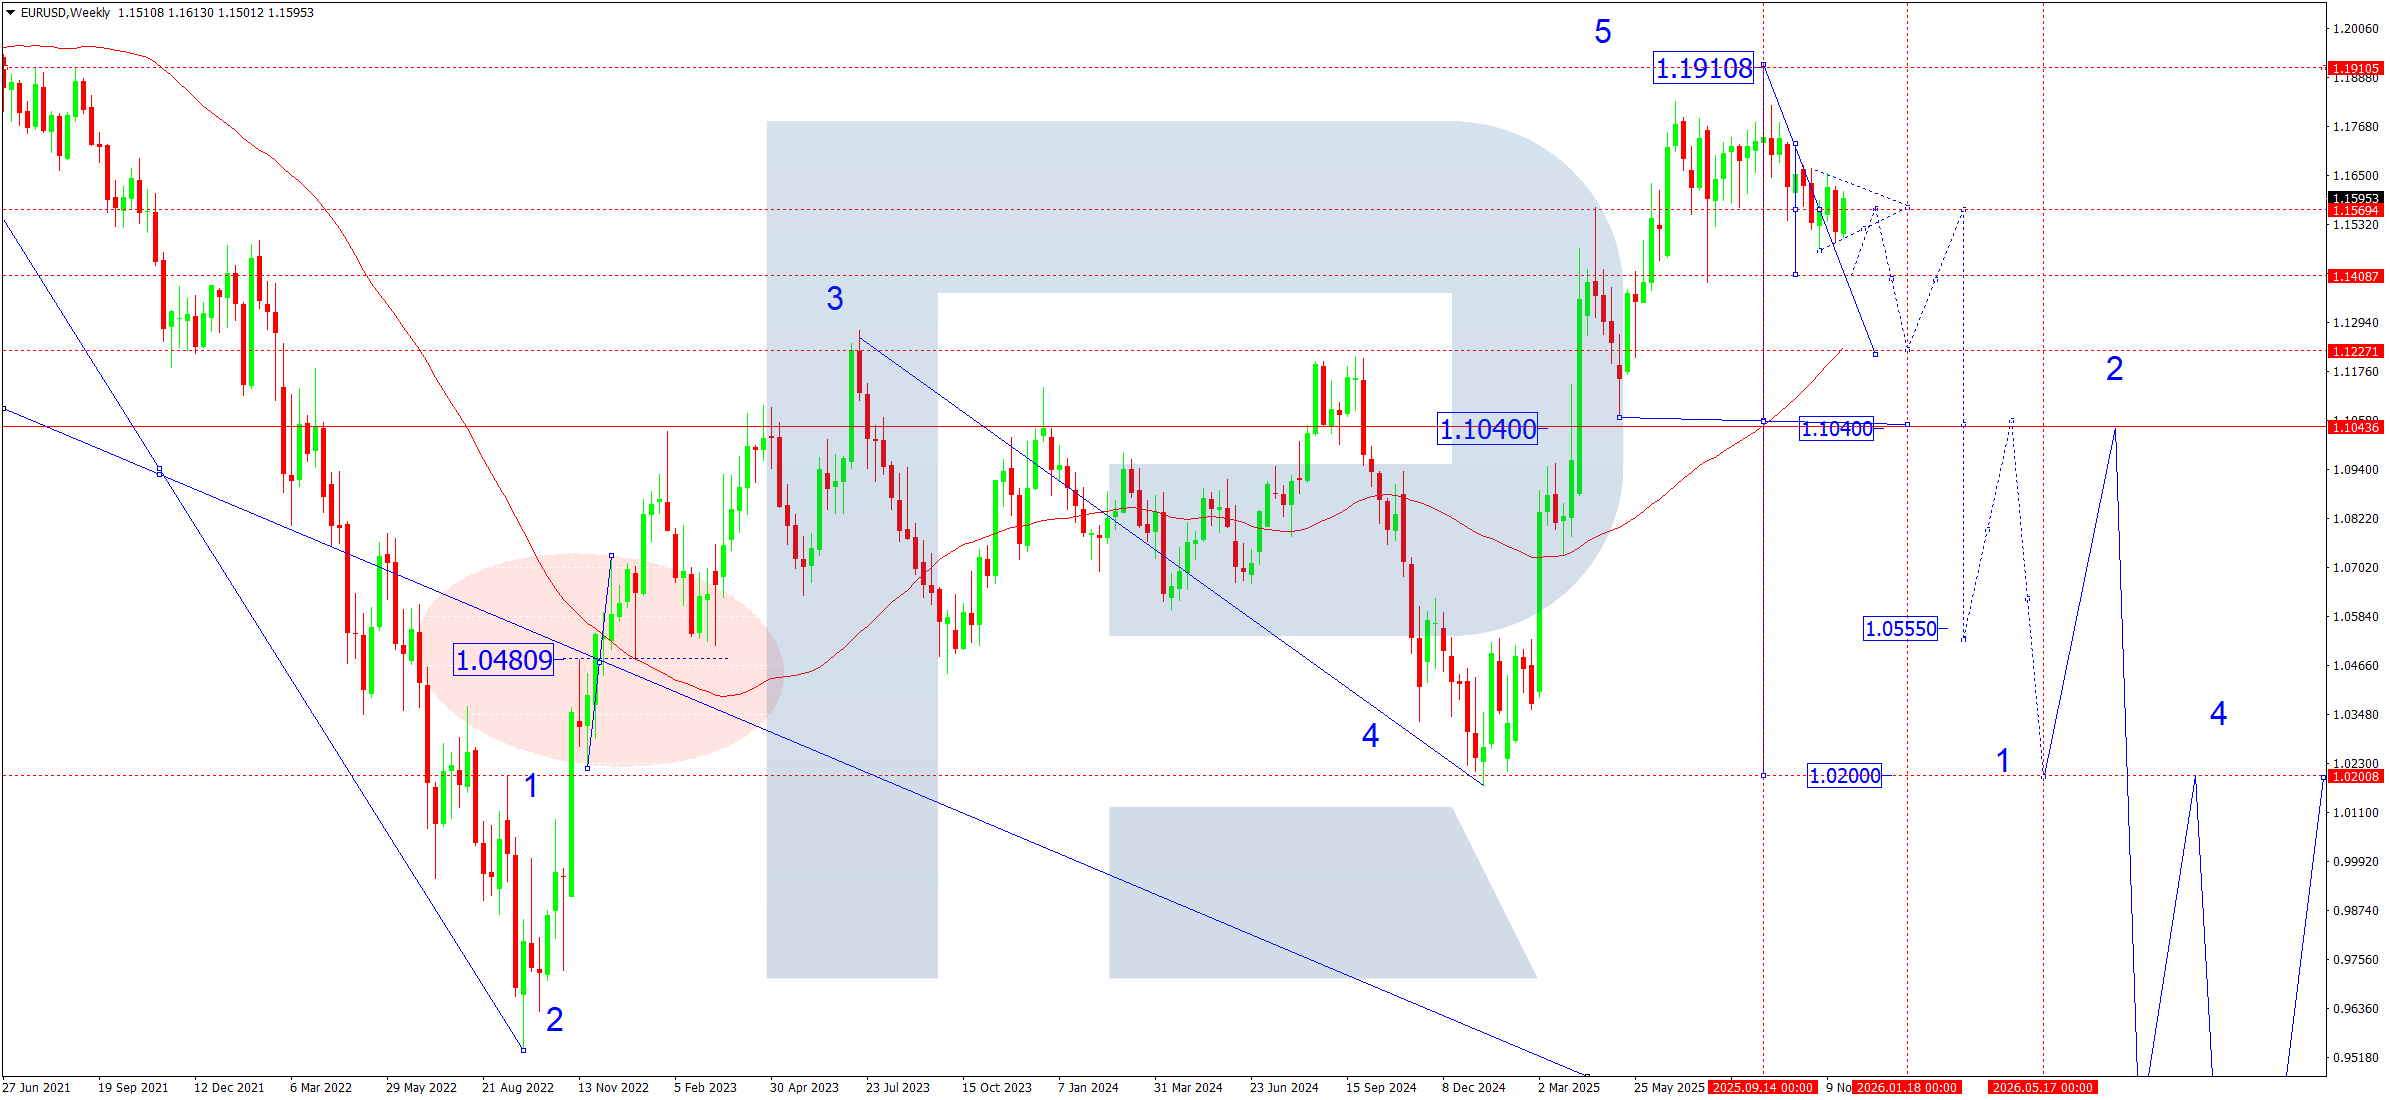
On the weekly chart, the EURUSD pair continues to develop the first structure in the first downward wave of the entire long-term trend.
Current wave configuration
- First downward wave: 1.0200
- Second corrective wave: 1.1040
- Pivot point of the entire downward wave: 1.0200
- Third wave (estimated target): 0.9330
- Fourth correction: return to 1.0200
- Fifth wave: target of 0.8500
During December, the market is developing the structure of the first downward wave with a medium-term target at 1.1222.
Expectations for December:
- decline to 1.1400
- correction towards 1.1550 (testing from below)
- continued decline to 1.1222
This structure matches the estimated model of the downtrend shown on the chart.
EURUSD forecast scenarios for December 2025
Bearish (baseline) scenario: the winter season increases pressure on the eurozone economy, with rising energy costs, industrial slowdown, and political disagreements giving the dollar an edge despite US problems.
Activation conditions:
- rebound from the 1.1616 resistance area
- a confident breakout below the 1.1500 support level
Downside targets:
- key target of the first wave: 1.1222
- possible wave extension: 1.1040
The market may decline fairly briskly if EU data deteriorates faster.
Bullish (alternative, but unlikely) scenario: US fiscal problems gradually undermine dollar resilience. The budget deficit grows, and tariff policy delivers less benefit than expected.
Activation conditions:
A confident breakout and consolidation above 1.1720.
Upside targets:
- 1.1820
- correction back to 1.1720
- development of an impulse to 1.2000
The probability of this scenario remains low while the euro is constrained by fundamental weaknesses.
USDJPY forecast
The dollar remains supported by expectations of tighter US fiscal policy and an increased need for external financing. The market closely watches the Bank of Japan’s response: despite reduced purchase volumes, the BoJ maintains ultra-loose policy parameters, creating a stable yield differential in favor of the dollar.
Amid instability in US debt markets and rising geopolitical risks, demand for the USD as a safe-haven asset increases. Japan’s domestic data remains mixed: moderate wage growth does not offset the industrial slowdown, lowering the likelihood of aggressive central-bank actions.
Thus, the fundamental backdrop continues to support the USDJPY pair within a medium-term uptrend.
USDJPY technical analysis
The USDJPY pair formed a wide consolidation range around 151.90 and broke out upwards, confirming the formation of an impulse in the fifth upward wave.
At the moment, the local target of the growth structure at 157.77 has been reached, and the breakout of the weekly SMA50 and consolidation above it formed a pivot point for the fifth wave.
In December, a corrective move towards 154.90 is possible, with the price testing the previously broken range boundary from above.
After the correction completes, growth is expected to continue towards 158.00; a breakout above this level would open the path to the next estimated target of the third wave within the fifth – 161.00.
The main target of the fifth wave in the uptrend remains at 163.33.
USDJPY forecast scenarios for December 2025
Bullish (baseline) scenario: the breakout above the 151.70–151.90 range has already opened the way to the target of the third wave within the fifth – 161.00.
If the momentum strengthens, with sustained consolidation above 158.00 and rising volumes, the market can head towards 163.33, the main target of the fifth wave.
Bearish (alternative) scenario: if the market forms a sustained breakout and consolidation below 154.90, this will signal another move of the corrective wave.
In this case, a decline back to the key 151.90 support level is expected.

GBPUSD forecast
In December, the fundamental outlook for the British pound remains mixed.
Key focus points:
- Inflation dynamics in the UK – expectations of inflation acceleration weigh on the consumer sector but support the probability of higher rates for longer than in the US
- Bank of England policy – the regulator maintains a hawkish tone, preventing a deep GBP sell-off; however, the market is pricing the start of rate cuts in Q1 2026
- US dollar – focus on the Trump administration’s hawkish rhetoric towards trade partners and the search for additional budget revenues. This leads to periodic increases in USD volatility
- Geopolitics – localised risks in Europe and rising tensions in the Caribbean create heightened USD demand during stress periods, potentially increasing pressure on the GBP
Taken together, the fundamentals point to limited upside potential for the GBPUSD pair and elevated risks of the downtrend resuming towards mid-month.
GBPUSD technical analysis
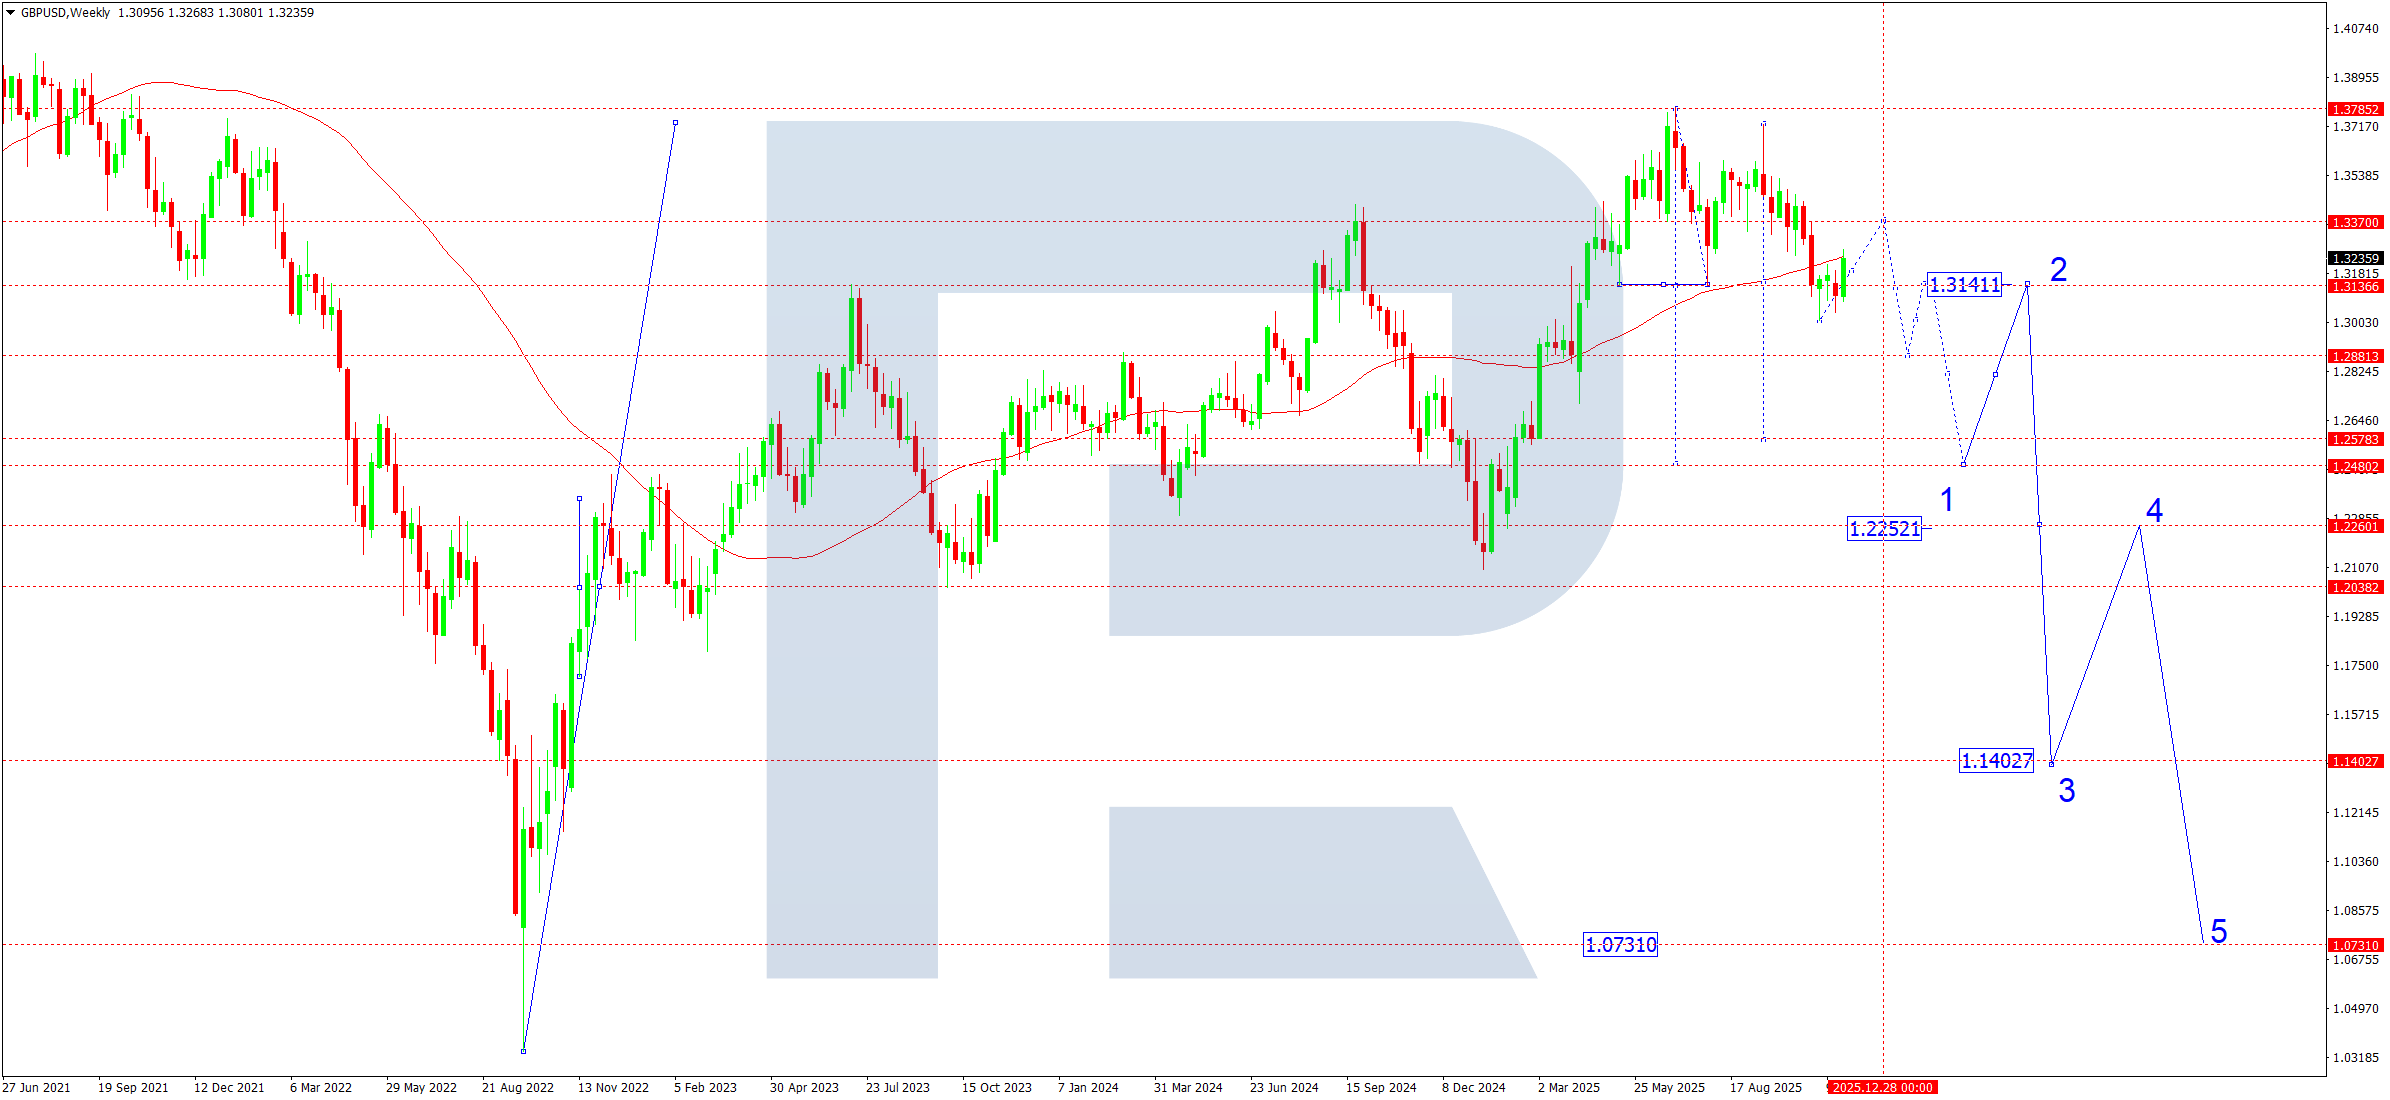
On the weekly chart, the GBPUSD pair formed a wide consolidation range around the key 1.3150 level and broke out upwards, opening potential for short-term growth. The pair has reached the local upside target of 1.3260. The market may then form a corrective move down to retest 1.3150 from above. After the retest, another attempt up to 1.3300 is not excluded – this is the final target of the corrective wave. Then, once the corrective structure ends, a reversal downwards and continuation of the trend wave lower are expected:
- first target: 1.2888
- prospective target: 1.2570
The overall technical picture indicates weak bullish potential in early December and significant bearish risks towards mid-month.
GBPUSD forecast scenarios for December 2025
Bearish (baseline) scenario: a breakout below 1.3140 has opened the potential to develop a downside wave:
- targets: 1.2888 and 1.2580
Any local upside attempts can at any moment end with a sharp sell-off — a trend-continuation phase.
Bullish (alternative) scenario: alternative scenario (bullish, unlikely)
An upside impulse with a breakout above 1.3220, confirmed by rising volumes, will open the path to 1.3300 as the final target of the corrective wave before a possible new decline.
AUDUSD forecast
In December, the AUDUSD performance will be shaped by commodity markets, RBA and Fed policy, and external geopolitical volatility.
Key factors of the month:
- Reserve Bank of Australia (RBA) policy
The RBA maintains hawkish rhetoric due to structural services inflation, but the market is increasingly pricing in a pause in H1 2026.
Weak domestic consumption and a cooling real-estate market limit the RBA’s scope for further rate hikes.
- US Federal Reserve
December typically increases USD volatility on the back of expected FOMC comments regarding the 2026 cycle. The Fed keeps rates at a peak level, while the market considers cuts closer to Q2–Q3 2026. The USD retains moderate support thanks to year-end capital repatriation and high Treasury yields.
- Commodity markets (a key factor for the AUD)
Pressure on commodity prices (especially iron ore and copper) limits demand for the Australian dollar. China shows slowing recovery momentum, reducing export demand – traditionally negative for the AUD.
An additional driver is high volatility in energy markets amid geopolitical uncertainty. The fundamental combination remains moderately bearish for the AUD, in line with the priority technical downside scenario.
AUDUSD technical analysis
On the weekly chart, the AUDUSD pair continues to develop a broad consolidation range around 0.6540 while remaining in a medium-term downtrend.
Key expectations for December:
- Immediate movement structure
In December, a downward move towards 0.6370 is expected – the first nearby target in the current wave. After reaching this level, a corrective pullback to 0.6530 (testing of the consolidation level from below) is possible.
- Medium-term direction
Once the correction ends, a new downside wave is expected to develop, with the next target at 0.6200, a key support level. The main target in the developing downward wave is 0.5880, where an important medium-term support lies, as shown on the chart. The current structure of the downward wave and its sequence fully align with the pattern on the weekly chart.
AUDUSD forecast scenarios for December 2025
Bearish (baseline) scenario: a breakout below 0.6480 opened the door to the first wave towards 0.6370. If volatility in commodity markets intensifies, a faster move towards 0.5880 – the main target zone of the downward wave – is possible.
Bullish (alternative) scenario: a breakout above the 0.6580 resistance level would cancel the nearest downside wave and launch another upside structure towards 0.6700, 0.6780, and 0.6850, although the probability of this scenario in December remains low.

USDCAD forecast
In December, the USDCAD market remains under the influence of several key factors:
- US Federal Reserve policy
Expectations regarding the rate path remain mixed. Slowing inflation at the end of the year increases speculation about a possible easing cycle in 2026; however, Fed officials maintain hawkish rhetoric, supporting the dollar.
- Canada’s economic indicators
Slower GDP growth, weaker business activity, and a soft construction sector limit CAD’s upside potential. The Bank of Canada keeps a cautious tone and stands ready to move towards easing if necessary.
- Commodity factor (oil)
Despite attempts by oil prices to recover, pressure from globally slowing demand limits support for the Canadian currency. The oil market remains volatile, adding uncertainty to USDCAD dynamics.
The fundamental backdrop is moderately bullish for the dollar, supporting the base scenario of continued USDCAD gains.
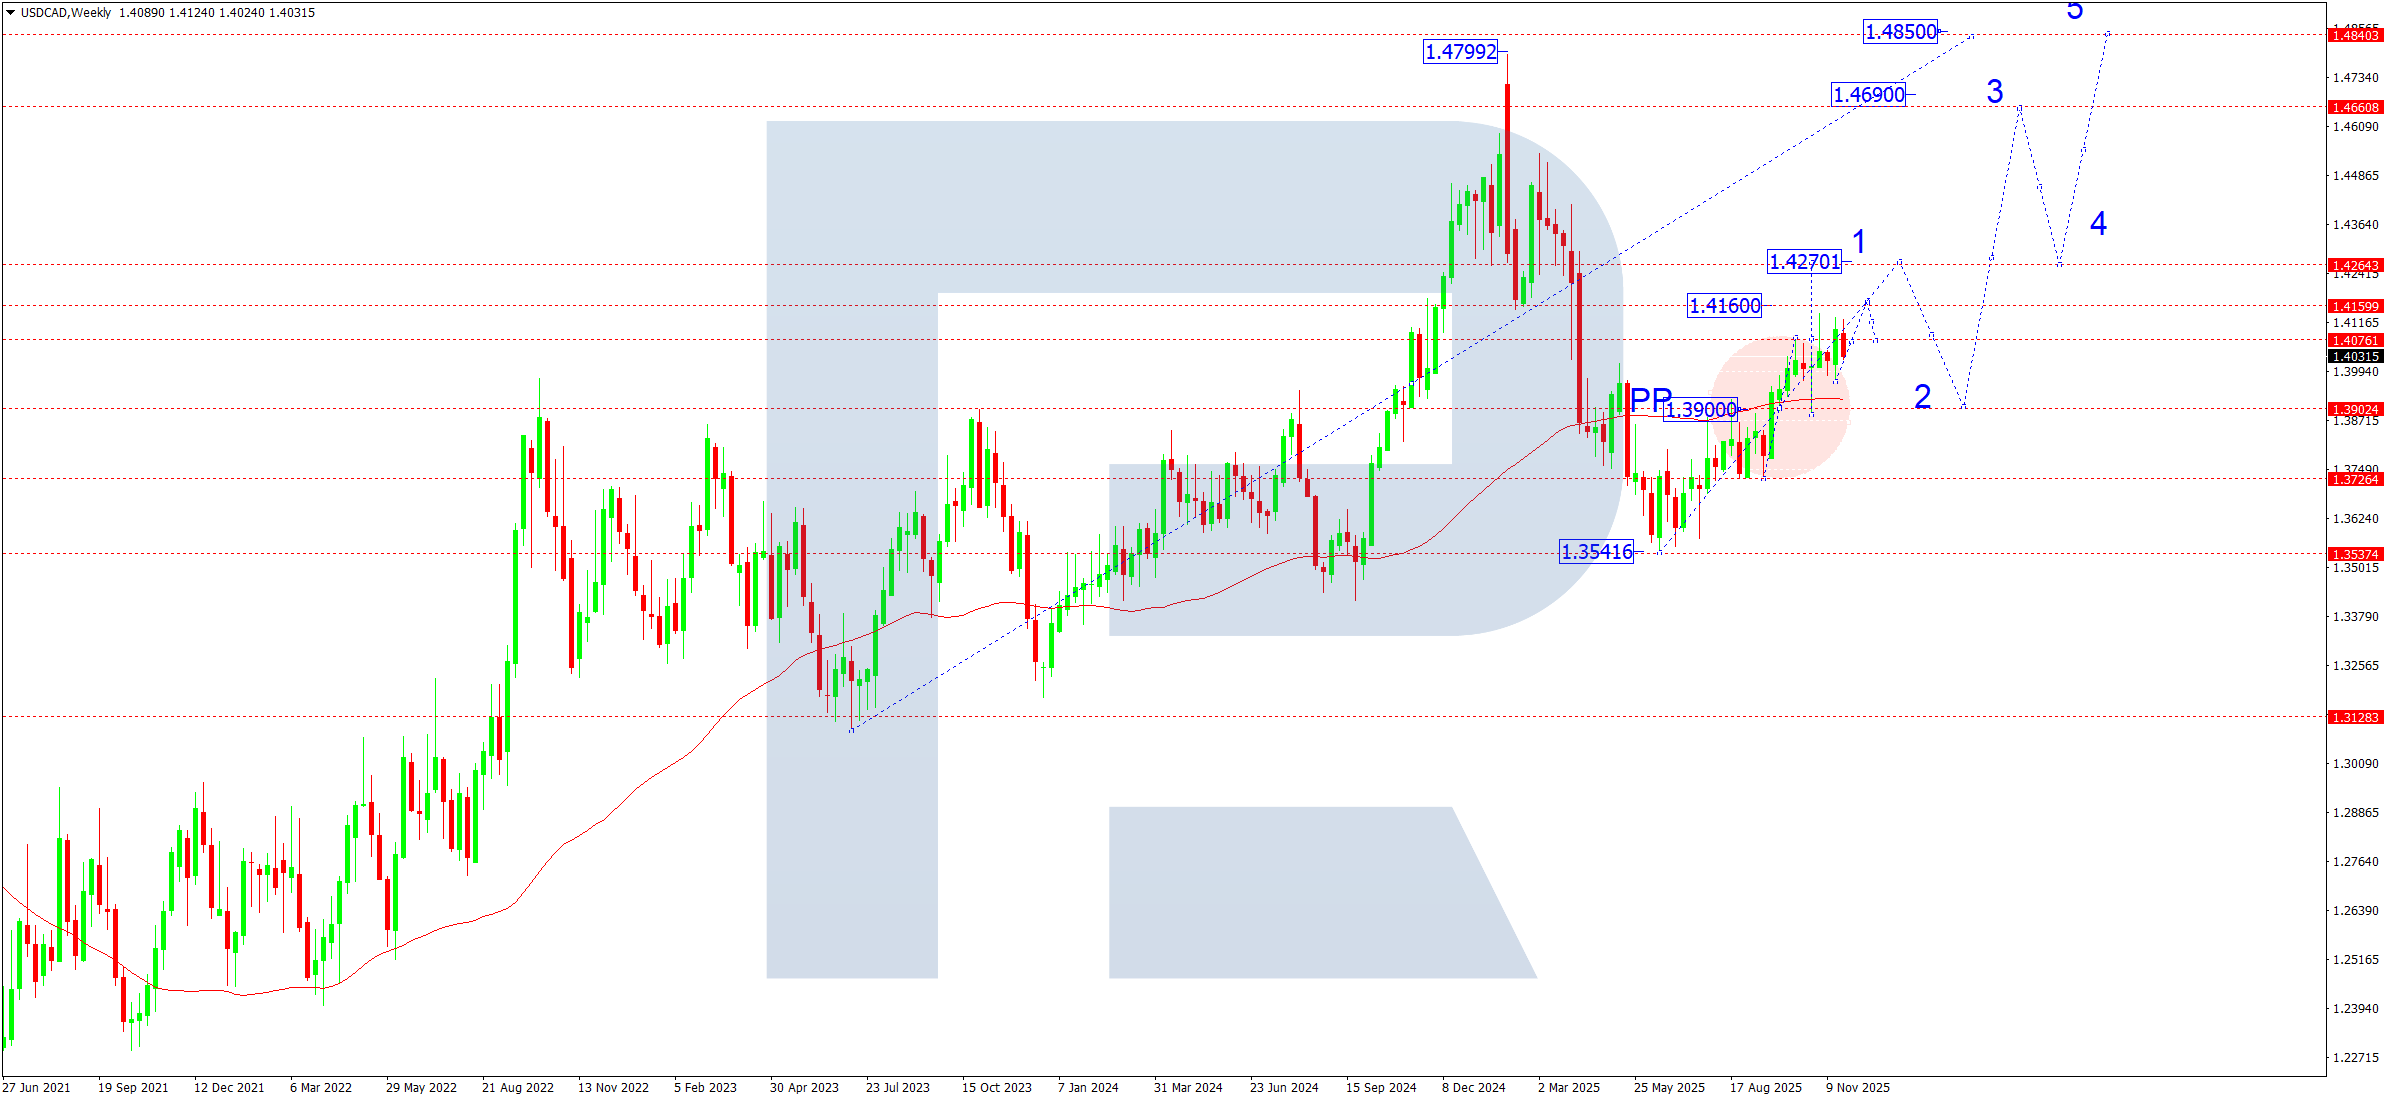
USDCAD technical analysis
On the weekly chart, the market broke 1.4070 and formed a consolidation range around this mark. In December, the pair is expected to break above the range within the first upward wave, targeting 1.4270. Thereafter, a corrective move down to 1.3900 is likely – this will form the second wave. After the correction ends, a new upward wave is expected with a local target of 1.4690 and the main trend target of 1.4850. The overall structure indicates a continued medium-term bullish trend after a local pause.
USDCAD forecast scenarios for December 2025
Bullish (baseline) scenario: a breakout and consolidation above the 1.4070 area confirms further development of the upward structure with targets at 1.4160 and 1.4270. The bullish structure remains intact while the price is above the SMA50.
Bearish (alternative) scenario: a breakout and consolidation below 1.3970 on rising volumes will open the way to continued downward movement towards 1.3900.
XAUUSD forecast
The gold market enters December amid persistently elevated demand for safe-haven assets. Participants continue to assess prospects for US monetary policy in 2026. Expectations for Federal Reserve rate cuts remain moderate, keeping gold at high levels.
Geopolitical risks and record gold purchases by global central banks in recent quarters add to volatility. Bond-market yields have stabilised, easing pressure on the precious metal.
Overall, the fundamental backdrop remains mixed, but with a modest tilt toward price support. Safe-haven demand and official-sector interest offset short-term correction risks.
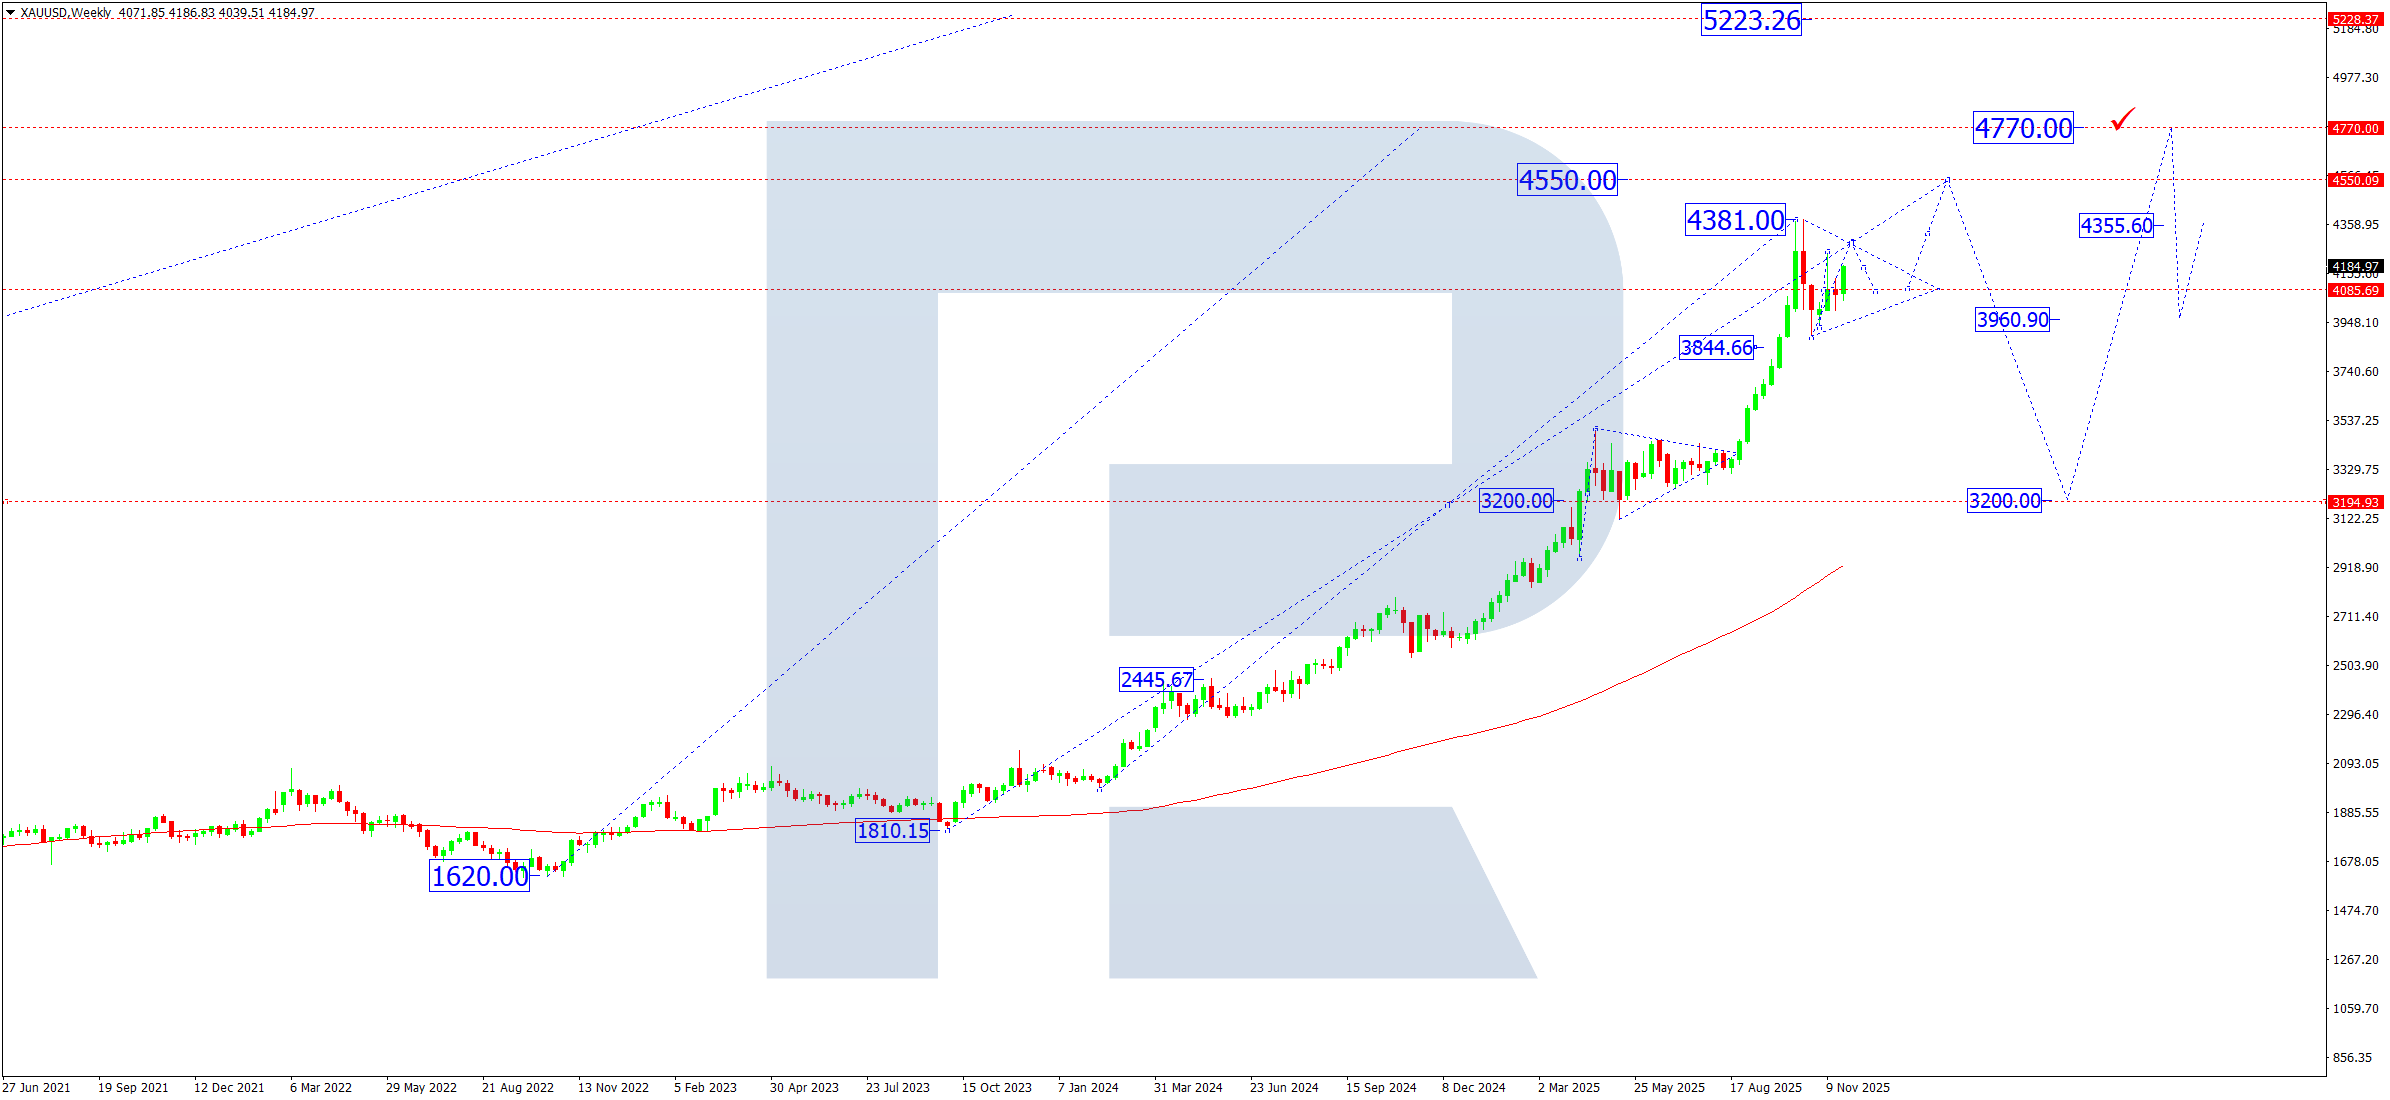
XAUUSD technical analysis
On the weekly chart, the market continues to develop a broad consolidation range around 4,140. In terms of structure, the market is forming a classic Triangle at the top of the previous upside impulse.
In December, prices are expected to rise towards the local target at 4,285, followed by a possible correction towards 4,070.
If quotes move below 4,070, the Triangle’s range will be broken to the downside, opening bearish potential first to 3,844, with scope to extend the correction to 3,660 as the structure expands. If the range breaks upwards, the market will be able to continue its upward momentum towards 4,555, which will be viewed as development of the triangle’s upper branch and continuation of the global trend.
Thus, the market is in an accumulation phase before a directional move, with the key boundaries of the range to determine subsequent price behaviour.
XAUUSD forecast scenarios for December 2025
Bullish (baseline) scenario: a breakout and consolidation above 4,140 confirms potential for a rise to 4,285 with scope to refresh the high towards 4,400–4,555.
Bearish (alternative) scenario: a breakout below the 4,070 level will start a corrective wave with targets at 3,844 and, if the impulse strengthens, 3,660.
Brent forecast
The oil market continues to balance between constrained supply and uneven demand. The main drivers remain:
- OPEC+ decisions on production quotas
- dynamics of global industrial activity
- geopolitical risks in the Middle East and along key shipping routes
- the level of US strategic reserves and the pace of their replenishment
In December, market participants are guided by expectations of moderate quota tightening while keeping the cartel’s key price near 100 USD.
Brent technical analysis
On the weekly chart, Brent has completed a corrective wave and started to develop the first structure of an upward impulse within the fifth wave of the uptrend. The rise is directed towards 69.10, the nearest target of the first structure. The current move is viewed as part of the first wave within the fifth, with an estimated target of 78.30.
In December, prices could reach this level, after which the market may form a corrective move towards the 69.00 area. The five-wave structure of further trend growth is marked on the chart. The long-term trend target is 104.00, with intermediate consolidation zones.
Brent forecast scenarios for December 2025
Bullish (baseline) scenario: if prices hold above 69.00 and the geopolitical backdrop remains tense, a breakout above the 81.00 zone can accelerate growth towards the 94.00 target, with further potential to 104.00. The 100 level remains strategically important for OPEC+ and may guide quota adjustments.
Bearish (alternative) scenario: in the absence of progress from OPEC+ and amid weak global macroeconomic data, a return to the broader range around 60.00 is possible. A deeper decline to 59.00 is also not excluded.

Forecasts presented in this section only reflect the author’s private opinion and should not be considered as guidance for trading. RoboForex bears no responsibility for trading results based on trading recommendations described in these analytical reviews.