Weekly technical analysis and forecast (3–7 November 2025)
This weekly technical analysis highlights the key chart patterns and levels for EURUSD, USDJPY, GBPUSD, AUDUSD, USDCAD, gold (XAUUSD), and Brent crude oil to forecast market moves for the upcoming week (3–7 November 2025)
Major technical levels to watch this week
- EURUSD: Support: 1.1515, 1.1240. Resistance: 1.1660, 1.1740
- USDJPY: Support: 151.50, 149.80. Resistance: 154.40, 157.57
- GBPUSD: Support: 1.3150, 1.3000. Resistance: 1.3250, 1.3500
- AUDUSD: Support: 0.6488, 0.6350. Resistance: 0.6620, 0.6700
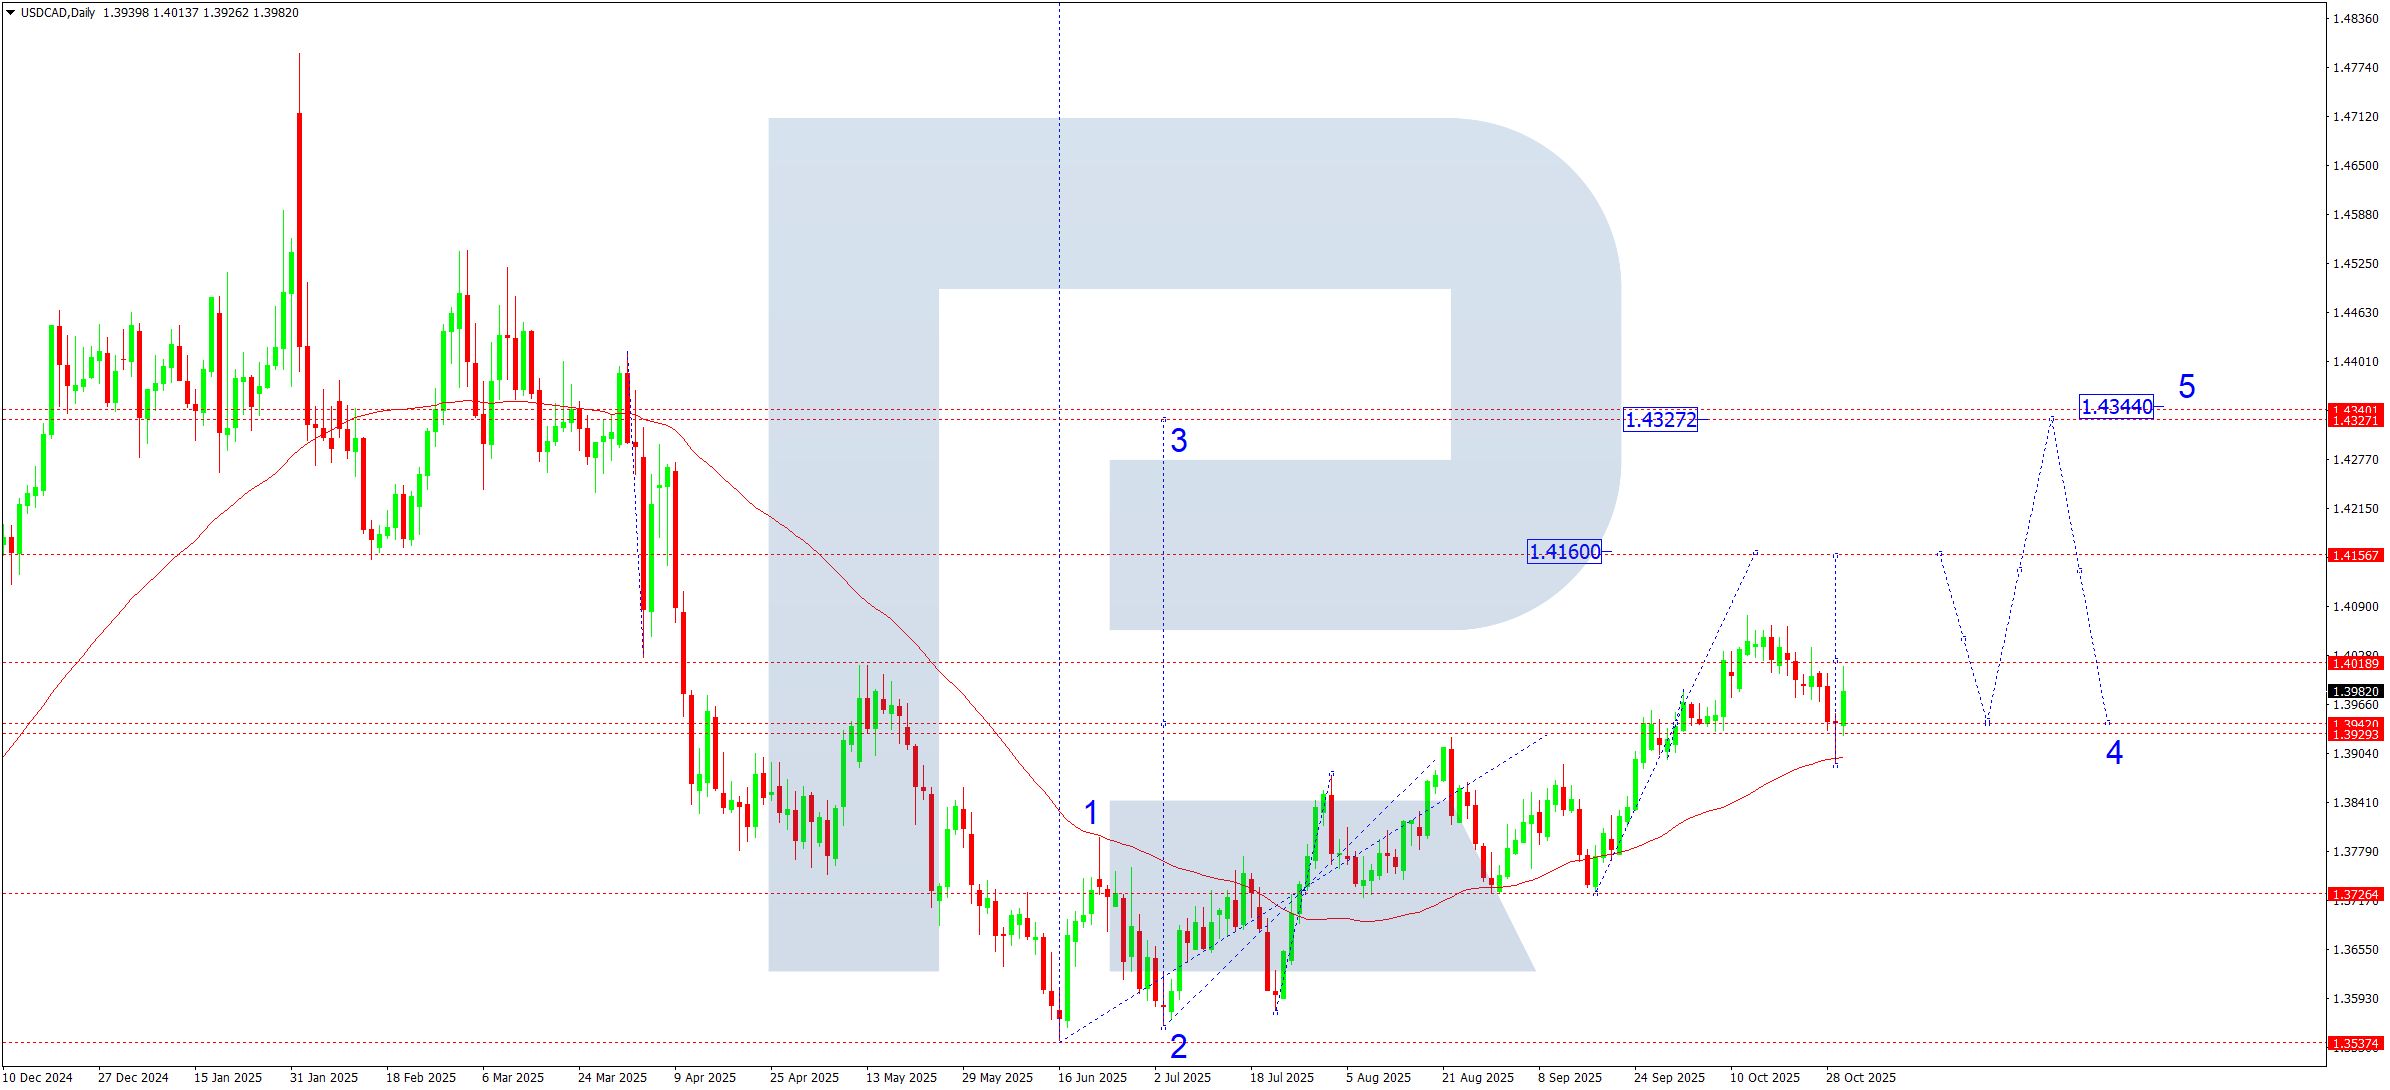
- USDCAD: Support: 1.3888, 1.3727. Resistance: 1.4020, 1.4160
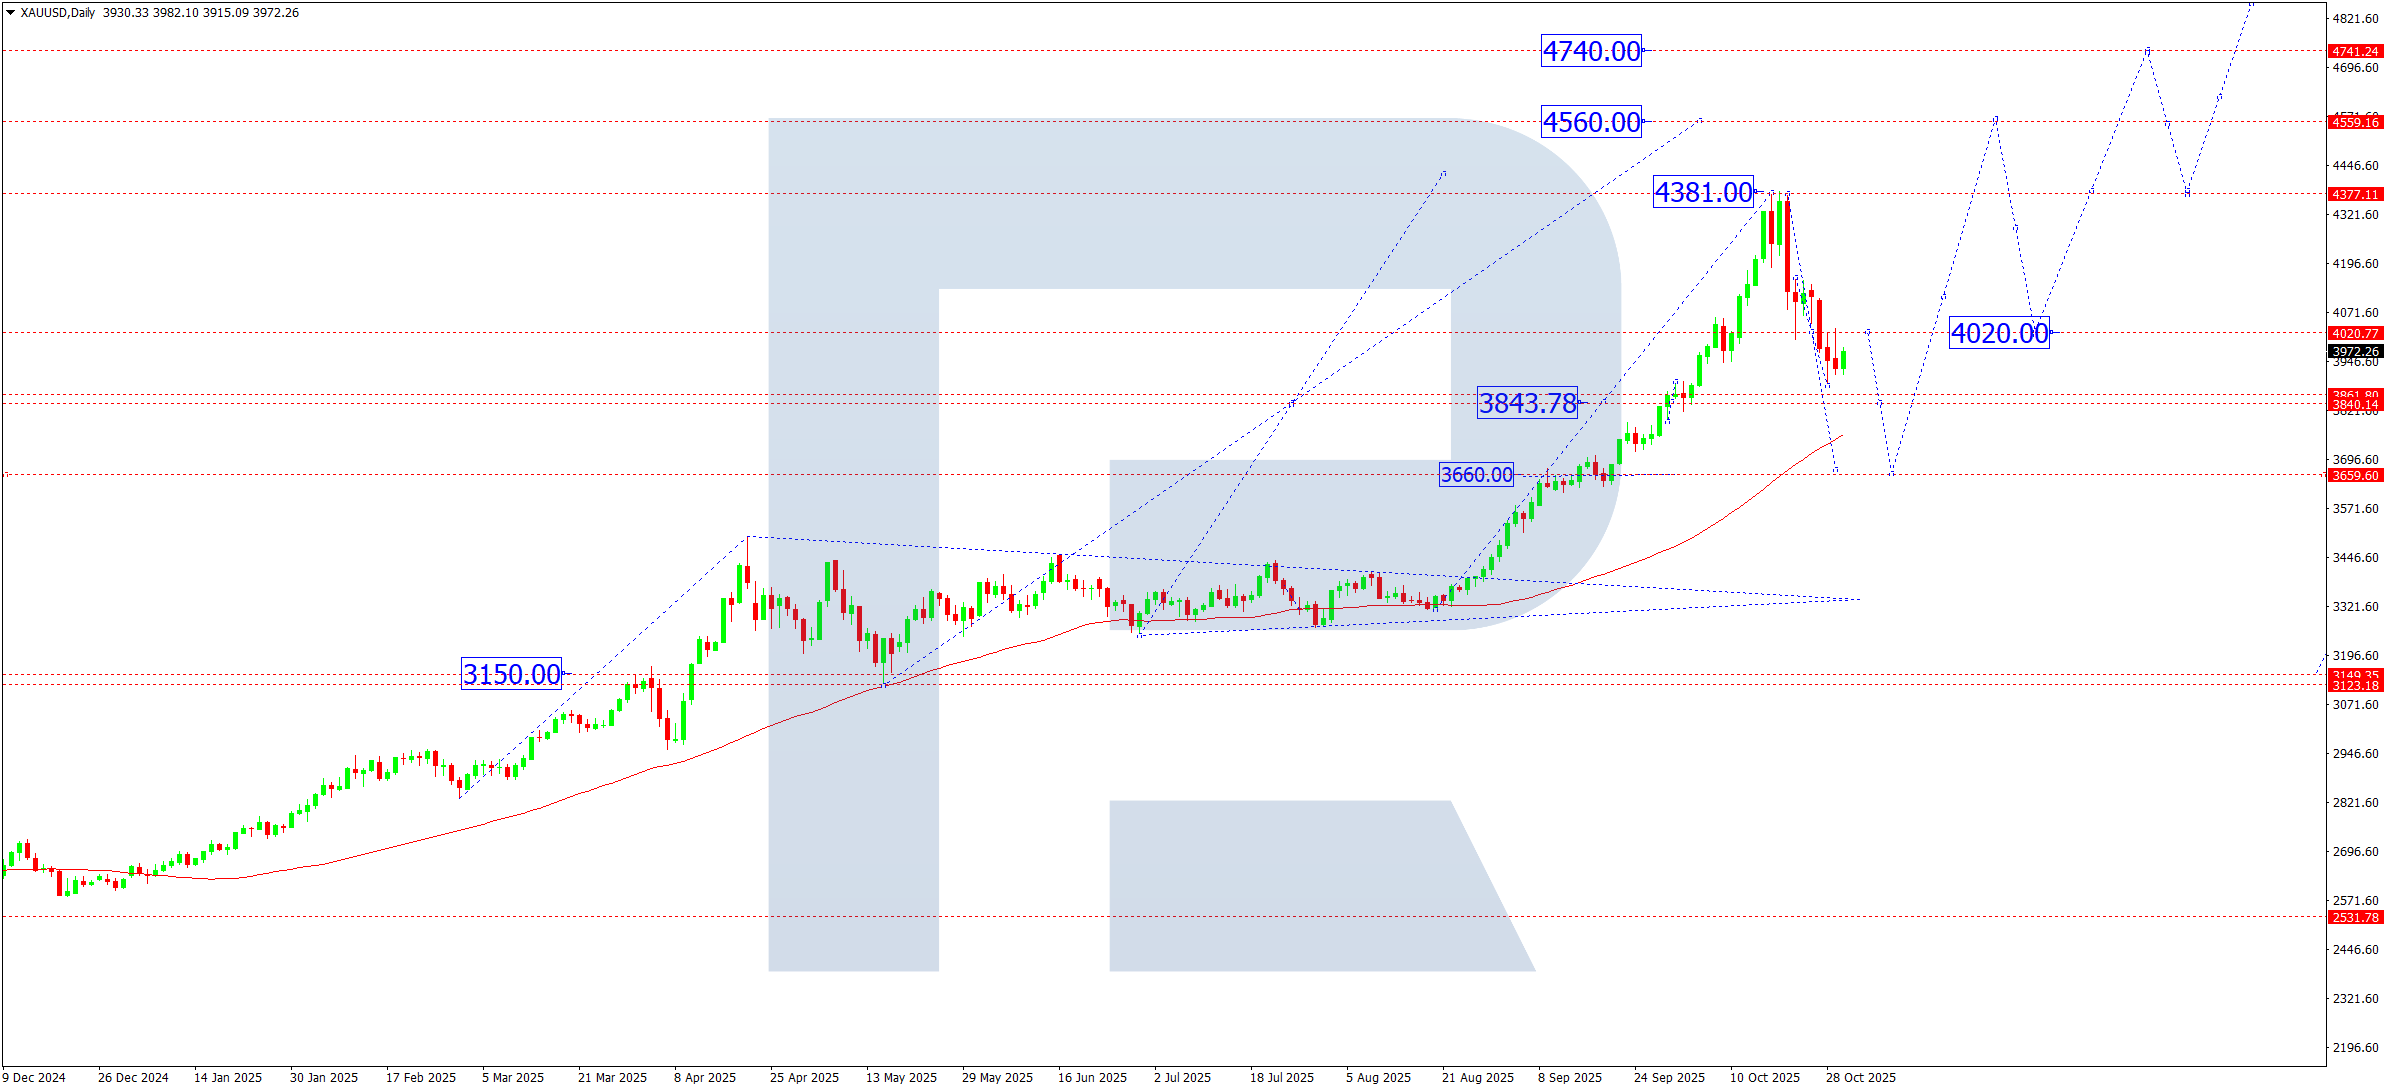
- Gold: Support: 3,970, 3,940. Resistance: 4,180, 4,380
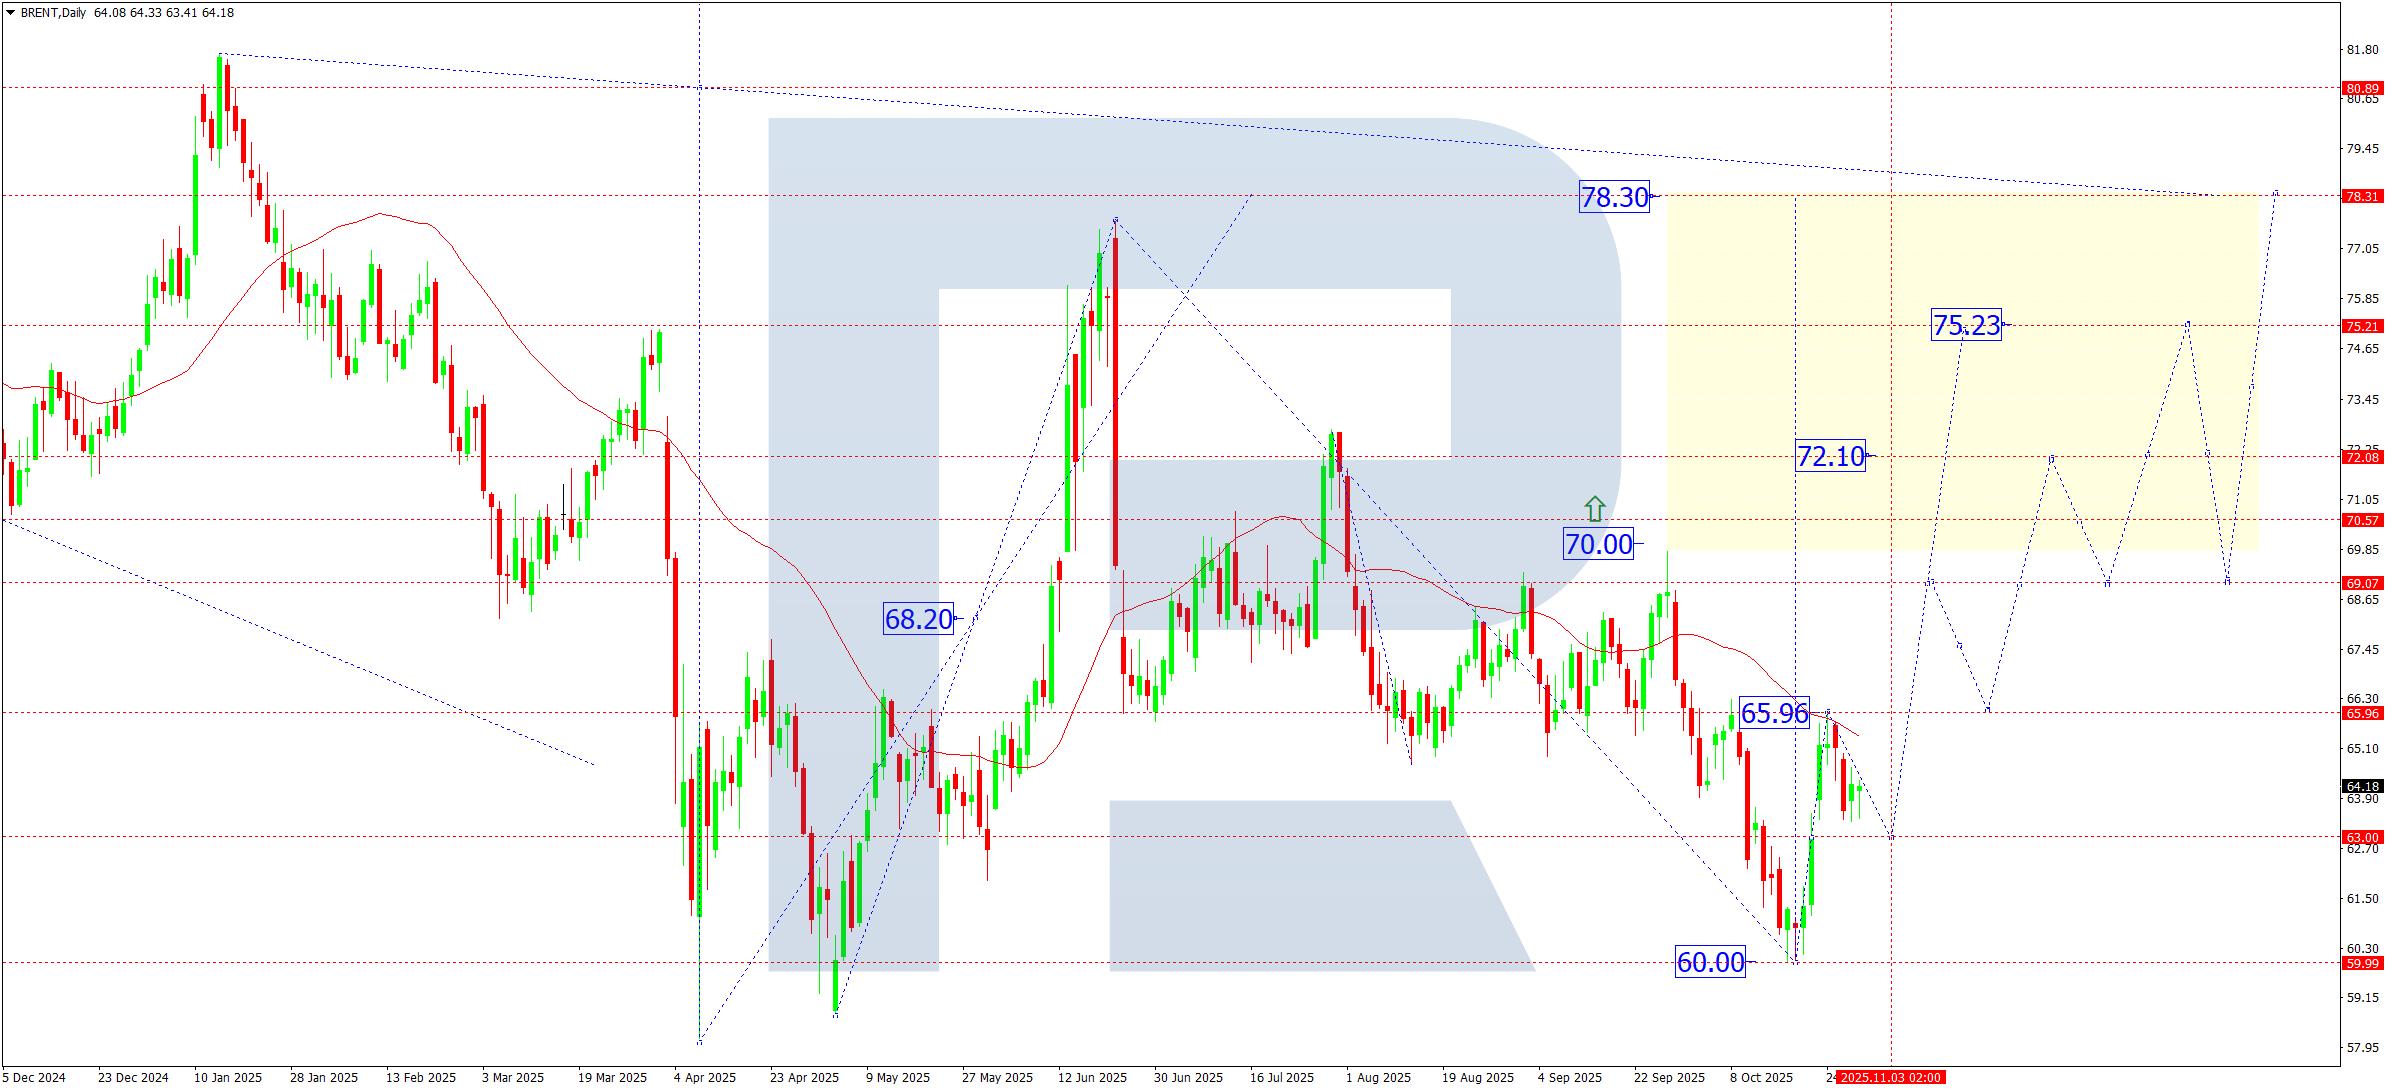
- Brent: Support: 63.00, 61,50. Resistance: 69.10, 75.20
EURUSD forecast
The euro remains under pressure due to weak macroeconomic data in the eurozone, primarily industrial production and Germany’s ifo Business Climate Index. Additional pressure comes from expectations of further ECB monetary easing against the backdrop of resilient US economic growth and the Fed’s continued hawkish rhetoric. Geopolitical risks and a slowdown in China also limit demand for the euro as a risk currency. As a result, the EURUSD pair continues its downward momentum towards key support levels.
EURUSD technical analysis
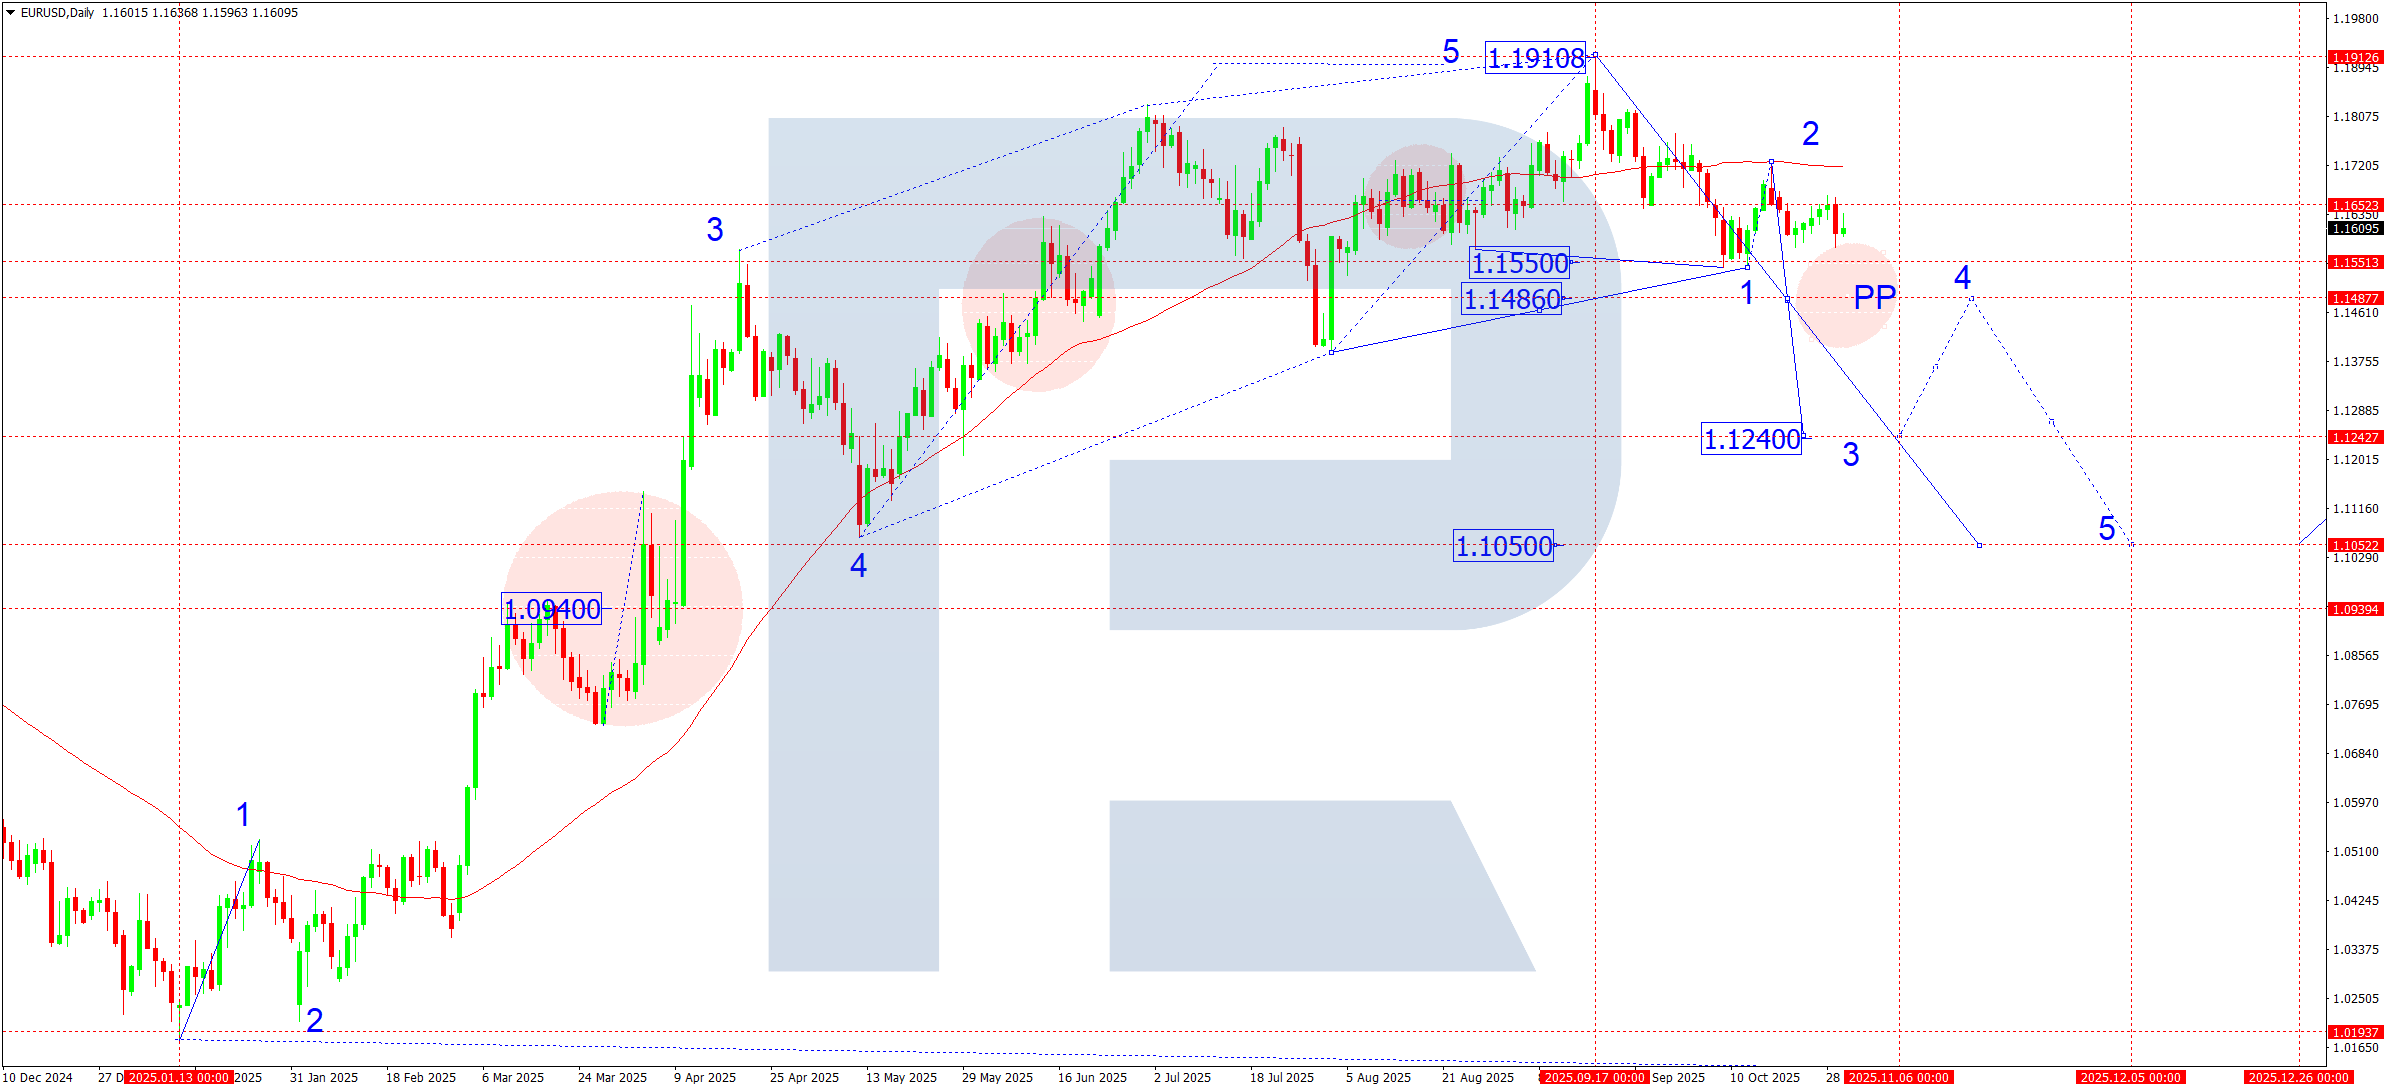
On the daily chart, the EURUSD pair is forming the structure of another third downward wave with a local target at 1.1515. After reaching it, a consolidation range is expected to form around this level, which may lead to the creation of a pivot point for the current downward impulse. The third-wave target is 1.1240 (minimum projection). Subsequently, a corrective structure upwards could follow, with the price testing the 1.1486 level from below. However, the overall direction remains within a medium-term downtrend.
EURUSD forecast scenarios
Bearish (baseline) scenario: formation of the third-wave decline structure with a local target of 1.1240.
Bullish (alternative) scenario: if the 1.1660 level breaks to the upside, there is potential for a rise to 1.1740, which would signal a possible end to the current corrective phase.
USDJPY forecast
The USDJPY pair remains supported by the contrast between the Fed and the Bank of Japan’s policies. With resilient US labour market data and persistent inflation pressures, the Fed’s tone remains cautiously hawkish, supporting the dollar. In Japan, by contrast, the BoJ maintains a dovish stance, although rising government bond yields and pressure on the yen are fuelling speculation about possible policy adjustments in the coming months. An additional factor is the rise in 10-year UST yields, which increases demand for the dollar against the yen. Geopolitical risks in Asia and ongoing stock-market volatility may cause temporary corrections, but do not change the overall uptrend.
USDJPY technical analysis
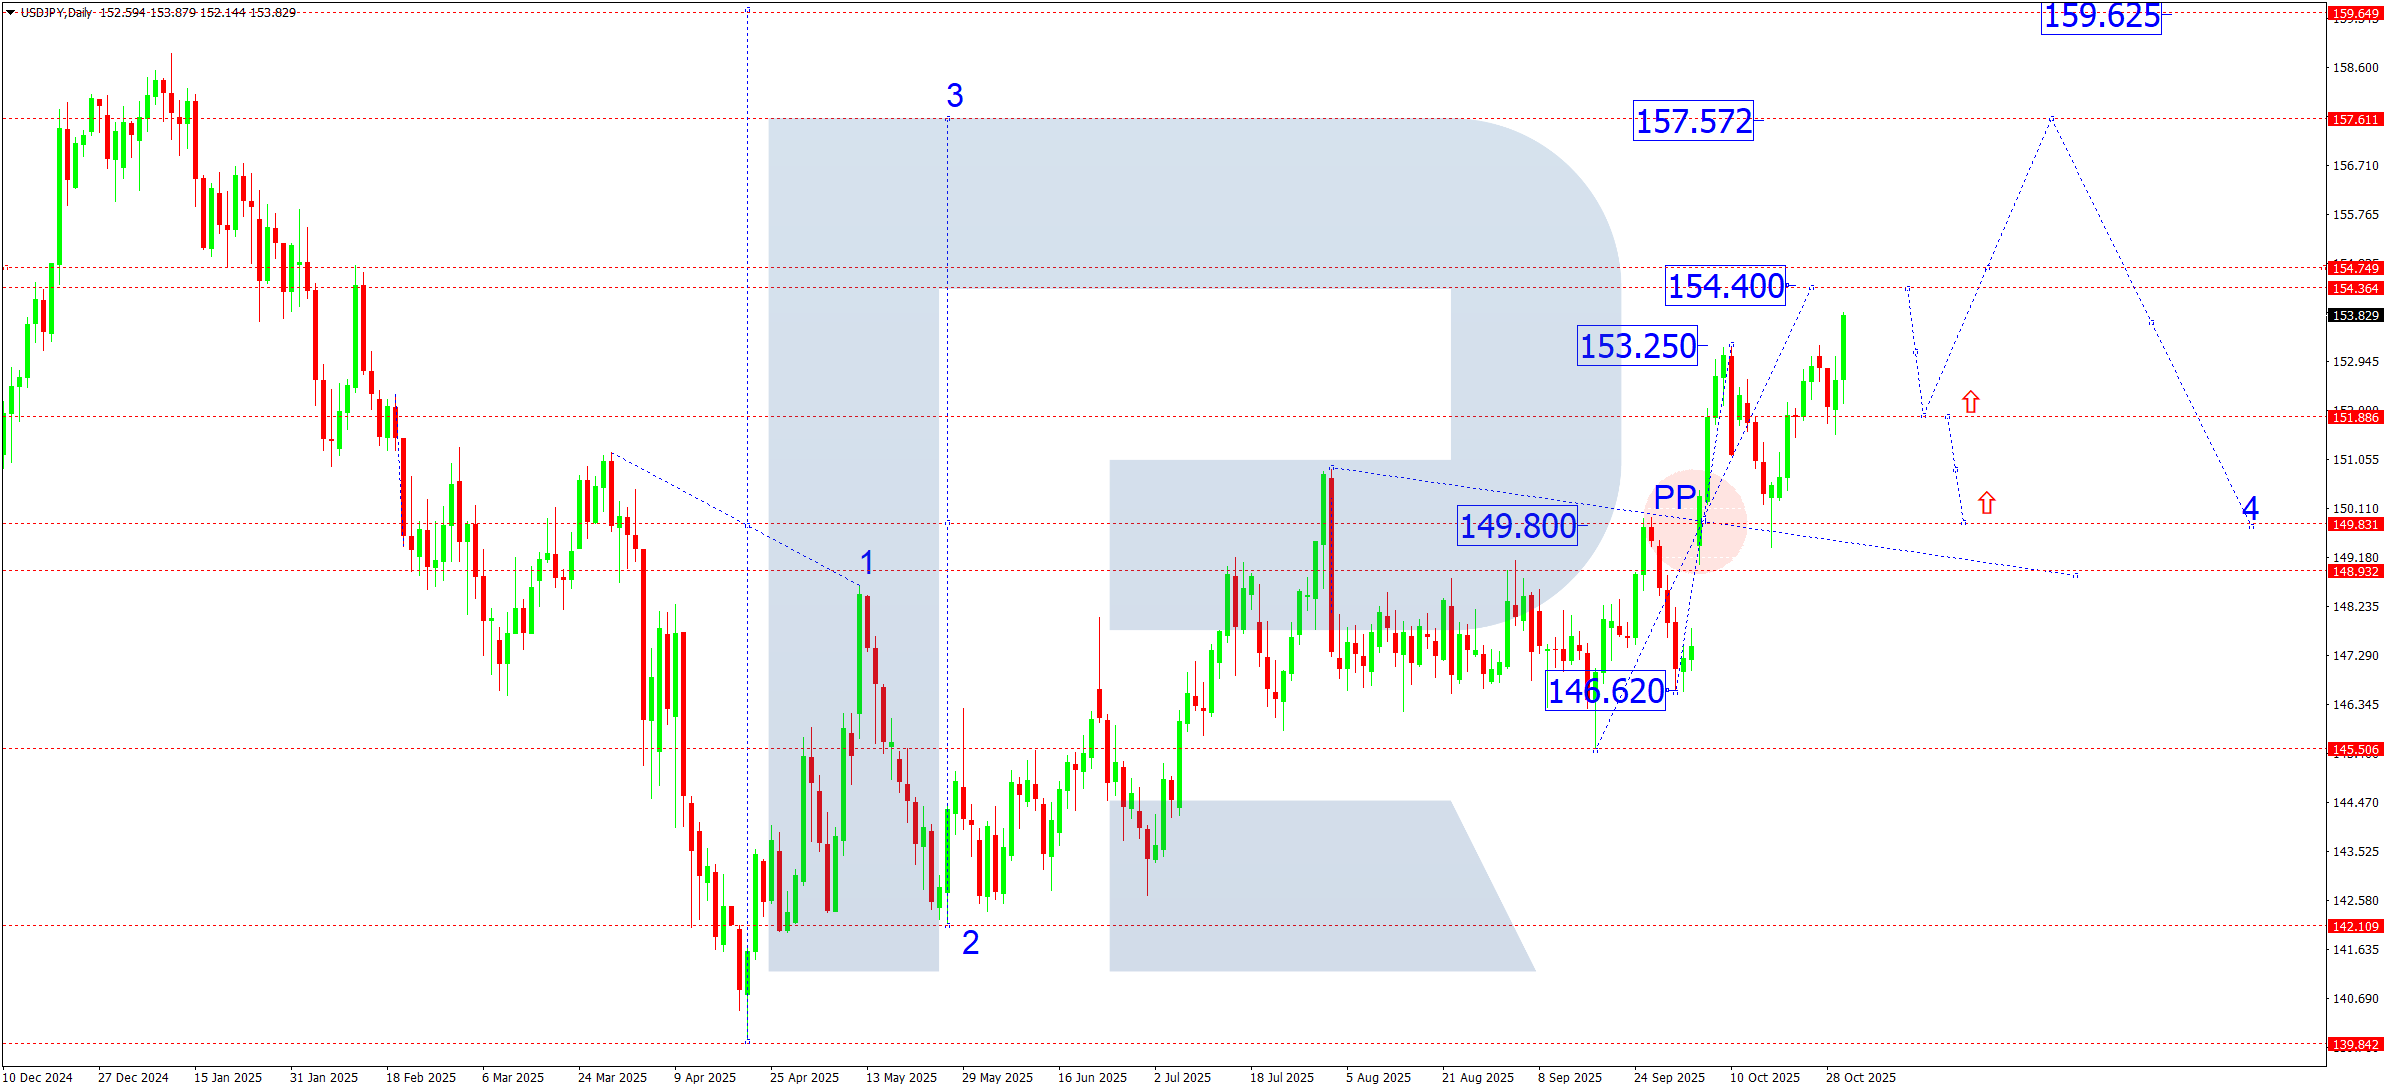
On the daily chart, the USDJPY pair confidently broke above the key 151.90 level and continues to develop the third growth structure within the third wave. The local target of the current impulse lies at 154.40. After reaching this mark, a corrective test of 151.90 from above is expected. The completion of the correction phase may lead to a resumption of growth and the formation of a new wave aiming for 157.57 as the local estimated target. Over a medium-term horizon, expansion towards 159.62 remains possible, where the upper boundary of the wave channel lies.
USDJPY forecast scenarios
Bullish (main) scenario: the breakout and consolidation above 151.82 opened the door for continued upward momentum.
- local target – 154.30 (local within the structure)
- main target – 157.57 (primary target of the third growth wave)
- long-term target – 159.62 (extension of the third wave)
Bearish (alternative) scenario: a decisive breakout below 151.50, confirmed by rising volumes, could lead to a corrective decline towards 149.80, a potential pivot point zone for the fourth wave.
GBPUSD forecast
The fundamental backdrop for the pound remains cautiously negative. Pressure persists due to weak Q3 inflation data and expectations of an earlier rate cut by the Bank of England. An additional factor is the moderate strengthening of the US dollar amid rising US bond yields and stabilising macroeconomic indicators in the US. The market still prices in a likelihood that the BoE will begin an easing cycle in Q1 2026, which limits the pound’s recovery potential.
GBPUSD technical analysis
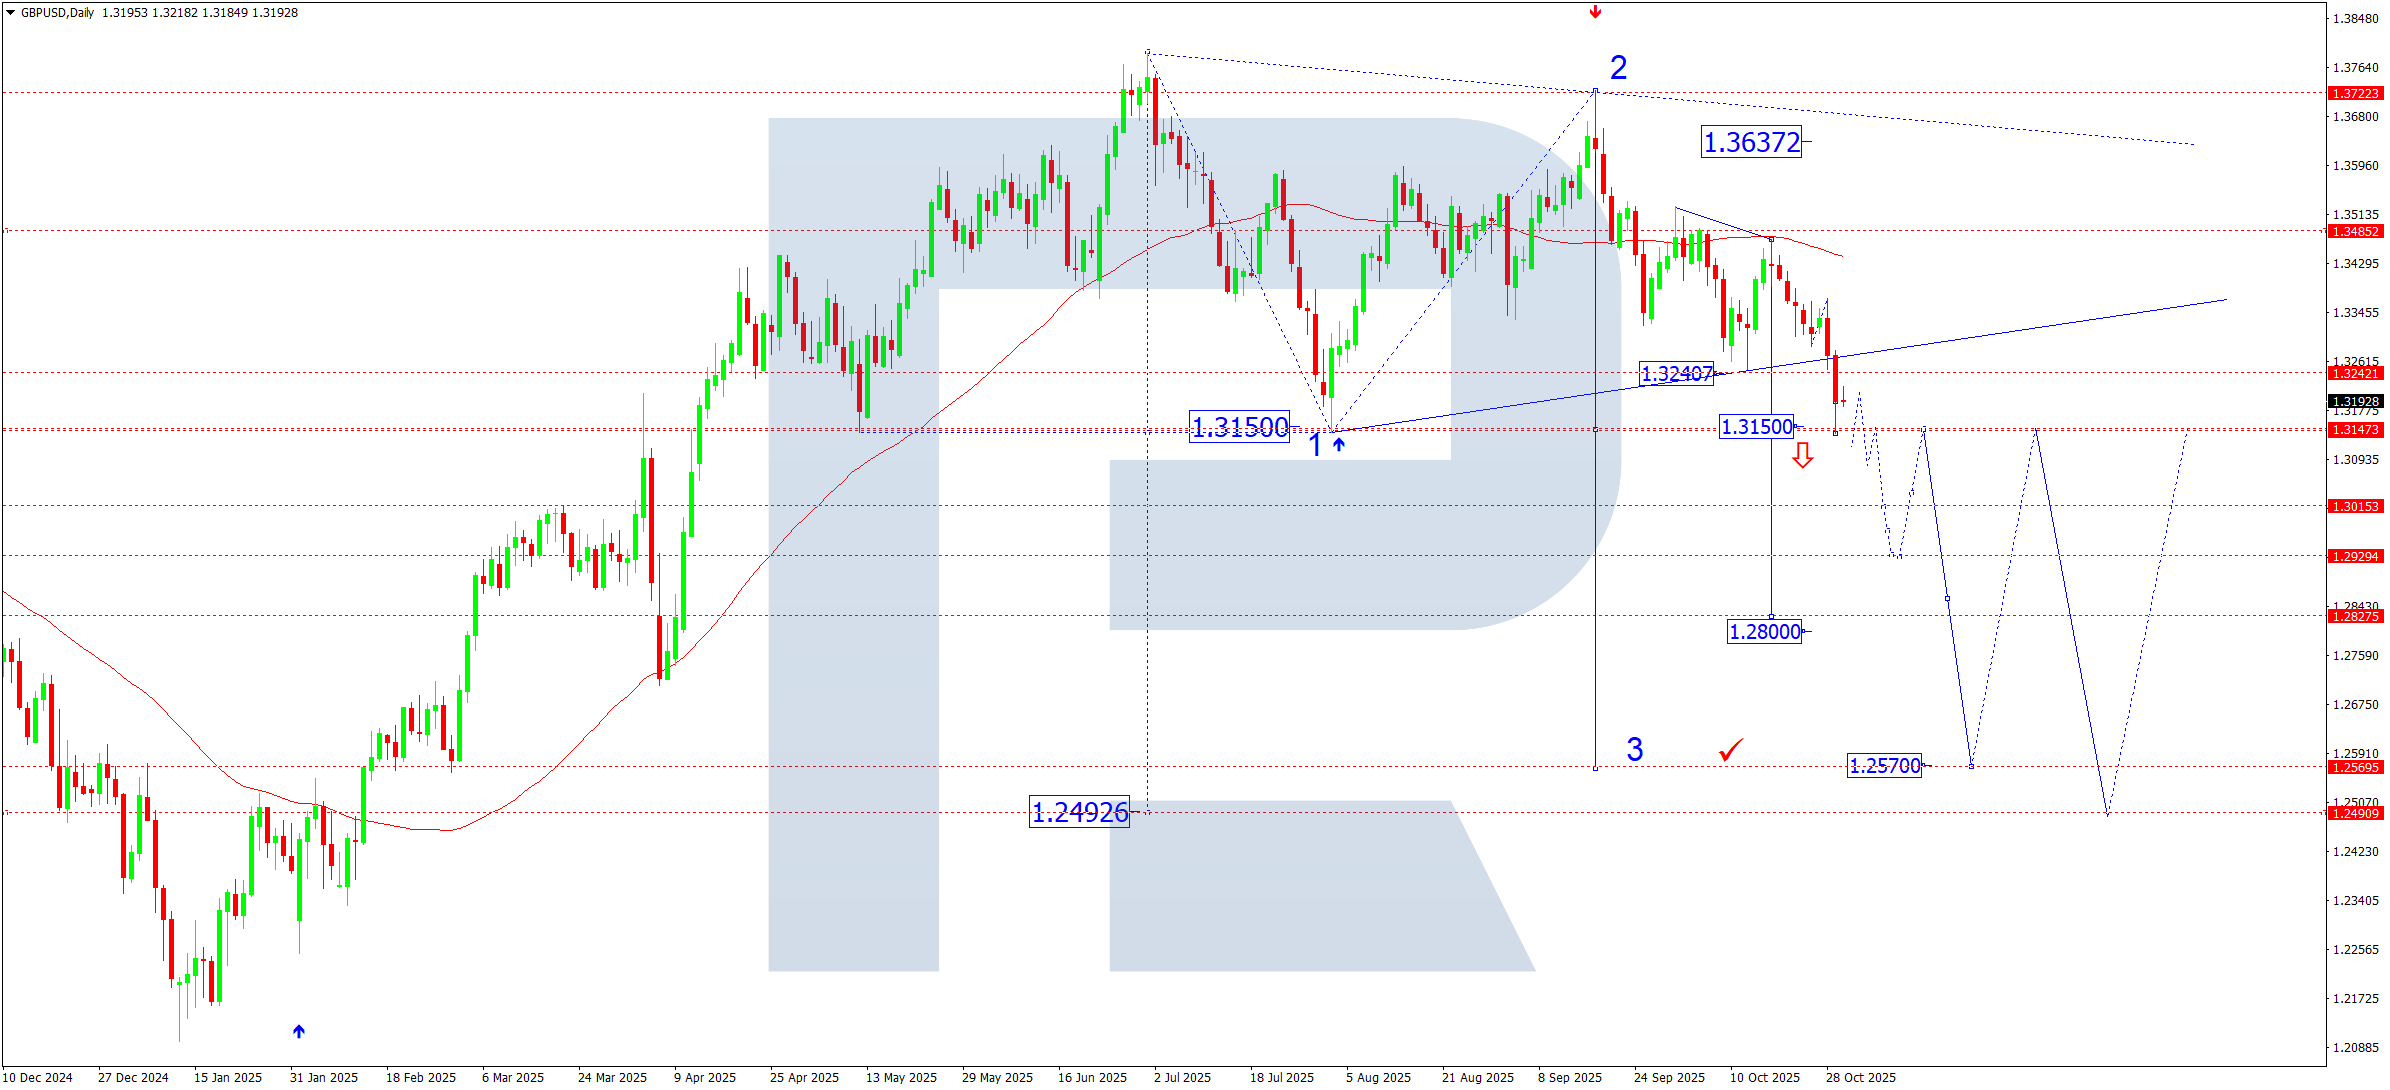
On the daily chart, the GBPUSD pair completed a move down to 1.3150. This week, a compact consolidation range is expected to form around this level, which could become a potential pivot point zone for the next downward impulse. If this scenario is confirmed, the market can unfold a bearish wave with a local target at 1.2800.
GBPUSD forecast scenarios
Bearish (main) scenario: development of the third downward wave targeting 1.2800 while pressure holds below 1.3250.
Bullish (alternative) scenario: consolidation above 1.3250 would open potential for a corrective rise to 1.3500, the upper boundary of the descending channel.
AUDUSD forecast
The Australian dollar remains under pressure from weak domestic demand data and slowing activity in the construction sector. Additional pressure comes from the Reserve Bank of Australia’s dovish rhetoric, as it keeps a pause in the tightening cycle despite signs of sticky inflation. The external backdrop is also unfavorable: falling iron-ore prices and weaker business activity in China intensify pressure on the AUD as a commodity currency. Meanwhile, a stronger US dollar, supported by expectations of a longer period of high Fed rates, is adding to the downward pressure on the pair.
AUDUSD technical analysis
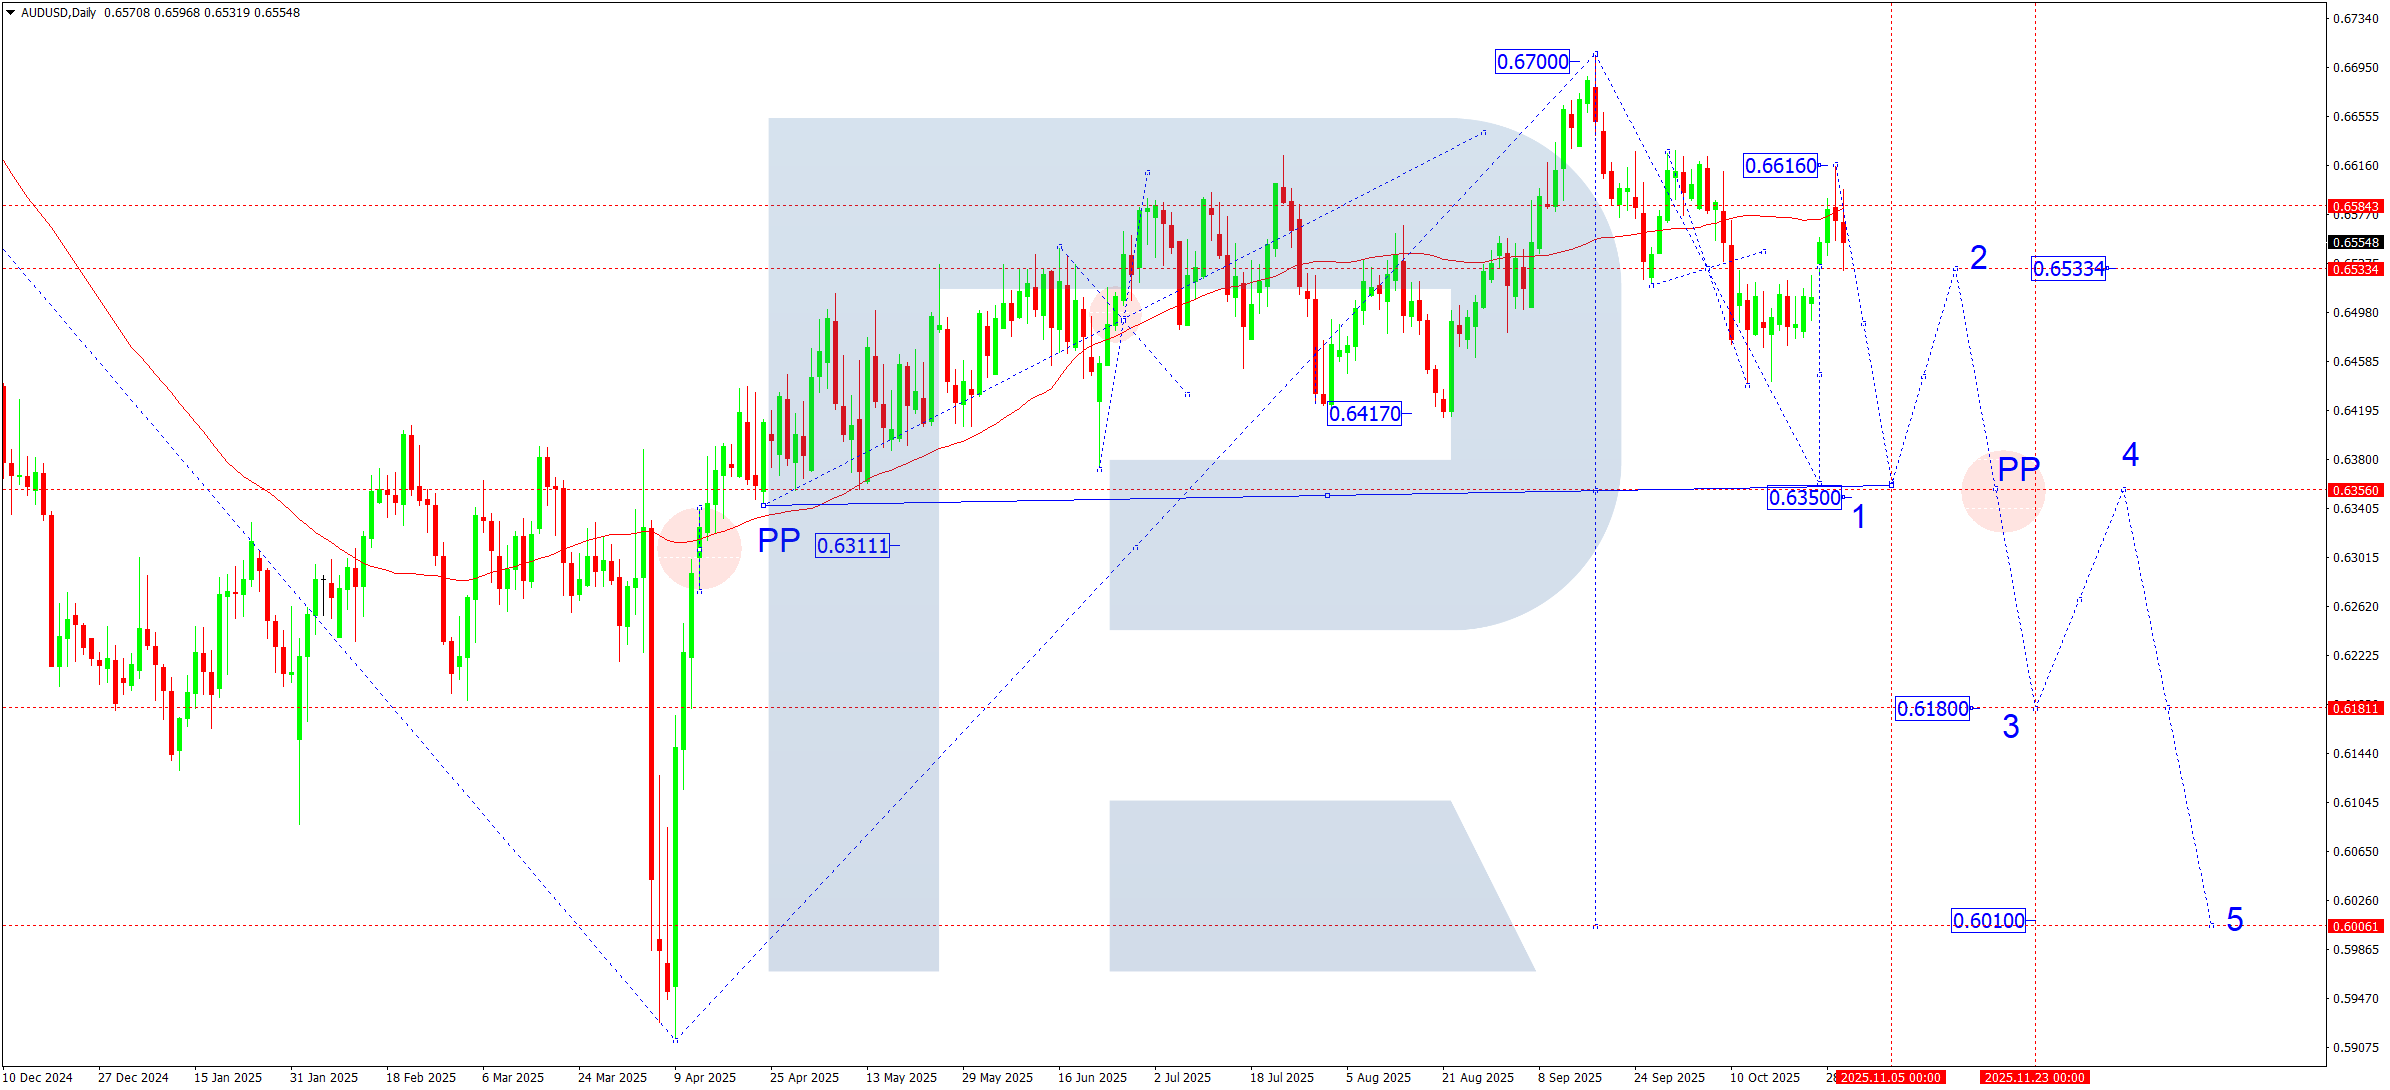
On the daily chart, the AUDUSD pair continues to develop the first downward wave. The market completed a corrective move to 0.6533, then broke it and stretched the correction to 0.6616, where faced pronounced resistance from the SMA50. The current pullback confirmed that the downtrend remains intact. In the near term, the move is expected to continue towards 0.6350 as the first target of the current bearish wave. After reaching the target, a new correction phase back to the 0.6533 area could follow.
AUDUSD forecast scenarios
Bearish (main) scenario: continued decline to 0.6350 as the primary target.
Bullish (alternative) scenario: a firm consolidation above 0.6620 would open potential for a rise to 0.6700.
USDCAD forecast
The Canadian dollar remains dependent on the dynamics of oil prices and the market’s overall risk appetite. Pressure on the CAD is reinforced by expectations of a Bank of Canada key-rate cut in Q1 2026, while the US dollar remains supported by strong macroeconomic data and rising Treasury yields. Against this backdrop, the USDCAD pair continues to move within an uptrend, getting an extra boost from weaker Brent prices.
USDCAD technical analysis
On the daily chart, the USDCAD pair completed a corrective move to 1.3888, where it found support from the SMA50, and began to form a new growth impulse. Thus, the market confirmed a pivot point at 1.3940 for the entire current wave.
In the coming week, growth is expected to continue towards a near-term target at 1.4160. After reaching this mark, a correction to 1.3940 – a retest of the pivot point from above – is possible. Once the correction ends, the base case envisages a new stage of the third upward wave with a local estimated target at 1.4327.
USDCAD forecast scenarios
Bullish (main) scenario: a breakout above 1.4020 would open potential for further upside to 1.4160 and higher.
Bearish (alternative) scenario: in the event of a sharp drop and a breakout below 1.3880, the market could deepen the correction towards 1.3727.
XAUUSD forecast
The gold market remains under pressure from rising yields and a stronger dollar driven by expectations that the Fed will keep policy tight. However, escalating geopolitical risks and ongoing demand from developing-country central banks provide medium-term support for the precious metal. In the week ahead, the key driver will be the market’s reaction to a block of US macroeconomic data, including the ISM index, employment figures, and Fed speakers’ comments. Their rhetoric regarding the timing of the first rate cut will determine the direction of the medium-term momentum.
XAUUSD technical analysis
On the daily chart, XAUUSD is forming a consolidation range around 4,020, seen as a potential pivot point for the current wave structure. In the short term, the second half of a corrective decline towards 3,660 remains possible. There, the SMA50 and a prior wave base should provide support. After this correction ends, a new growth wave is expected with an initial target of a return to 4,020, and – once that level is broken – continuation of the trend towards 4,560, which is the local estimated target of the bullish momentum.
XAUUSD forecast scenarios
Bearish (main) scenario: the breakout and consolidation below 4,020 opened potential for a decline to 3,660 (corrective structure).
Bullish (alternative) scenario: a firm consolidation above 4,020 would resume growth with targets at 4,380, 4,560, and 4,740.
Brent forecast
The oil market remains highly volatile amid geopolitical tensions in Europe, the Middle East, and around Venezuela. Additional pressure on supply comes from expanded sanctions against Russian energy companies, which limit access to global markets and create risks of supply shortages during the winter period. At the same time, market participants are watching US oil inventory releases, where the trend of drawing down strategic reserves continues. All this provides fundamental support for a potential resumption of the upward price trend after the current correction ends.
Brent technical analysis
On the daily chart, Brent crude rebounded from the SMA50 near 65.96 and continues a corrective phase towards 63.00. After it completes, the upward momentum is expected to resume withthe first target at 69.10. A breakout above this level would open the door for further movement towards 72.10, where the third upward wave may complete. Looking ahead, the market can develop the fifth wave up to 78.30, after which a correction phase to at least 73.50 is likely.
Brent forecast scenarios
Bullish (main) scenario: given the combination of geopolitical factors and ongoing supply constraints, the base case suggests continued upward momentum:
- first target – 69.10
- second target – 72.10
- local target of the fifth leg – 75.20
- main target of the first upward wave – 78.30
Bearish (alternative, unlikely) scenario: if the 63.00 level breaks to the downside, a deeper correction to 61.50 is possible, after which the upward momentum is expected to resume.
Forecasts presented in this section only reflect the author’s private opinion and should not be considered as guidance for trading. RoboForex bears no responsibility for trading results based on trading recommendations described in these analytical reviews.