Weekly technical analysis and forecast (24–28 November 2025)
This weekly technical analysis highlights the key chart patterns and levels for EURUSD, USDJPY, GBPUSD, AUDUSD, USDCAD, gold (XAUUSD), and Brent crude oil to forecast market moves for the upcoming week (24–28 November 2025)
Major technical levels to watch this week
- EURUSD: Support: 1.1500, 1.1440. Resistance: 1.1570, 1.1650
- USDJPY: Support: 155.00, 153.80. Resistance: 158.00, 159.88
- GBPUSD: Support: 1.3000, 1.2828. Resistance: 1.3150, 1.3220
- AUDUSD: Support: 0.6435, 0.6333. Resistance: 0.6480, 0.6530
- USDCAD: Support: 1.4065, 1.3970. Resistance: 1.4160, 1.4240
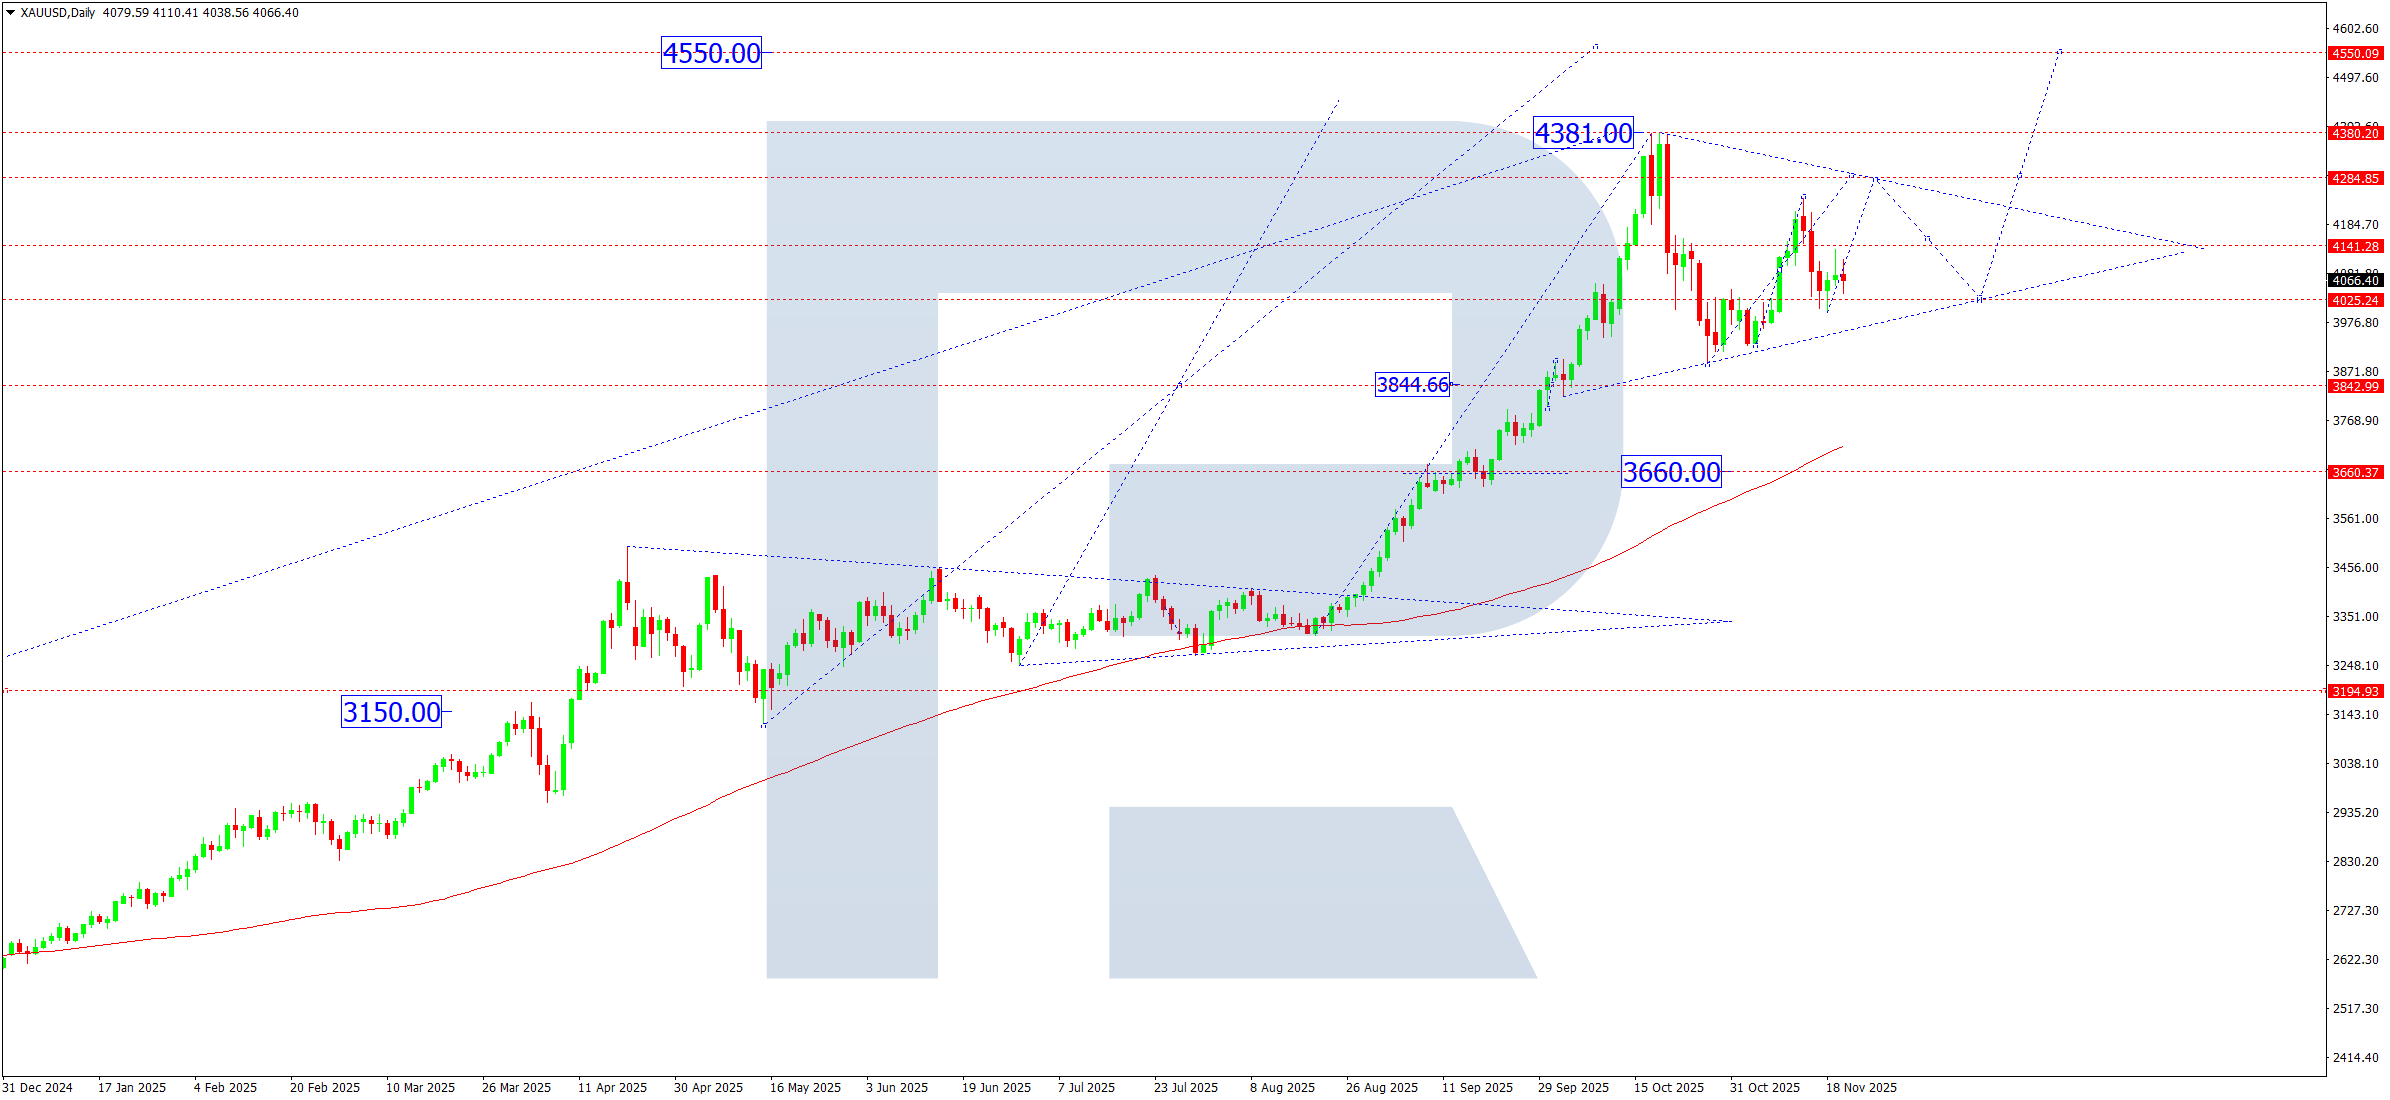
- Gold: Support: 4000, 3930. Resistance: 4130, 4285
- Brent: Support: 61.75, 60,00. Resistance: 64.64, 66.00
EURUSD forecast
This week, the dominant factors for the euro remain the eurozone’s economic slowdown and weak inflation profile. The market still assesses a high risk that the ECB will start its rate-cutting cycle earlier than the Fed. In the US, demand for the dollar remains elevated amid resilient macroeconomic data and the temporary extension of government funding (the shutdown has been postponed only until the end of January), which supports the USD’s status as a safe-haven asset. The fundamental backdrop remains moderately negative for the EURUSD pair.
EURUSD technical analysis
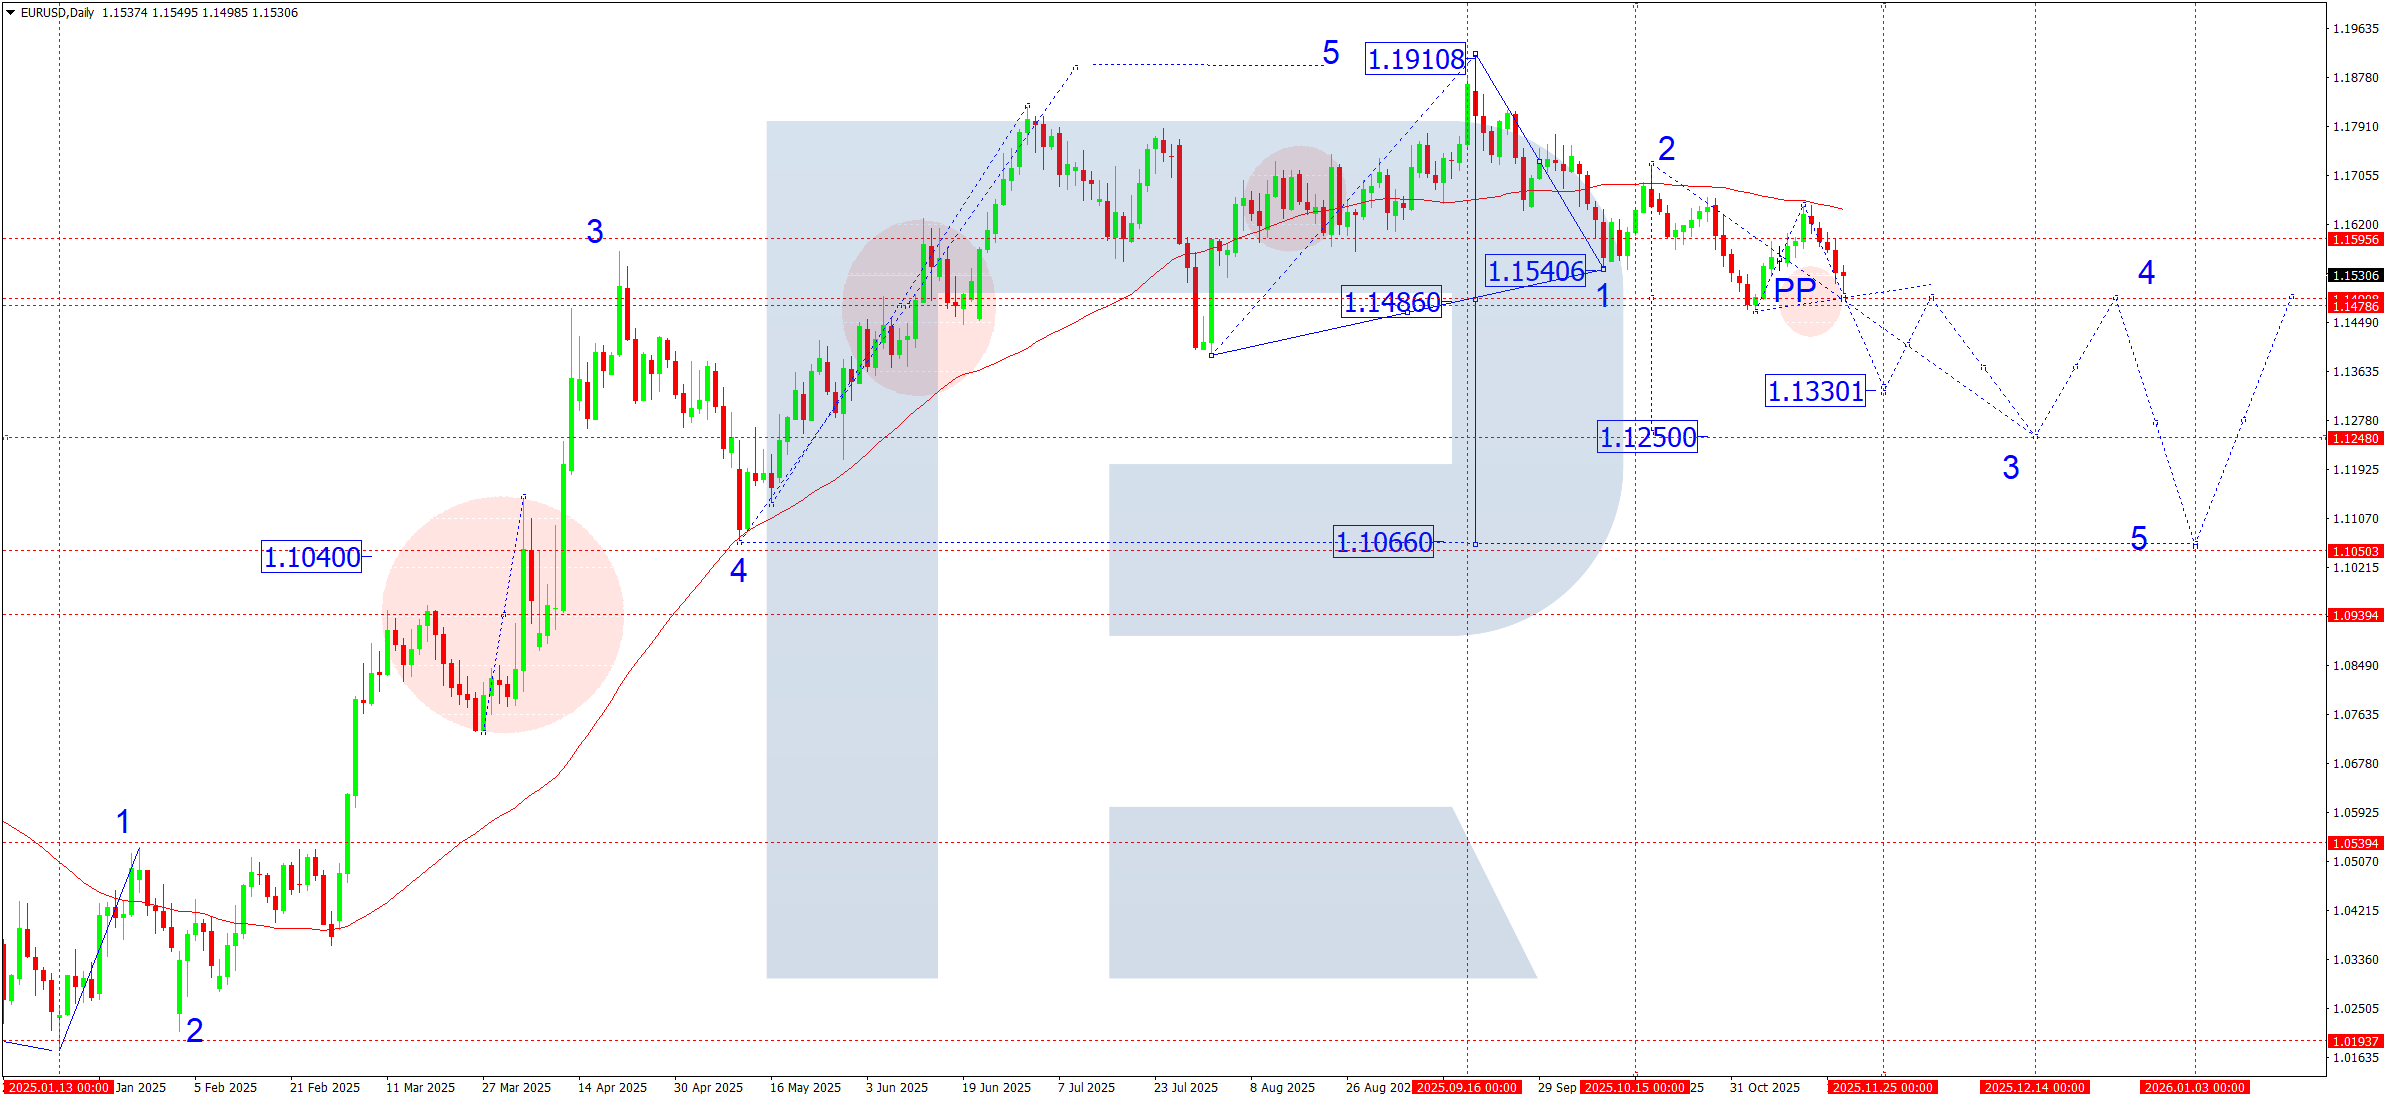
On the daily chart, the EURUSD pair has completed a corrective structure towards 1.1655 and is now forming the third downward wave. Currently, the first downward move is over, with the price edging lower to 1.1499, which currently acts as a potential pivot point. In the coming week, a local consolidation range is expected to form above 1.1499. If the range breaks upwards, the structure may extend into a corrective leg to 1.1570 (testing from below). If the range breaks downwards, this will open the potential for further decline within the third wave, with targets at:
- 1.1444 (local target)
- 1.1333 (next structural level)
- 1.1250 (estimated wave target)
Since the 1.1499 level may act as a structural pivot point (PP), the overall target of the current downward wave is projected at 1.1066. This level coincides with the estimated third wave according to the PP structure.
EURUSD forecast scenarios
Bearish (base) scenario: after a possible correction towards 1.1570, the market may form a continuation of the third downward wave.
Downside targets:
- 1.1444
- 1.1333
- 1.1250
With sufficient momentum, a move towards 1.1066 is possible as the estimated wave target from the PP.
Bullish (alternative, unlikely) scenario: if the market breaks above the 1.1570 level while volumes rise, the possibility of further corrective growth is possible, with targets at:
- 1.1650
- (with strong momentum) 1.1730
However, the probability of this scenario is low, as the market structure remains bearish.
USDJPY forecast
The USDJPY pair remains driven by the divergence between the Federal Reserve and the Bank of Japan policy. The Fed maintains a hawkish stance and keeps rates elevated, supporting US bond yields and strengthening the dollar. The Bank of Japan, by contrast, is extremely cautious and shows no readiness for significant tightening, which limits the yen’s appreciation potential. The wide yield differential between the US and Japan remains the main driver of the pair’s rally. Geopolitical risks temporarily increase demand for safe-haven assets, but do not create sustained interest in the yen. The fundamental backdrop supports the sustained bullish structure, aiming for moves towards 158.00–159.88 and beyond.
USDJPY technical analysis
On the daily chart, the USDJPY pair formed a consolidation range around 153.80. With an upside breakout, the price continued to develop a bullish wave towards the 158.00 target level. In the coming week, this target is expected to be reached.
After achieving the 158.00 target, the pair could start a corrective move towards 155.77 (testing from above). From this level, the pair is projected to resume its upward trajectory towards 159.88, potentially extending the structure to the estimated target of 162.22.
USDJPY forecast scenarios
Bullish (main) scenario: a confident break above 155.00 opened potential to continue the bullish wave to 158.00 and 159.88, with further scope to extend toward 162.22.
Bearish (alternative) scenario: a sharp decline and a break below 155.00, confirmed by higher volumes, could initiate a deeper correction toward 149.90.

GBPUSD forecast
The pound remains under pressure due to weak UK macroeconomic data: declining business activity, a cooling labour market, and slowing inflation increase expectations that the Bank of England will begin easing in Q1 2026.
The dollar remains influenced by uncertainty around the US budget and the temporary extension of government funding through January, which keeps demand for the USD primarily as a safe-haven asset. Ahead of the key PCE inflation release and FOMC minutes, the market remains cautious and prone to trading within technical ranges.
GBPUSD technical analysis
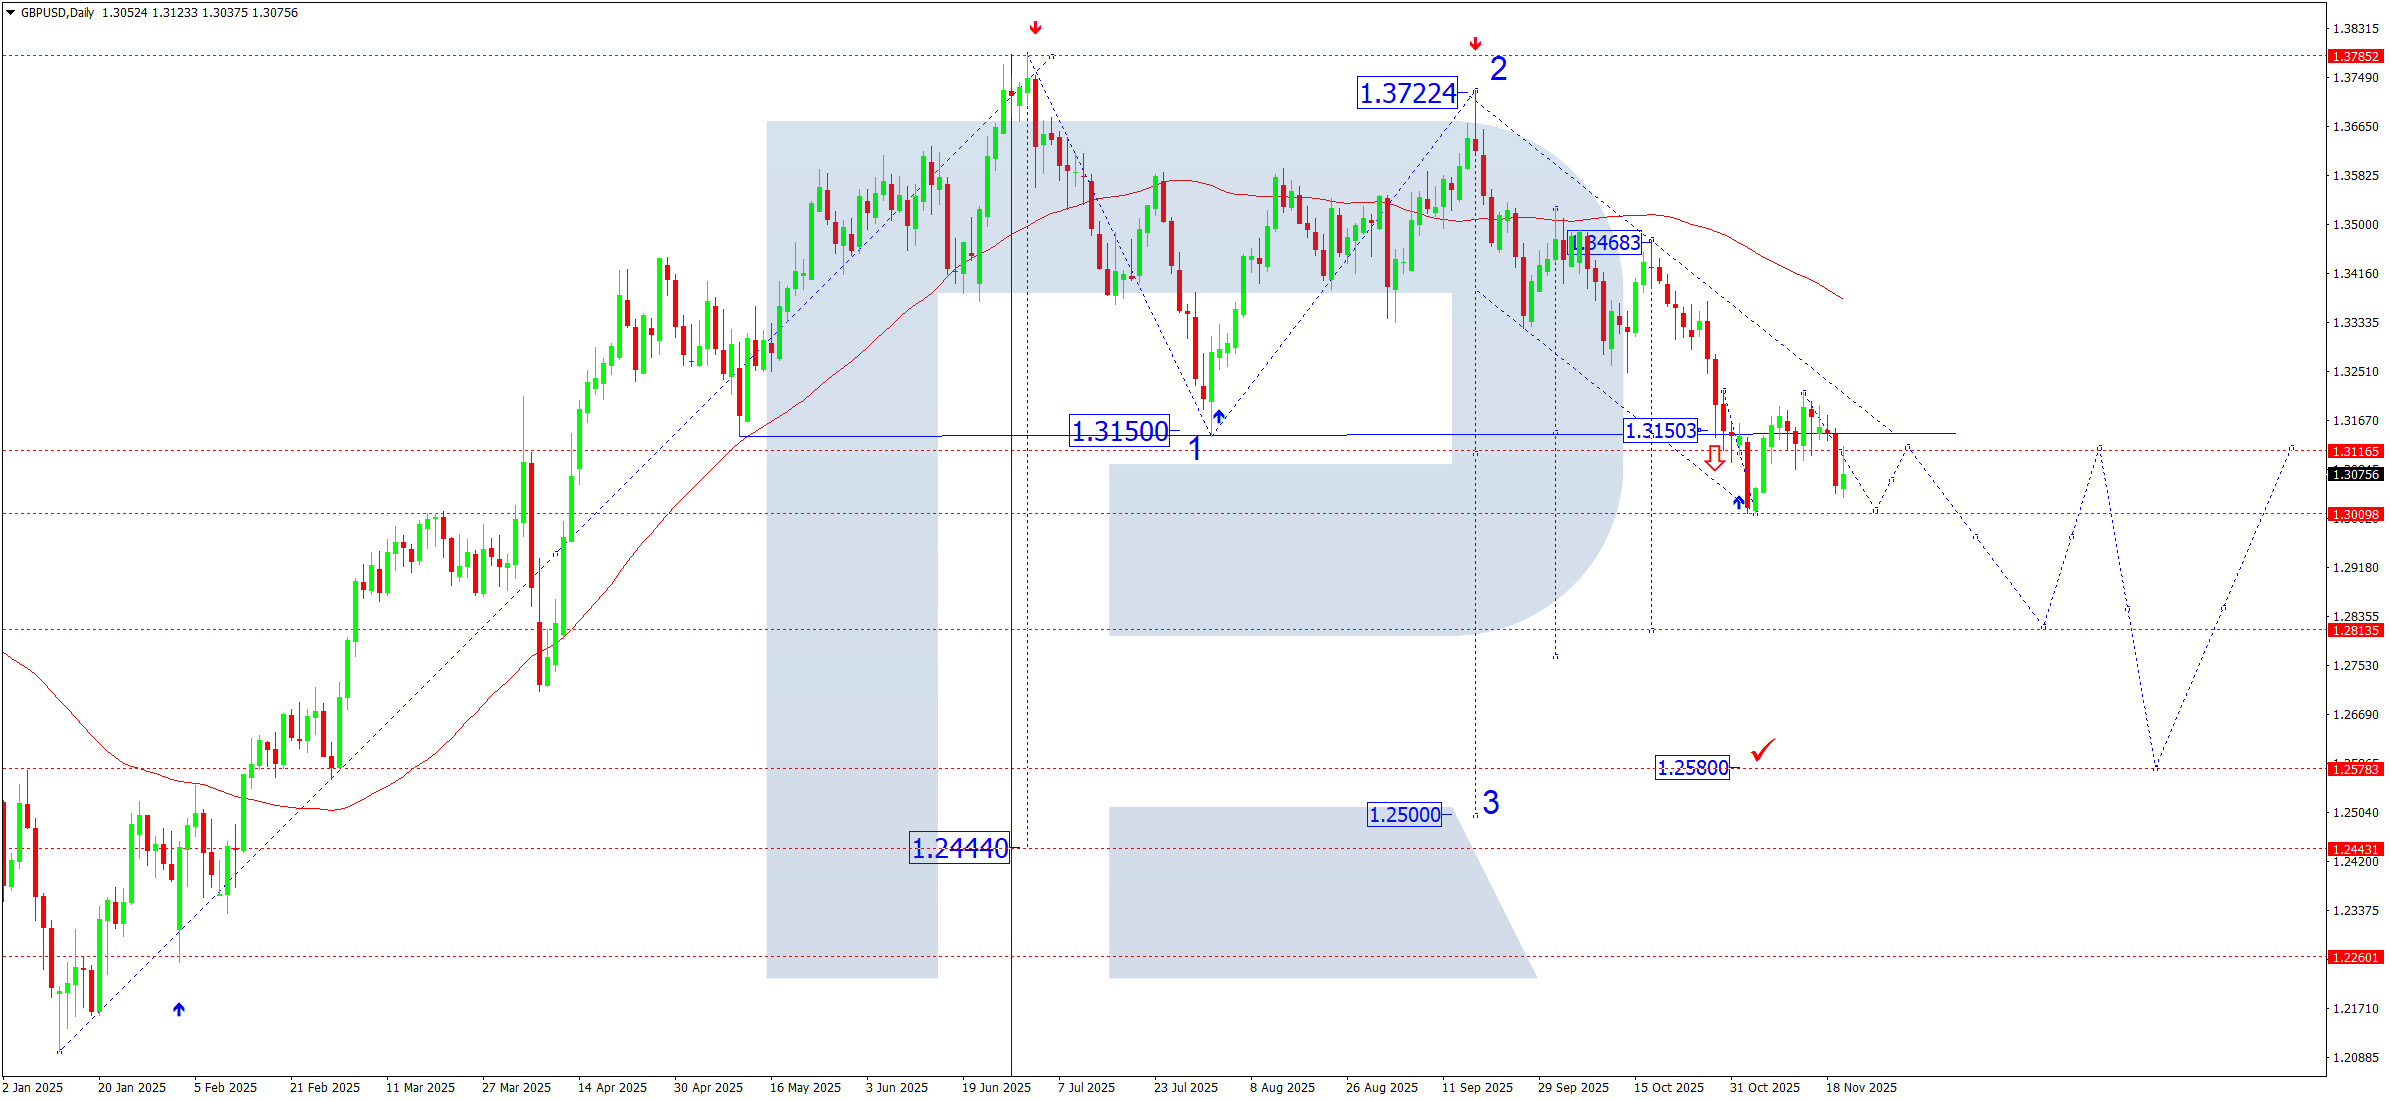
On the daily chart, the GBPUSD pair continues to form a medium-term descending channel. The market has consolidated within a local range around 1.3150, which currently acts as the key price magnet.
This week, the range is expected to expand downwards to test the 1.3000 level. Subsequently, the pair could pull back towards 1.3150, which will be viewed as a potential pivot point formation area. Reaching the PP at 1.3150 could trigger a new impulse wave down with a local target at 1.2828 and the potential for further trend extension towards 1.2580, the estimated target of the third wave.
GBPUSD forecast scenarios
Bearish (main) scenario: development of the third downward wave with targets at 1.2828 and 1.2580.
Bullish (alternative) scenario: a sustained consolidation above 1.3150 would open the potential for a corrective rise towards 1.3292 (upper boundary of the descending channel).
AUDUSD forecast
The Australian dollar continues to trade under pressure amid weakening global demand for commodities and a stronger US dollar. The minutes of the latest Fed meeting underscored a commitment to keeping rates elevated for longer than markets expected, boosting interest in the USD and limiting AUD’s upside potential.
Iron ore prices show moderate volatility: the lack of a sustained recovery in China’s economy does not provide sufficient support for commodity currencies. Additional influence comes from reduced expectations for future RBA tightening – the market is pricing in a pause with a focus on maintaining current policy.
This week, attention shifts to US inflation and labour data, which may set the direction for the USD, as well as to releases of business activity indicators in Australia.
AUDUSD technical analysis
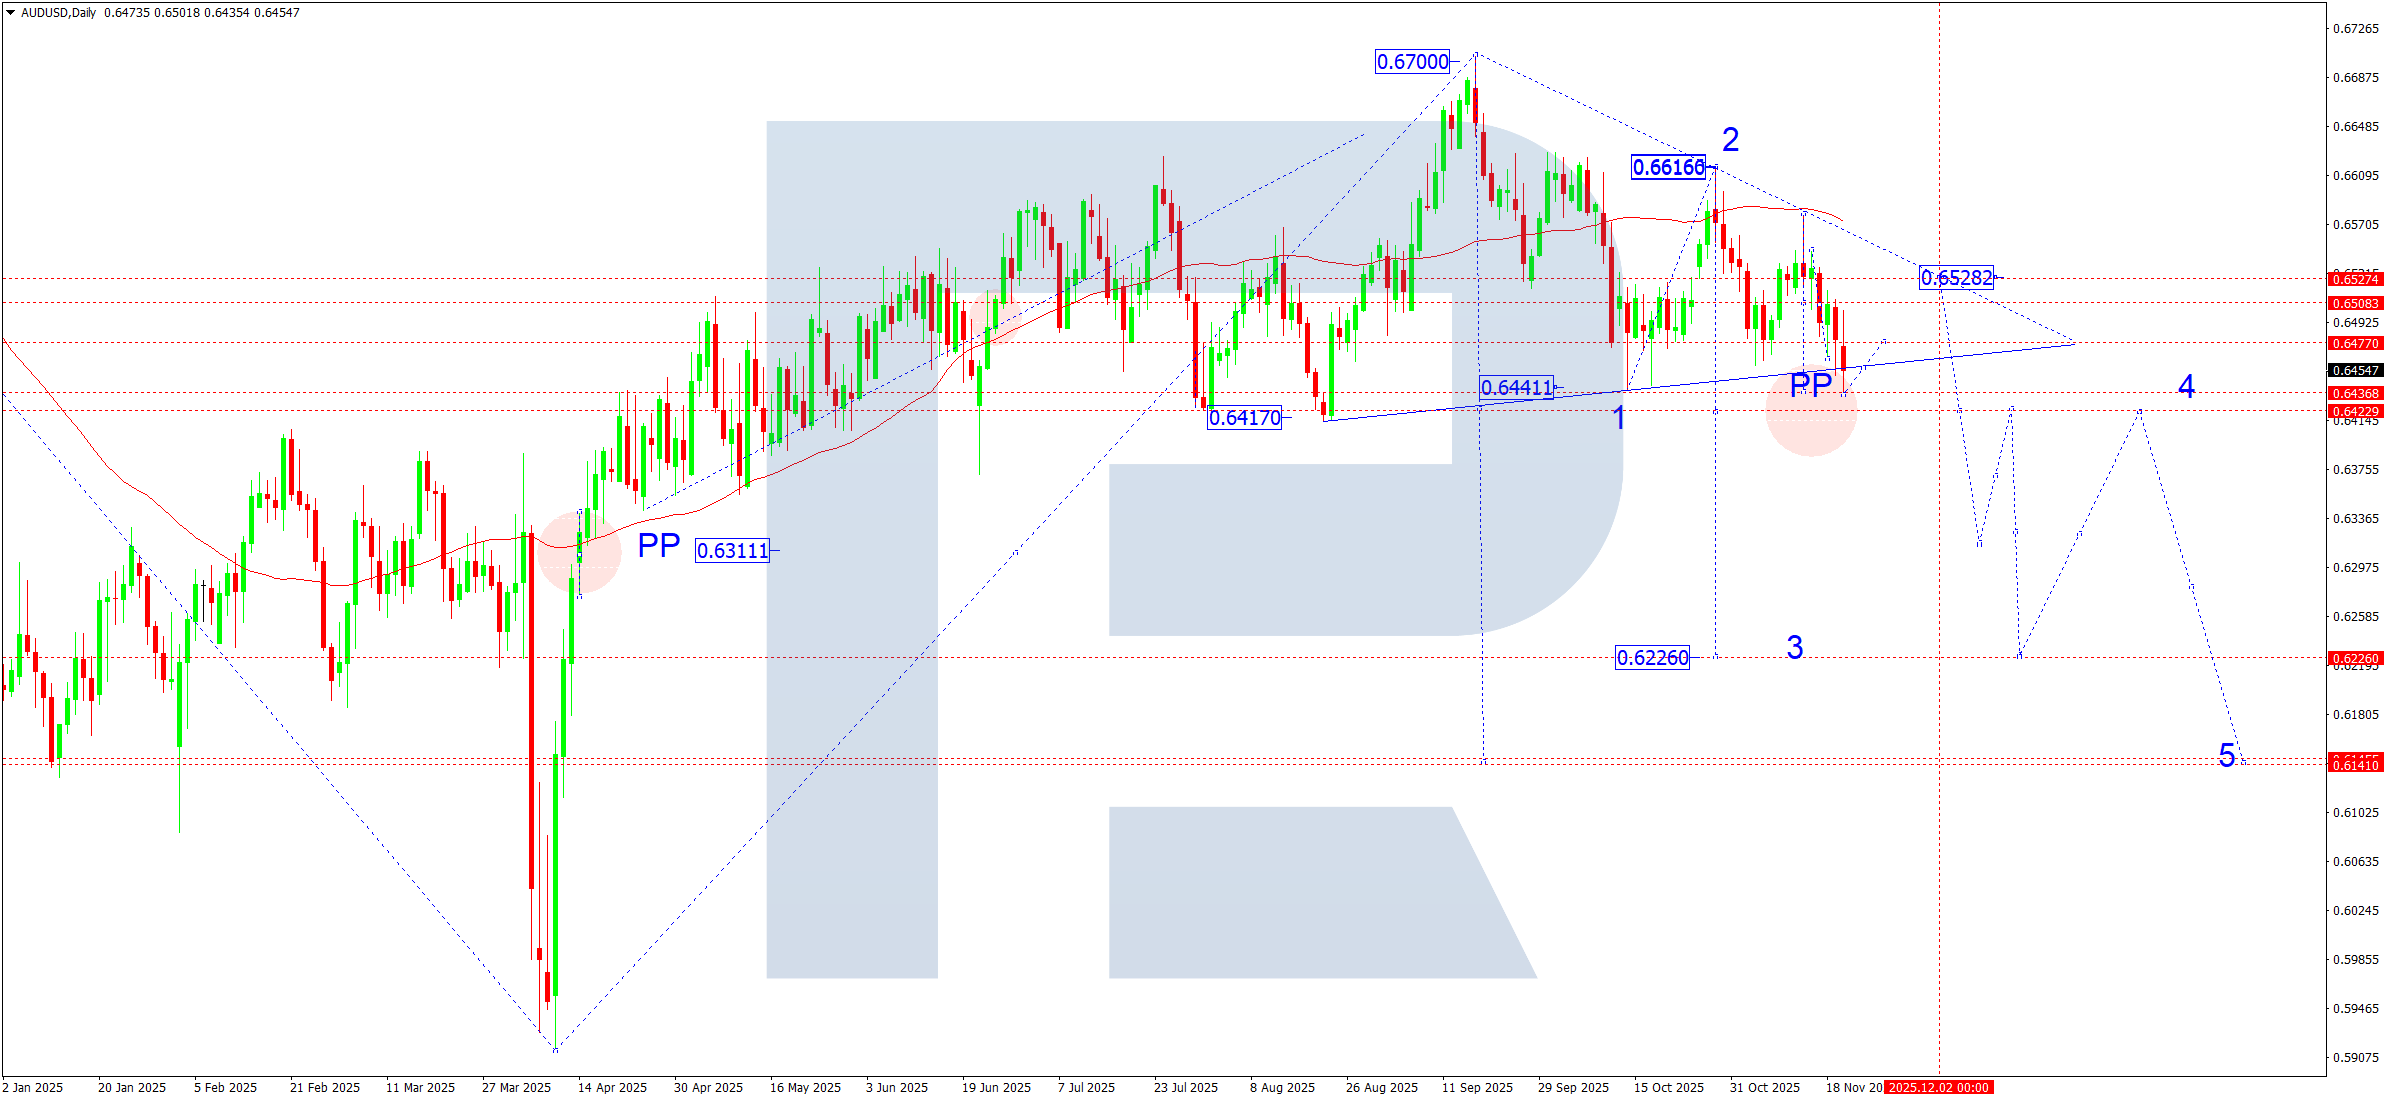
On the daily chart, the AUDUSD pair completed a decline to 0.6435. This week, a technical rebound to 0.6477 is possible (testing the previous support level from below). Subsequently, the decline could resume towards 0.6422, where a compact consolidation range is likely to develop.
A downside breakout from this range will open the potential to continue the third downward wave with the first target of 0.6333 and a medium-term target of 0.6222.
AUDUSD forecast scenarios
Bearish (main) scenario: a breakout and consolidation below the 0.6435 level will create conditions for an accelerated decline towards 0.6333 and then to the local target at 0.6222.
Bullish (alternative) scenario: a firm consolidation above 0.6480 will open the door for a corrective rise to 0.6530; however, the trend remains bearish, and the upswing is viewed as corrective.
USDCAD forecast
The USDCAD pair maintains its upward momentum, driven by a combination of factors:
- US – stronger dollar demand
The FOMC minutes signal a continued hawkish tone, supporting the dollar. US inflation has stabilised above the Fed’s targets, so the market is pricing in a high probability of no rate cuts until the end of the year. Treasury yields remain near local highs, enhancing the USD’s appeal.
- The Bank of Canada maintains a softer tone due to weak domestic demand and a cooling labour market. Slowing inflation increases the likelihood of further BoC rate cuts early next year. The Canadian dollar is under pressure due to moderate demand for commodities and lower commodity prices in Q3
- Oil – a neutral-to-negative factor for the CAD
Brent is trading within a corrective structure, with uncertainty around OPEC+ quotas preventing prices from rising. The absence of a clear direction in oil deprives the CAD of a key supportive driver.
USDCAD technical analysis
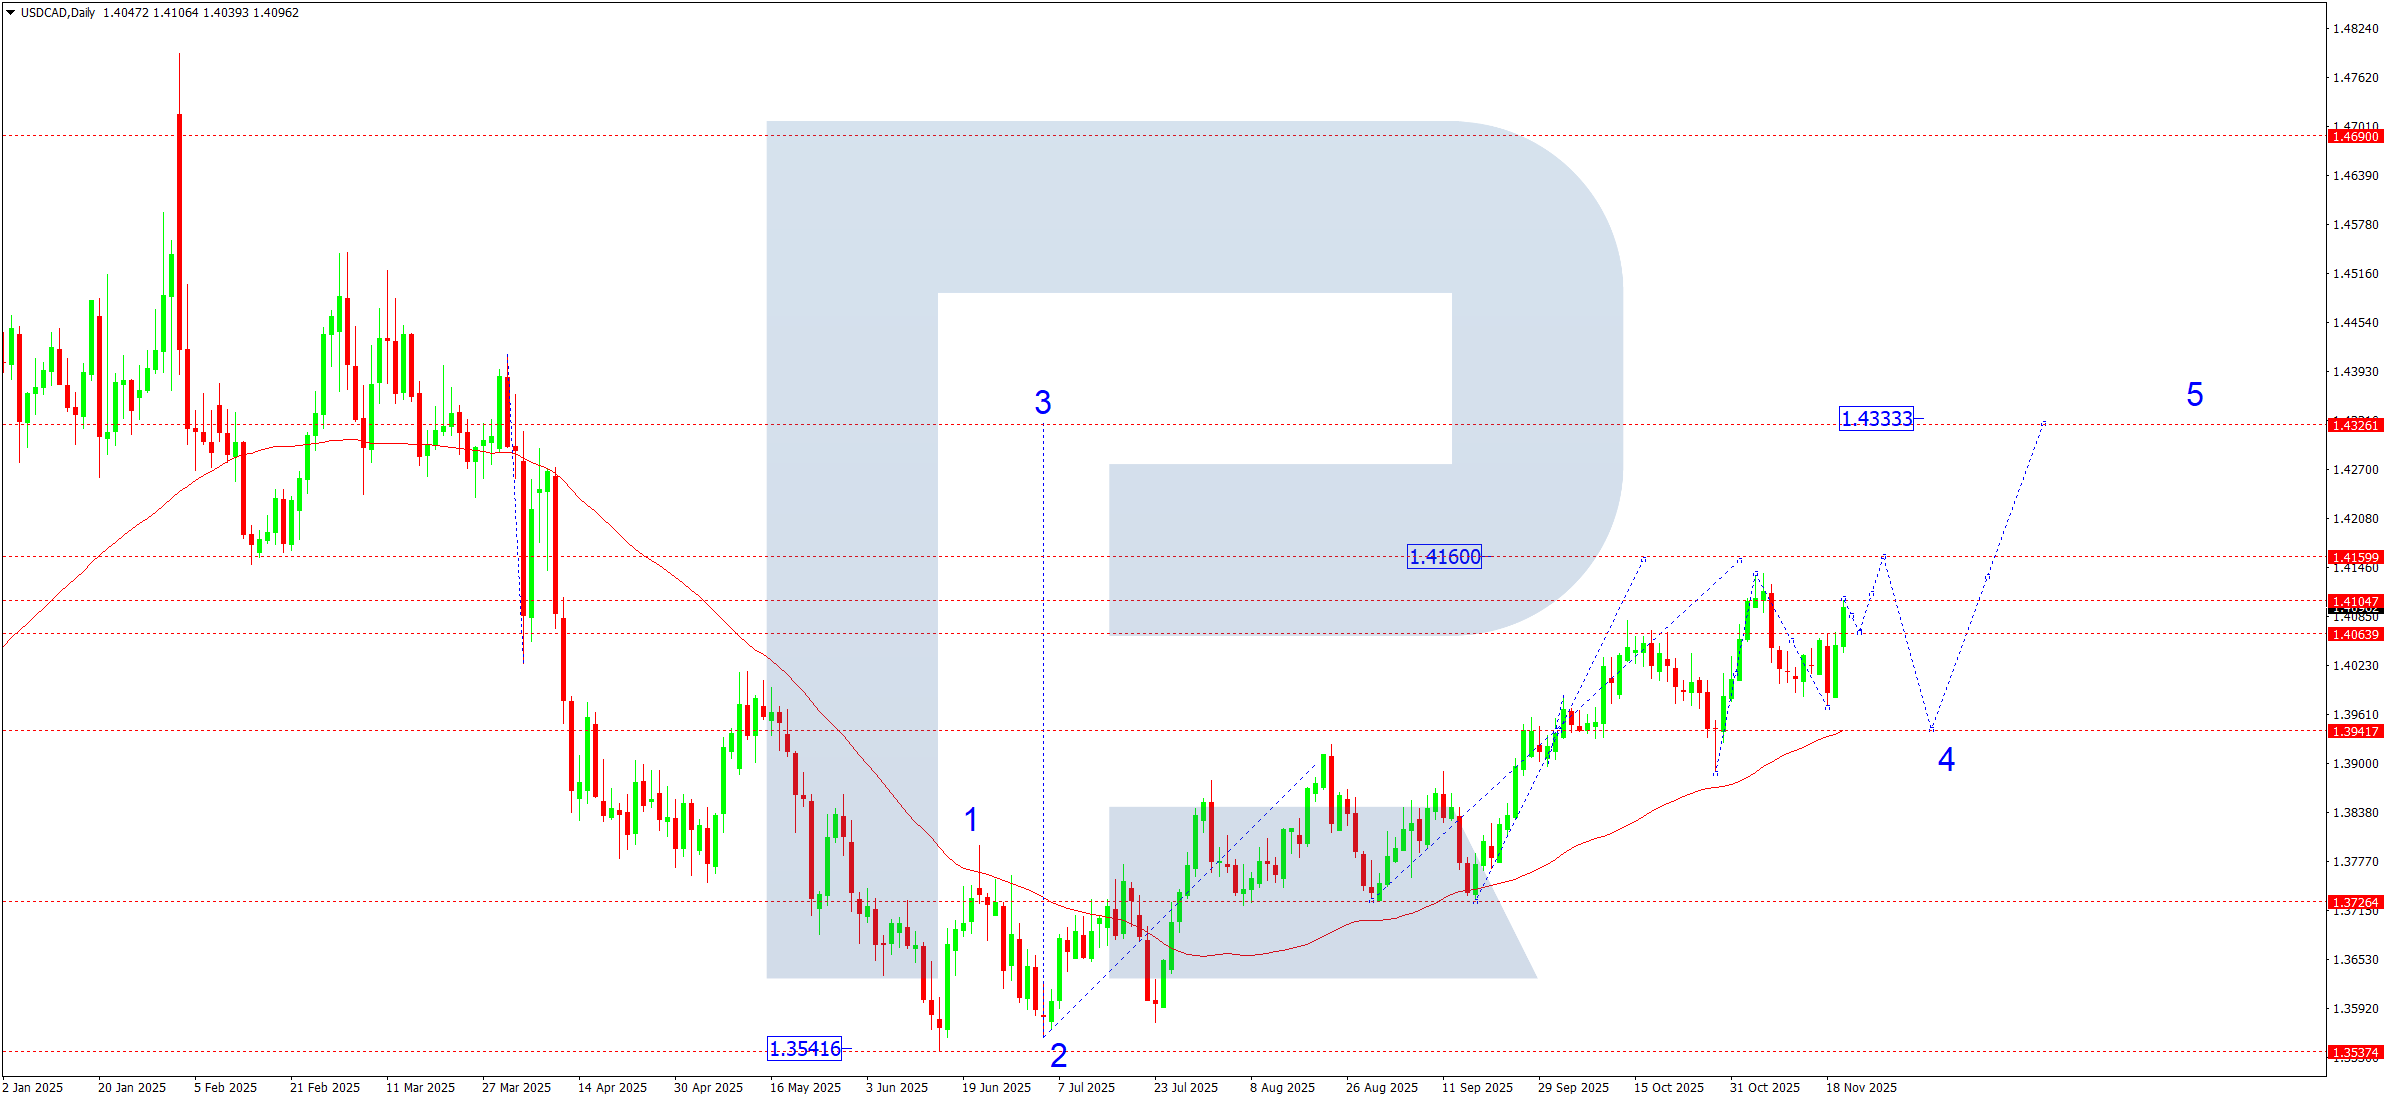
On the daily chart, the USDCAD pair completed a corrective wave at 1.3972. Currently, another bullish impulse structure is forming towards 1.4160, an estimated target of the third wave. After that target is reached, a corrective wave is expected with a pullback to the 1.3939 area (testing from above). Subsequently, after the correction ends, the fifth upward wave is projected to develop, aiming for 1.4333 as the main estimated target of the uptrend.
USDCAD forecast scenarios
Bullish (main) scenario: a breakout above 1.4065 confirmed the start of the next impulse structure upwards and opened the way for a rise towards 1.4160 (the minimum target zone).
Bearish (alternative) scenario: in the event of a sharp pullback and a breakout below 1.4040, confirmed by higher volumes, the market may shift to an extended correction targeting the 1.3939 area.
XAUUSD forecast
This week, gold’s performance will be determined by a combination of three key factors, including expectations for Fed rate cuts, movements in US Treasury real yields, and the overall level of global risk appetite.
- Fed policy and expectations of easing in December – January: following the latest FOMC minutes, the market increased expectations for the first rate cut within the next two meetings. US inflation metrics continue to show moderate month-over-month deceleration, and the core CPI is in a steady downtrend. This keeps real yields under pressure – a factor that traditionally supports gold. However, some easing is already priced in, making gold sensitive to any hawkish comments from Fed officials
- Yield dynamics and dollar liquidity: real yields on 10-year Treasuries remain near the quarter’s local lows. Any attempt to move back above 2% will limit gold’s upside. Meanwhile, the US Dollar index is forming a medium-term corrective structure, which additionally supports the metal, but the dollar’s weakening structure has not yet been confirmed by breakouts of key levels
- Geopolitical uncertainty: elevated tensions in the Middle East and Asia maintain demand for safe-haven assets. Investors view gold as a hedge against conflict escalation and sharp volatility spikes in commodity markets. This factor remains a background yet steady source of support
XAUUSD technical analysis
On the daily chart, the market completed a correction towards 4,000 (testing from above). An upswing to 4,130 and a pullback to 4,040 followed. The market has practically outlined the bounds of a consolidation range around 4,130. This week, the upward wave could continue towards 4,285. Subsequently, it will be relevant to consider a correction towards 4,030.
XAUUSD forecast scenarios
Bullish (main) scenario: a breakout above the 4,130 level will open the potential to continue the corrective wave to 4,285.
Bearish (alternative) scenario: a firm consolidation below 4,000 will trigger a decline to 3,840 and 3,660.
Brent forecast
The oil market enters the last week of November amid a moderate reduction in supply-shortage risk and heightened uncertainty regarding the global economy. The key factor is a gradual recovery of output in several OPEC+ countries, primarily Saudi Arabia and Iraq, which pressures prices, limiting upside potential in the short term. At the same time, medium-term support for prices comes from demand expectations in Asia: data from China indicate stabilisation in the industrial sector. In the US, the supply adjustment cycle continues: shale producers’ activity remains below annual averages, and official EIA forecasts point to slower supply growth in Q1 2026. Additional support is provided by declines in US commercial inventories in recent weeks. The geopolitical backdrop is mixed. Flare-ups on certain transport routes are not causing systemic supply disruptions, but the market retains a risk premium given prolonged instability in the Middle East. Any new developments in the region can trigger short-term volatility spikes. Market participants are also evaluating prospects for the December OPEC+ meeting, where the strategy of flexible output management may be reaffirmed. The scenario of maintaining current quotas looks more likely, supporting expectations of market rebalancing by year-end. Overall, the fundamental backdrop for Brent remains moderately neutral: short-term price pressure persists due to rising supply, but the medium-term balance still leans towards a gradual price recovery if there are no external shocks.
Brent technical analysis
On the daily chart, Brent prices failed to consolidate above 64.00. Breaking below the 63.40 level, the market suggests the development of another corrective leg to 61.75. After the correction is complete, a new bullish wave could start, aiming for 66.00, with the potential to continue the move to the local target of 69.10.
Brent forecast scenarios
Bullish (main) scenario: given serious geopolitical risks in Europe and the Middle East – which can escalate at any time – a sharp rise is possible, with targets at:
- first target: 69.10
- second target: 72.10
- main target of the first upward wave: 78.30
Bearish (alternative) scenario: the breakout below the 63.40 level opened the potential to extend the correction towards 61.75.

Forecasts presented in this section only reflect the author’s private opinion and should not be considered as guidance for trading. RoboForex bears no responsibility for trading results based on trading recommendations described in these analytical reviews.