Weekly technical analysis and forecast (1–5 December 2025)
This weekly technical analysis highlights the key chart patterns and levels for EURUSD, USDJPY, GBPUSD, AUDUSD, USDCAD, gold (XAUUSD), and Brent crude oil to forecast market moves for the upcoming week (1–5 December 2025)
Major technical levels to watch this week
- EURUSD: Support: 1.1525, 1.1405. Resistance: 1.1620, 1.1650
- USDJPY: Support: 154.90, 153.90. Resistance: 157.77, 158.40
- GBPUSD: Support: 1.3145, 1.3088. Resistance: 1.3266, 1.3290
- AUDUSD: Support: 0.6486, 0.6422. Resistance: 0.6540, 0.6555
- USDCAD: Support: 1.3970, 1.3940. Resistance: 1.4130, 1.4160
- Gold: Support: 4140, 4022. Resistance: 4280, 4380
- Brent: Support: 61.90, 60,00. Resistance: 65.00, 69.10
EURUSD forecast
Market uncertainty is increasing, driven by two key factors:
- Budget pressures in the US and stepped-up initiatives by the Trump administration. The White House is intensifying attempts to replenish the federal budget, including revising trade agreements and increasing pressure on US external partners. This creates heightened volatility in USD pairs, especially amid the lack of a unified line in Congress. Investors are pricing in the risk of potential fiscal tightening and continued rhetoric about fair contributions from allies
- Escalation of geopolitical tensions in the Caribbean. The region is becoming a new flashpoint: the presence of US warships, diplomatic conflicts in the energy sphere, and pressure on several Latin American states increase the risk premium for geopolitical uncertainty. In such conditions, the EURUSD pair often receives moderate support as an alternative reserve currency, although the overall trend remains bearish.
Conclusion: the fundamental backdrop is mixed but favours a stronger dollar in the medium term. Any EUR spikes upwards are still viewed as corrective.
EURUSD technical analysis
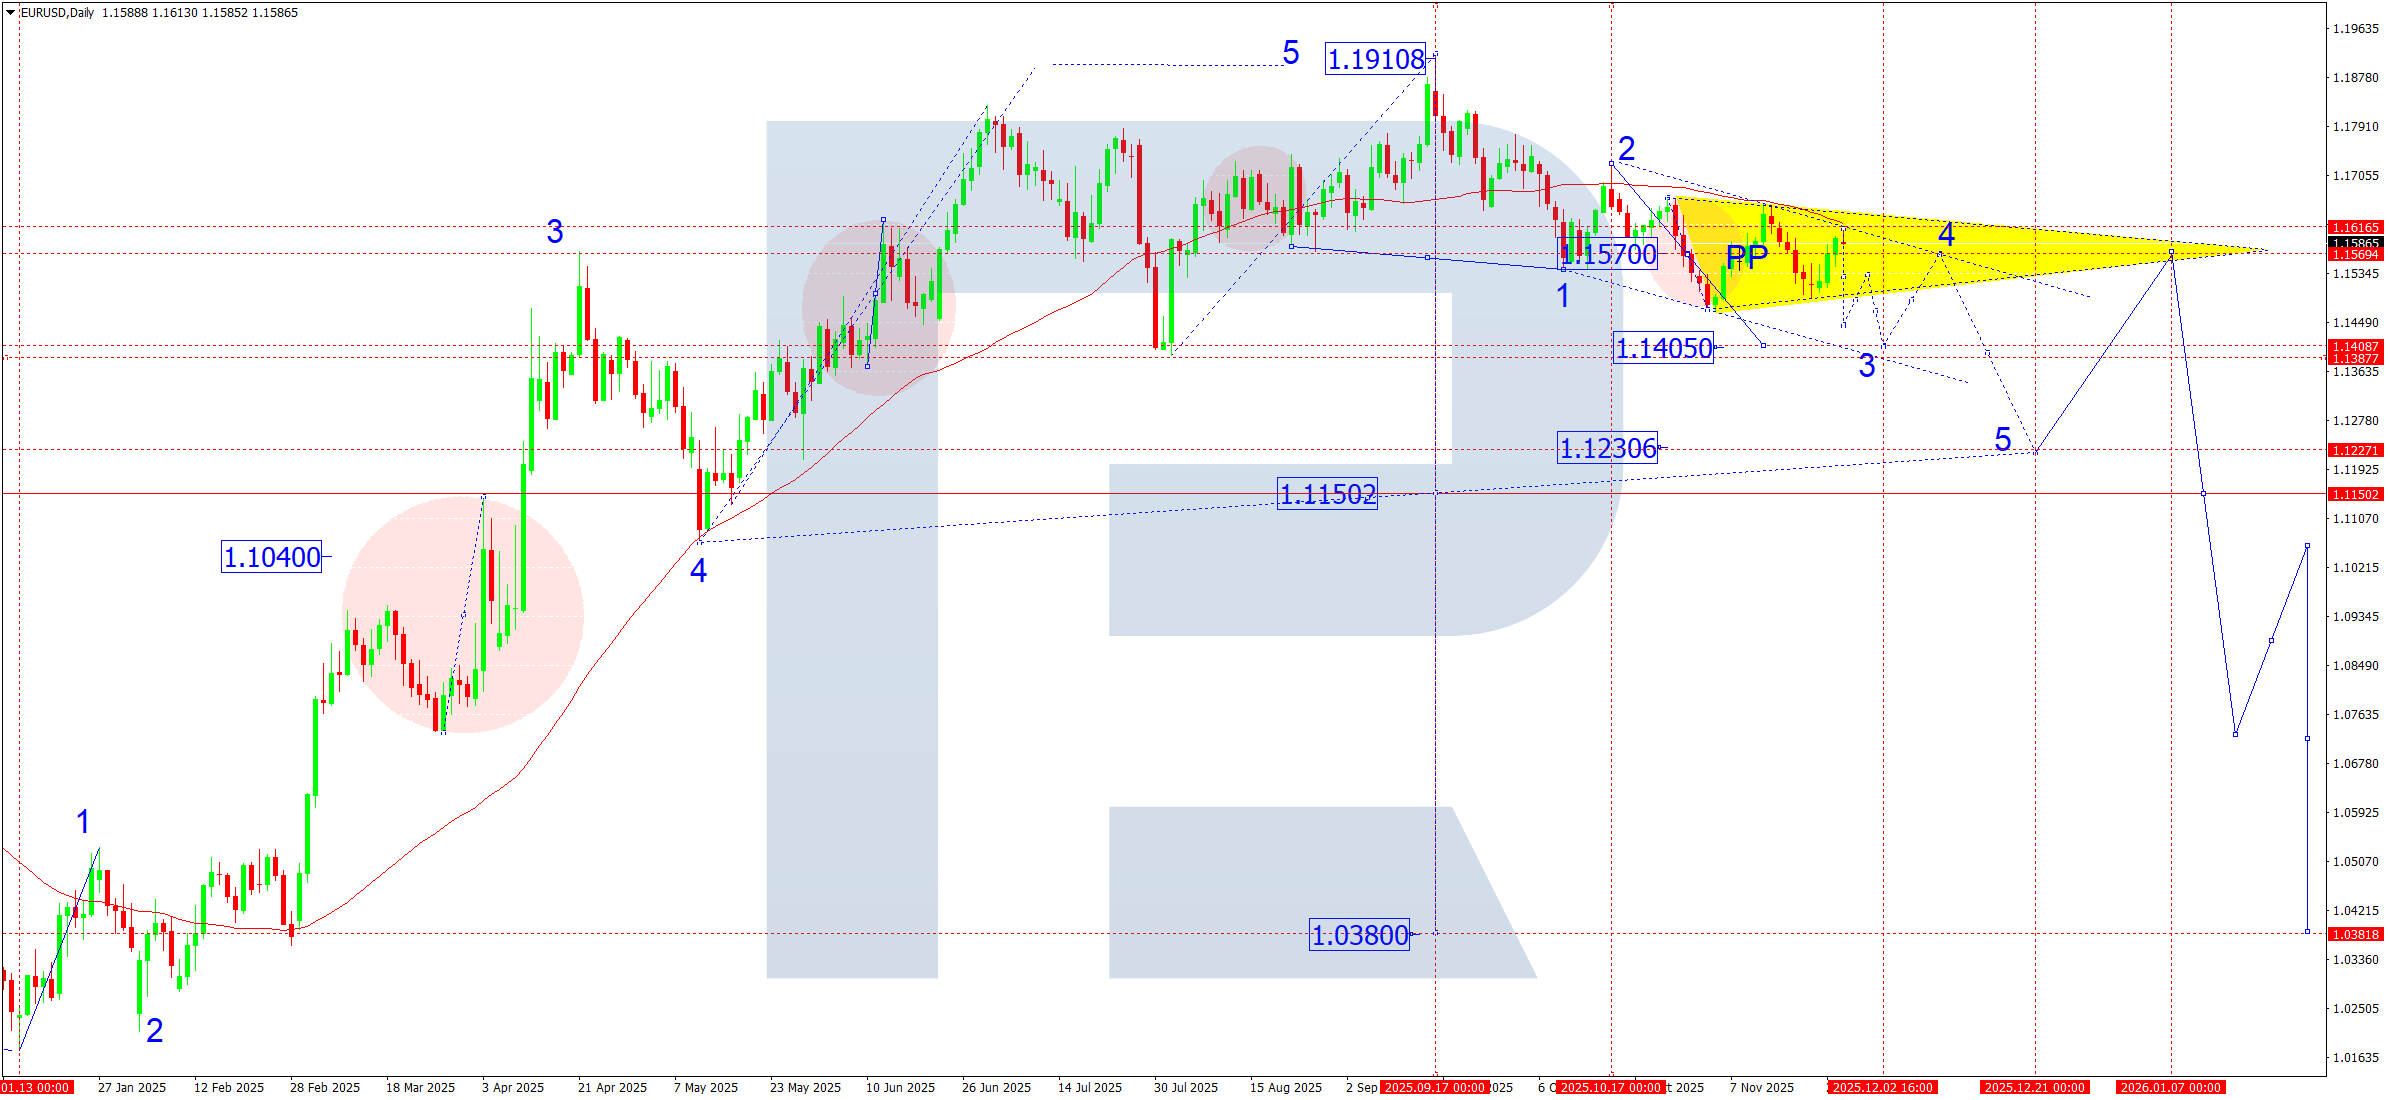
On the daily chart, the EURUSD pair continues to form a wide consolidation range around 1.1570, which acts as the pivot point of the current structure. The main markup implies development of the third downward wave towards 1.1405 as a local target. The move is progressing within a narrowing range (a wedge structure), while potential remains to test the upper boundary.
In the short term, the market suggests a corrective move up to 1.1616. This structure is seen as preparatory before the next impulse downwards. After reaching 1.1405, the pair could return to 1.1570, testing from below, which will be a control point for assessing the market’s readiness to continue the downtrend. Subsequently, the fifth wave is expected, targeting 1.1230. This wave is viewed as part of the first major trend-down structure aimed at the 1.0380 target (the low of the medium-term range).
EURUSD forecast scenarios
Bearish (baseline) scenario: completion of a correction in the 1.1616 area and resumed decline within the third wave.
- weekly target: 1.1405
- probable consolidation and the start of an upward correction to 1.1570
Bullish (alternative, unlikely) scenario: if the market breaks the 1.1620 level on rising volume, the correction could extend up to 1.1700. This scenario is possible only with short-term USD weakness amid US news.
USDJPY forecast
The USDJPY pair remains under the influence of mixed fundamental factors.
- US: pressure from yields and fiscal policy
The Trump administration continues to seek sources to finance the expanding budget deficit. The market is pricing in the risk of increased Treasury issuance, which keeps yields elevated. This, in turn, supports the dollar against the yen. However, the lack of progress in agreeing on budget items creates short-term waves of uncertainty and periodic USD corrections.
- Japan: BOJ’s dovish policy and controlled yen volatility
The Bank of Japan maintains an ultra-loose monetary policy. Intervention risks from the Ministry of Finance remain in focus, but the market views levels above 155.00 as borderline rather than critical. The absence of tightening signals reduces the potential for sustained yen strengthening.
- Geopolitics: the Caribbean
Escalation in the Caribbean region is an additional driver of demand for safe-haven assets. Episodic volatility spikes can increase temporary demand for the yen. However, the market still does not view the situation as a systemic crisis, so the impact is irregular.
- Overall risk conditions
US equities retain a moderate risk appetite, reducing demand for safe-haven currencies. But any increase in geopolitical risks or fiscal pressure can trigger a brief shift into the yen and strengthen local USDJPY corrections.
USDJPY technical analysis
On the daily chart, the market reached the estimated wave target at 157.77. After hitting the target, a downside impulse formed and the pair shifted to building a consolidation range around 156.40.
In the coming week, another downside impulse is expected to test the 154.90 level before the pair returns to 156.40, where the market will confirm the boundaries of the new consolidation range.
An upside breakout from the range will open the potential to continue the uptrend to 158.40 and further – along the trend in the fifth wave to at least 159.88. Conversely, a downside breakout will signal a larger correction targeting 149.90.
USDJPY forecast scenarios
Bearish (baseline) scenario: continued decline to 154.90 and rebound to 156.40 (formation of a consolidation range). If the pair sharply breaks below the 154.90 level, a full-fledged correction could follow, targeting 149.90.
Bullish (alternative) scenario: a confident breakout above 157.00 will open the way for growth to 158.40 and further towards 159.88 as part of the fifth upward wave.

GBPUSD forecast
The GBPUSD pair enters December amid mixed macroeconomic dynamics in the UK and the US and rising geopolitical uncertainty.
- UK: recession risks and weak demand
UK economic activity remains constrained despite the market’s attempt to refocus on inflation data. The recent CPI reports show a moderate slowdown in price pressures; however:
- Core CPI remains above target, forcing the Bank of England to keep a hawkish tone
- Real household incomes continue to decline, increasing the risks of weaker consumption in Q4
- The services PMI has returned to the 50 threshold, signalling stagnation
In its recent comments, the Bank of England stressed that any policy easing will be gradual, as inflation is falling more slowly than expected. This prevents a deeper drop in the pound but does not provide stable support, since the market is pricing in the first BoE rate-cutting cycle no earlier than H2 2026.
- US: strong labour market and hawkish Fed rhetoric
The dollar maintains relative strength thanks to a resilient labour market, steadier economic growth, and hawkish Fed commentary. At present:
- The Fed indicates the need to keep rates high for longer to ensure inflation’s return to 2%
- Recent Non-Farm Payrolls beat expectations, boosting demand for the dollar
- The bond market shows a moderate rise in yields in the belly of the curve
All this forms a moderately dollar-positive backdrop, limiting GBP upside and prioritising the bearish GBPUSD scenario.
- Geopolitical factors
The Caribbean situation and the Trump administration’s negotiations with partner governments on budget redistribution create elevated volatility and periodic safe-haven demand. These dollar-supportive periods coincide with technical phases of GBP weakness.
- Correlations and cross-market influence
- The dollar index (DXY) remains in a bullish structure, pressuring the GBPUSD pair
- The oil market remains stable, indirectly supporting the dollar via expectations of firmer Fed behavior.
Risk sentiment is generally moderately negative, which typically works against the GBP.
GBPUSD technical analysis
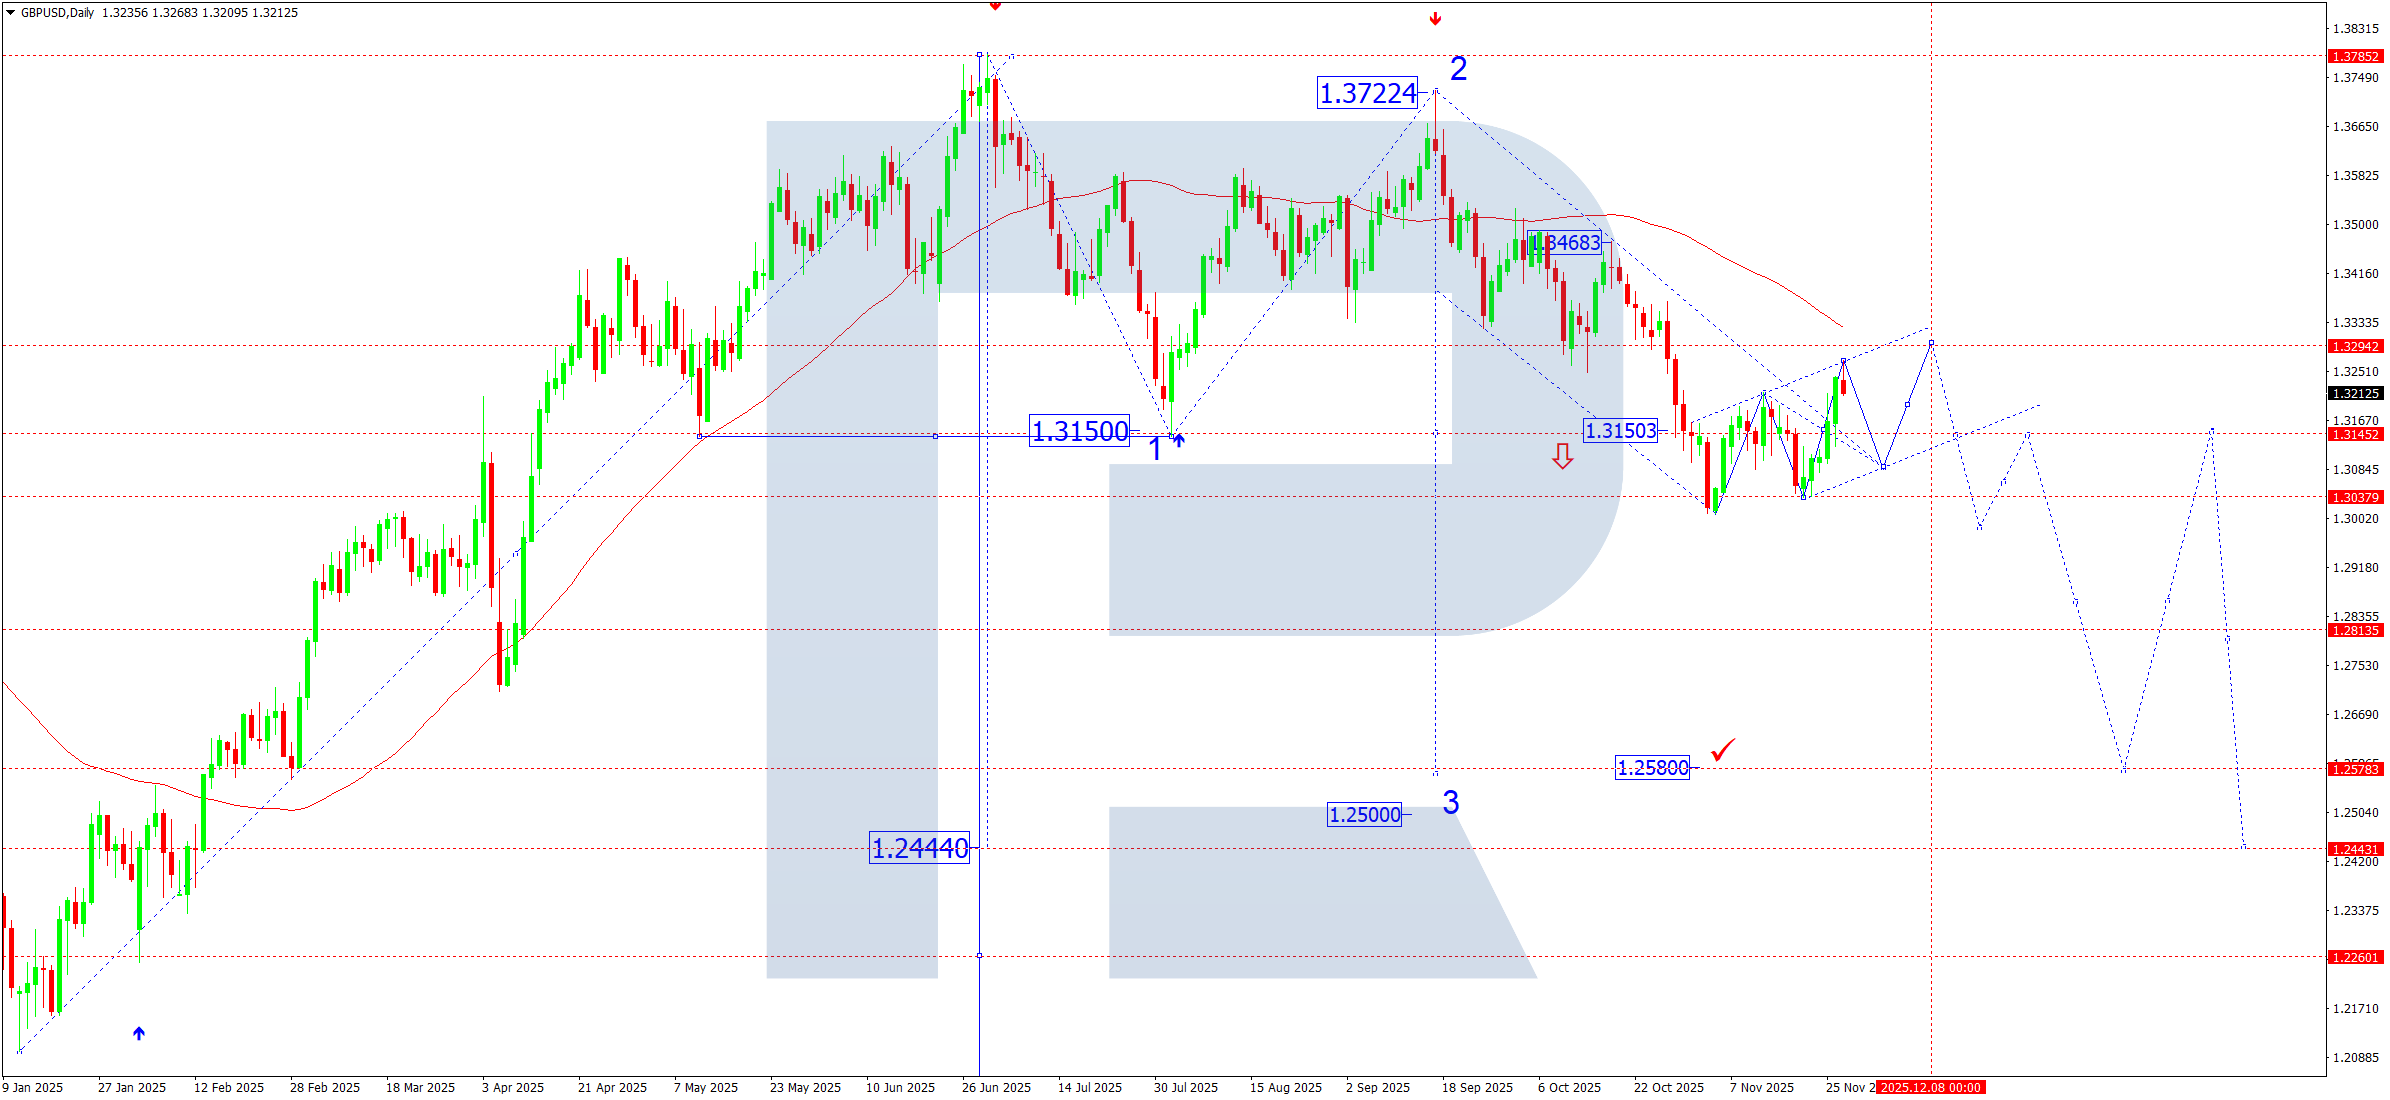
On the daily chart, the GBPUSD pair formed a consolidation range around 1.3150. Last week, the price reached a local correction target at 1.3268. Subsequently, a downward move towards 1.3145 is expected (testing from above). This level is seen as a potential starting point for another corrective structure up to 1.3290. After this correction completes, a new downward wave could begin, aiming for 1.3150 and potentially extending to 1.2980. Effectively, a pivot point is expected to develop around 1.3150 for this entire downward wave towards 1.2580 as a local target.
GBPUSD forecast scenarios
Bearish (main) scenario: a downside structure to 1.3145 is possible.
Bullish (alternative) scenario: the pair could rise from 1.3145, targeting 1.3290.
AUDUSD forecast
The Australian dollar remains under pressure amid lingering uncertainty over the trajectory of global commodity demand and the RBA’s cautious tone. The regulator signals the need to monitor inflation processes, avoiding premature tightening steps. Additional influence comes from a moderate weakening in risk appetite as the market is closely watching rising geopolitical tensions in the Asia-Pacific and the mixed dynamics of Chinese macroeconomic indicators. The USD retains relative strength thanks to high US Treasury yields and safe-haven inflows.
AUDUSD technical analysis
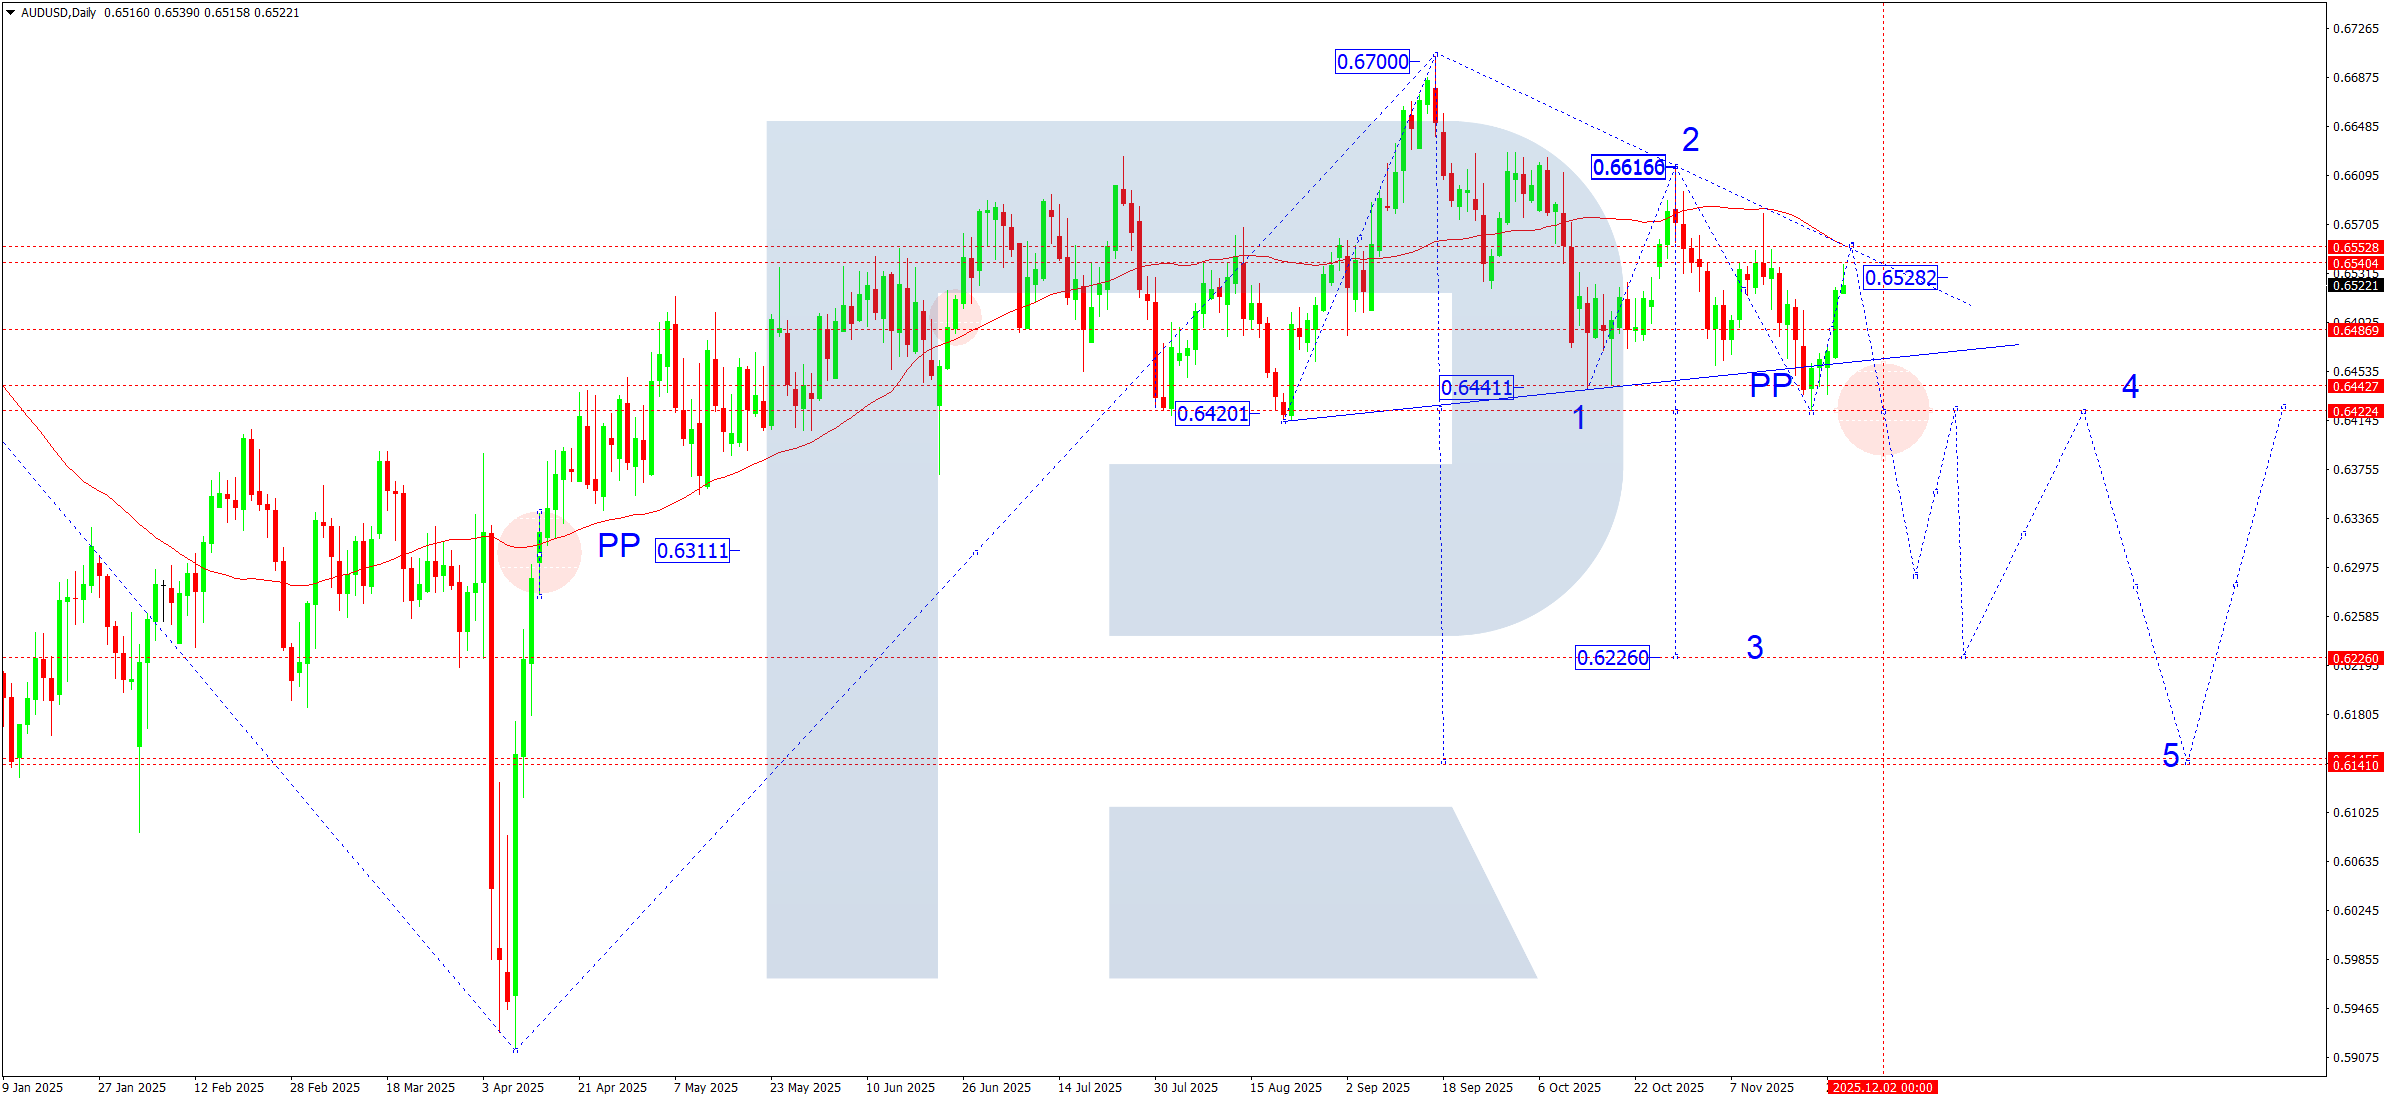
On the daily chart, the AUDUSD pair is forming a corrective structure. The price has reached the local target of this corrective wave at 0.6539.
This week, a downward move towards 0.6486 (testing from above) is likely. After reaching this level, the market may offer another recovery towards 0.6555, which is the upper boundary of the broader consolidation range. This zone corresponds to the top of a large upward wave within which a classic Triangle pattern has basically formed. The positioning of the pattern is reversal, increasing the probability of a breakout below the lower boundary.
The key expectation suggests a downside breakout from the Triangle and the development of another downward wave after the correction completes.
Local target: 0.6226
AUDUSD forecast scenarios
Bearish (main) scenario: the pair is expected to decline to 0.6486 with subsequent conditions forming for a downside breakout.
Bullish (alternative) scenario: a breakout above 0.6486 opened the potential to extend the corrective range to 0.6555.
USDCAD forecast
The pair remains sensitive to the diverging dynamics of the US dollar and oil prices. On the CAD side, pressure persists from:
- uncertainty around potential Bank of Canada easing measures, while inflation has stabilised but remains above targets
- weak data on domestic demand and export flows
The USD remains supported by:
- market participants’ firm expectations of a later start to the Fed’s rate-cutting cycle
- capital inflows into dollar assets amid rising geopolitical risks
- steady demand for safe-haven assets, which boosts interest in the USD in crosses against commodity currencies
The oil factor remains neutral-to-negative for the CAD:
- the market cannot hold above key levels, and talks among major producers provide no clear signal on genuine output cuts.
Thus, the fundamental backdrop maintains a moderately bullish tilt for the USDCAD pair with risks of expanded local volatility within a sideways structure.
USDCAD technical analysis
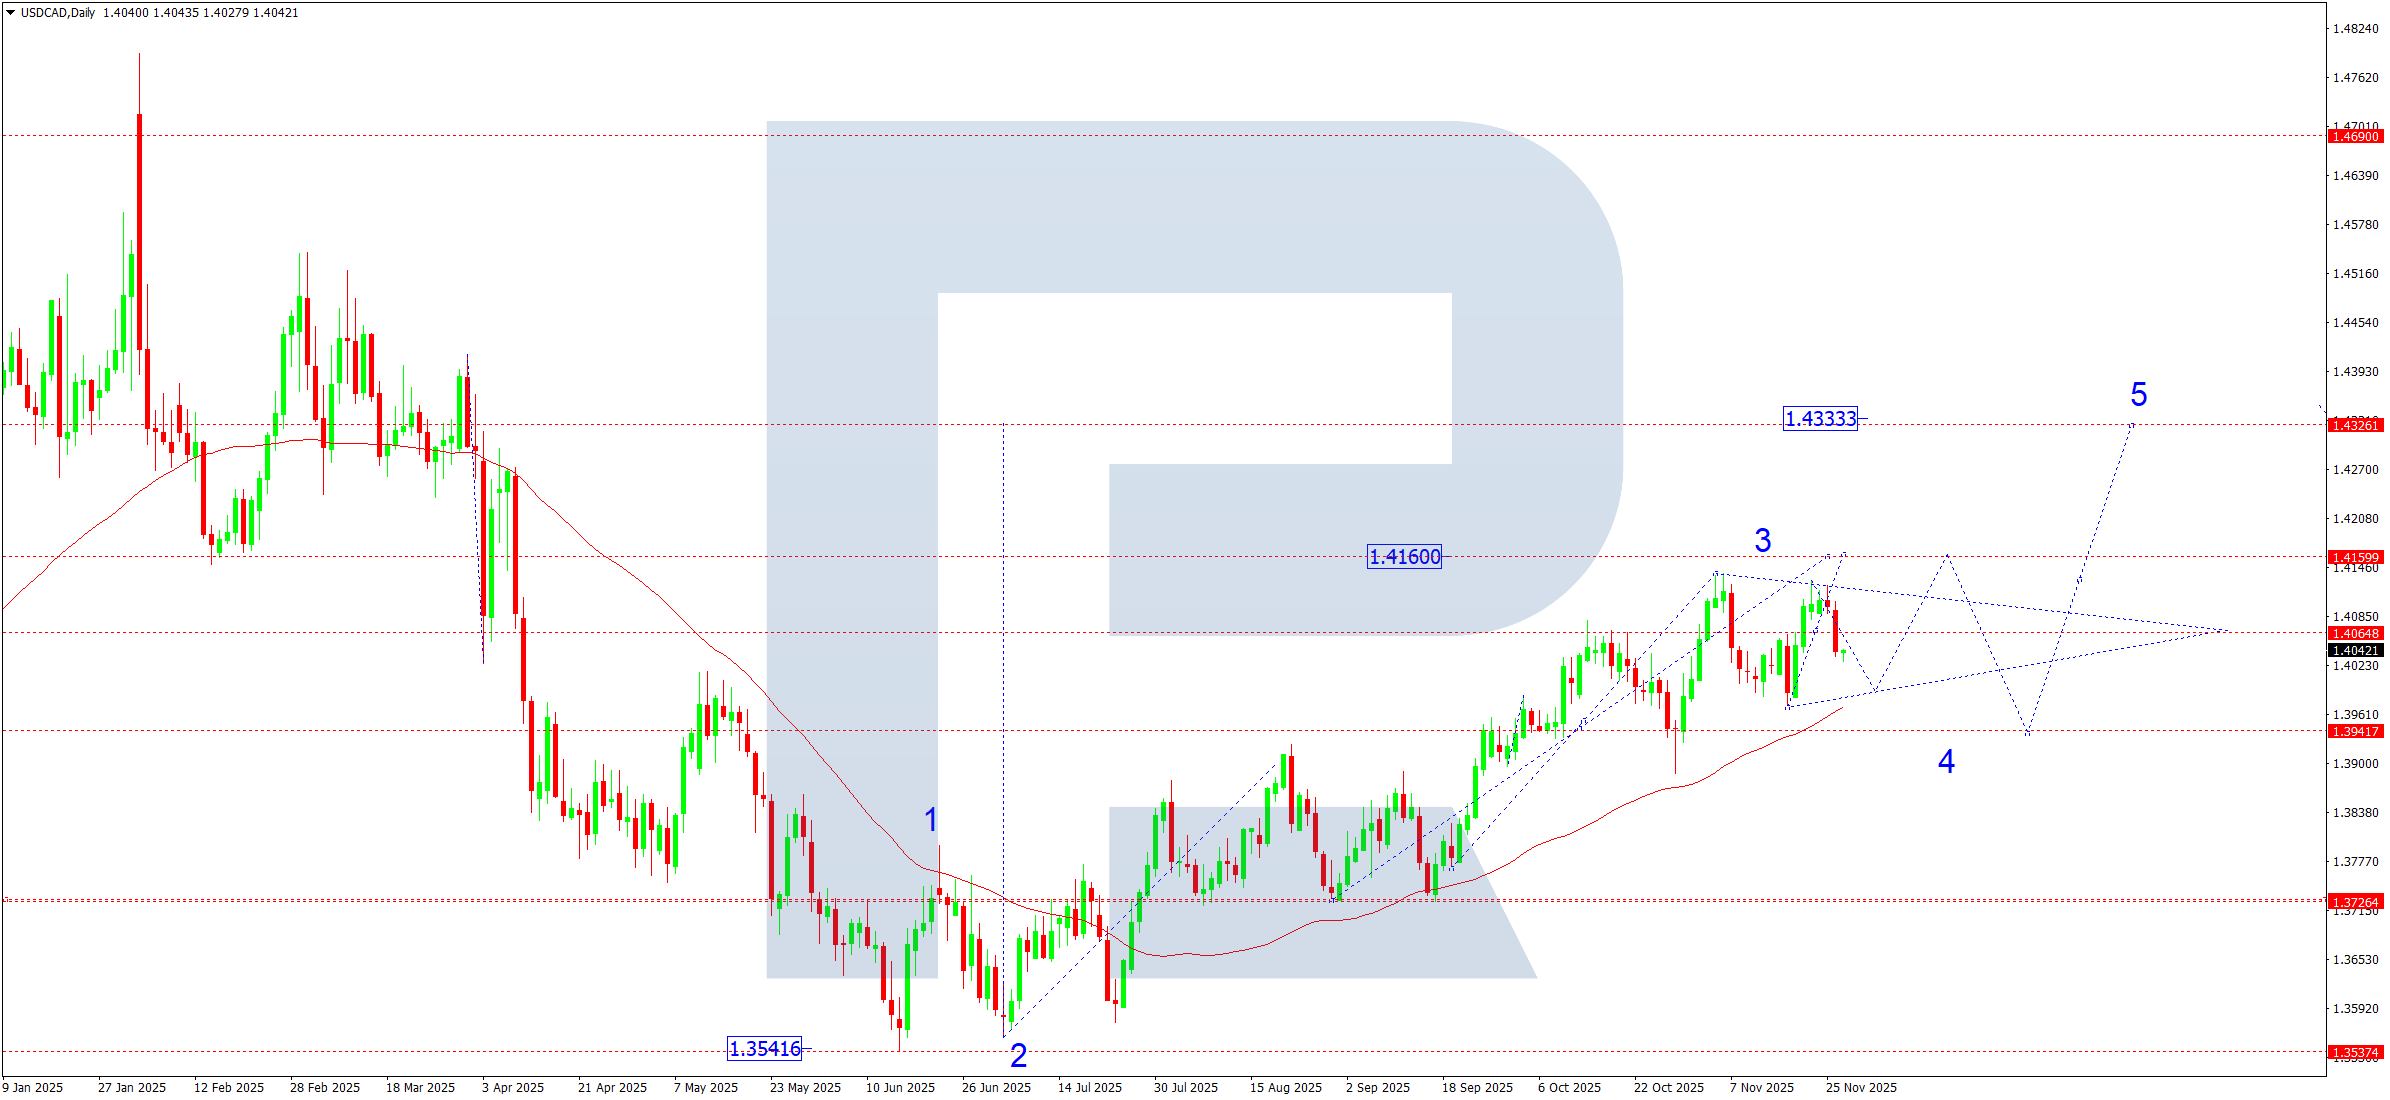
On the daily chart, the pair continues to form a wide consolidation range around 1.4055. Structurally, the market is moving within a developing Wedge pattern, confirming a gradual narrowing of swings and volume accumulation before an impulse. In the coming week, a local decline to 1.3980 and 1.3960 is possible. After testing the Wedge’s lower boundary, the pair could attempt to rise towards 1.4120. A breakout above the pattern’s upper boundary will open the path to 1.4160, the local estimated target for the third upward wave.
USDCAD forecast scenarios
Bullish (main) scenario: the breakout above 1.3940 earlier led to the achievement of the third wave’s local target at 1.4138, after which the market corrected towards 1.3970. With the current range structure, the pair still has the potential to continue the upward wave towards 1.4160 (minimum local target).
In perspective, a deeper upward impulse is likely if the Wedge pattern breaks to the upside.
Bearish (alternative) scenario: the pair is still trading in a consolidation range around 1.4055, remaining within a medium-term sideways market. Another downward move to test 1.3980 and 1.3960 is possible. A consolidation below the Wedge structure will signal a shift to a deeper correction.
XAUUSD forecast
Gold enters the new week under mixed fundamental pressures. On the one hand, the market is supported by ongoing uncertainty around the Trump administration’s budget initiatives, which aim to redistribute external financial obligations and tighten spending control. This stirs nervousness in global markets and supports demand for safe-haven assets, including gold.
Geopolitical tensions remain a key driver of volatility, with instability in several regions, including the Middle East and the Caribbean, keeping investors on heightened alert.
On the other hand, the dollar and Treasury yields retain an elevated tone amid expectations of a more hawkish Fed. December inflation releases could confirm the need to slow the pace of rate cuts in 2026, creating a fundamental headwind for gold.
As a result, the fundamental backdrop remains mixed: it creates conditions for high volatility but does not set a sustained directional impulse at the moment.
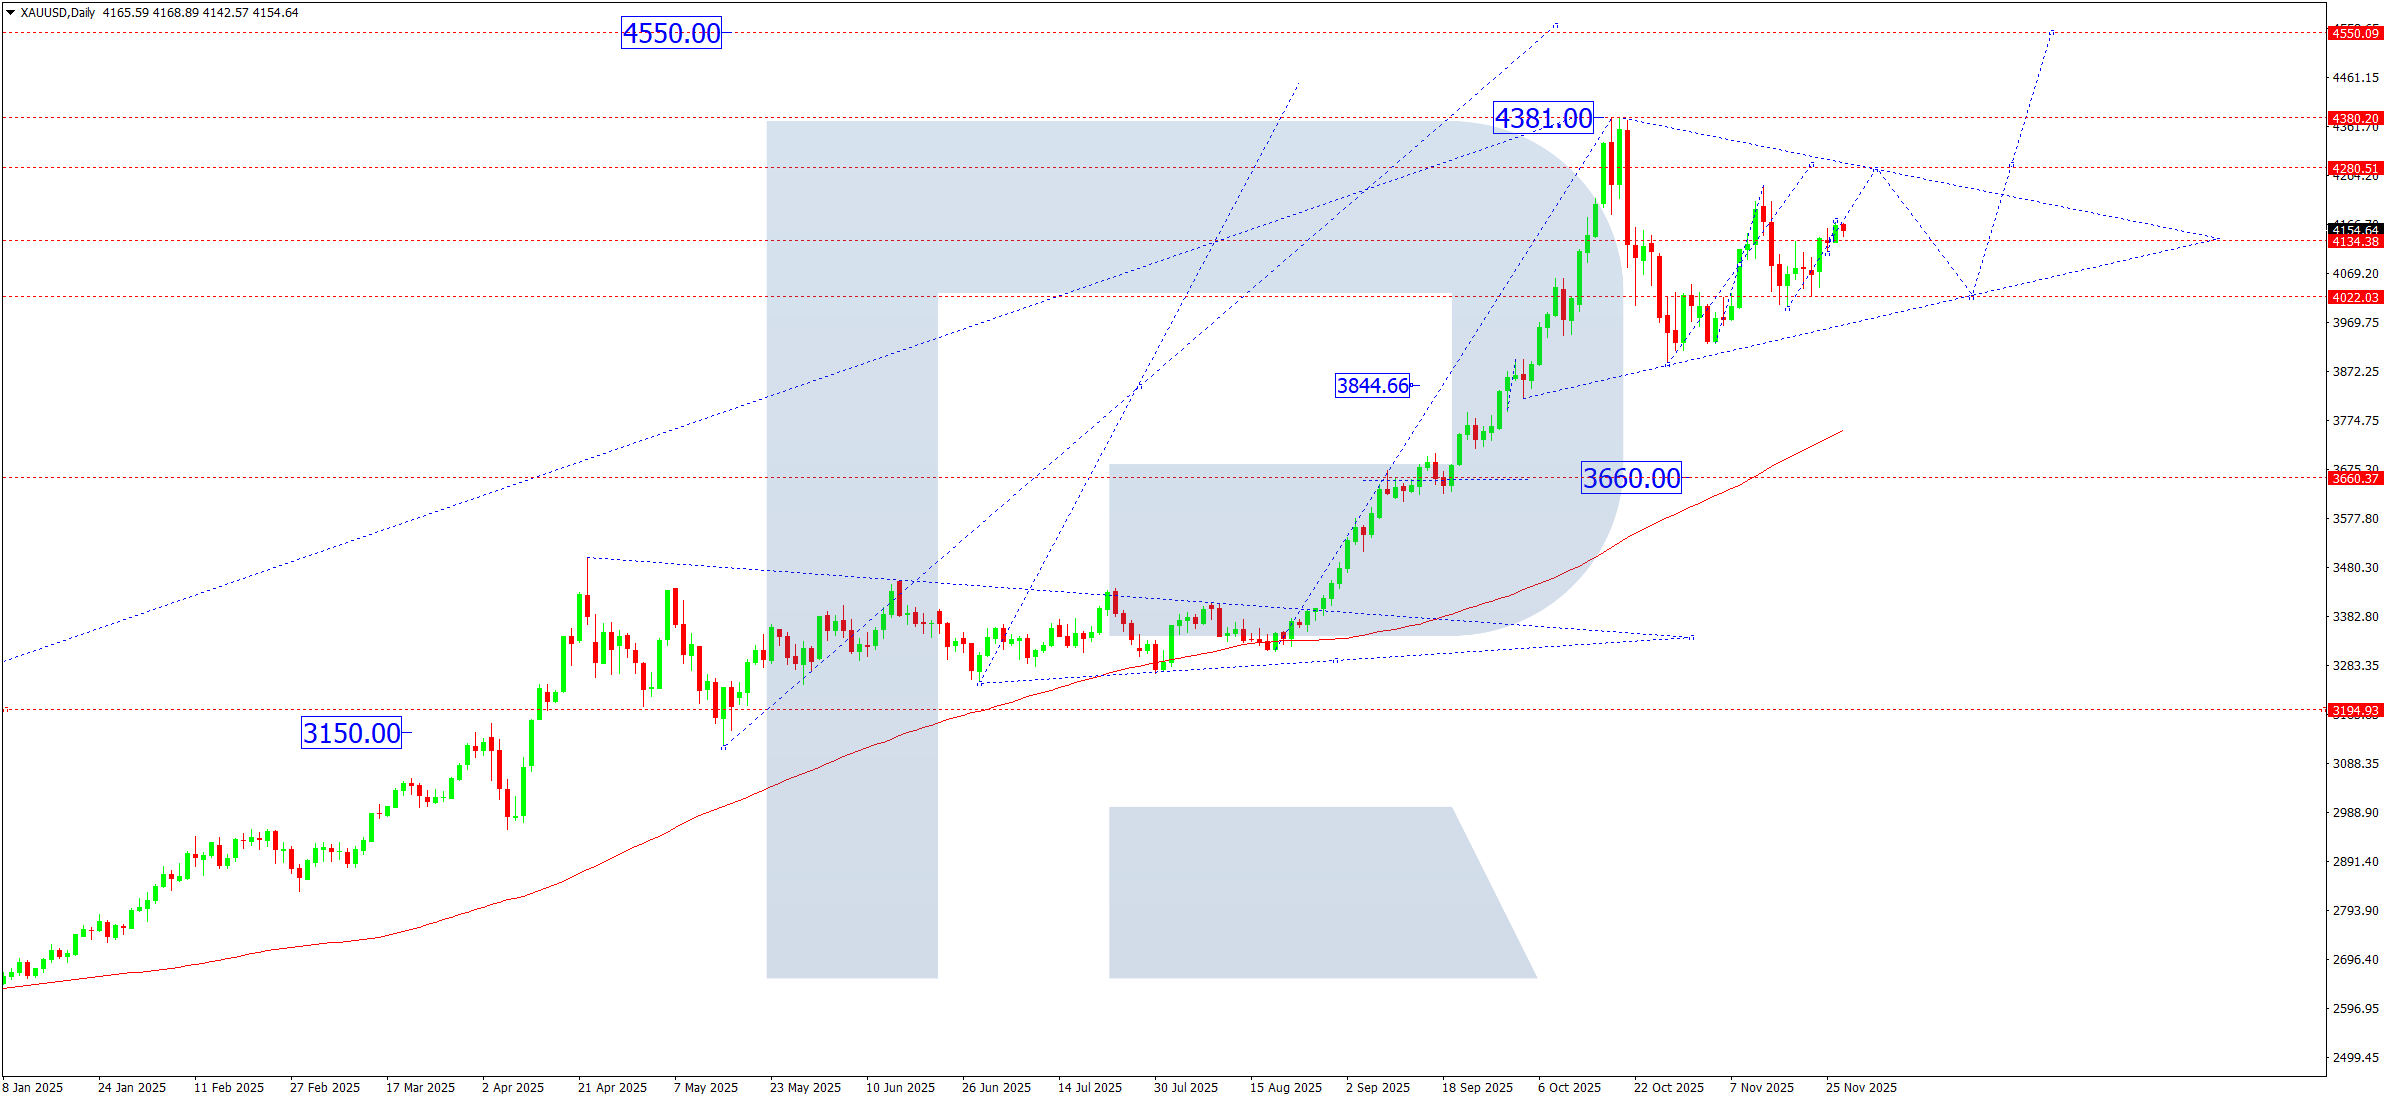
XAUUSD technical analysis
On the daily chart, the market broke above the key 4,140 level and then formed a consolidation range around this mark. This confirms development of an extended correction, where the fifth wave is forming with am estimated target at 4,280. This week, this corrective rise is expectedto complete.
The medium-term Triangle structure remains intact. The scenario will depend on price reaction near 4,280. A return below 4,140 will signal a shift to the bearish segment within the Triangle, with an initial target at 4,022 (the pattern’s lower boundary). A breakout below 4,022 will open the way to extend the correction to 3,844 while keeping the model dominant. If the market breaks out upwards from the current consolidation and holds above 4,280, this will open the potential to continue the medium-term upward wave towards 4,555.
XAUUSD forecast scenarios
Bullish (main) scenario: the market holds above 4,140, which supports the development of the fifth corrective wave targeting 4,280.
Bearish (alternative) scenario: a consolidation below 4,140 would activate a decline to 4,022 and, if broken, to 3,844.
Brent forecast
The oil market continues to trade under the influence of several geopolitical and structural factors at once:
- Escalating tensions in Europe and the Middle East maintain elevated volatility and preserve the risk of sudden price spikes
- The situation around Venezuela remains extremely unstable. Production management issues, internal political conflicts, and external pressure create a potential supply deficit
- Expansion of sanctions against Russian oil and gas companies adds further constraints on supply and logistics, which can trigger a local tightening of supply in the market
- Against this backdrop, the balance of risks tilts towards a potential surge in demand for safe-haven assets and commodities, including oil, if the situation deteriorates
Overall, the fundamental backdrop increases the probability that the market can abruptly switch from a correction to an impulse rally.
Brent technical analysis
On the daily chart, Brent continues to develop a descending correction in a Flag pattern. Prices have reached the estimated downside target at 61.00. The breakout below 62.72 confirmed development of the fifth wave within the corrective Flag pattern. At the moment, the market is returning to 62.72 (testing from below). A breakout above the 62.72 level would open the potential for a reversal and the formation of a new bullish impulse with a local target at 65.00, followed by a possible continuation towards 78.30 (the first major wave target). In the coming week, another downward move to 60.90 remains possible, which fits into the structure of the final corrective wave.
Brent forecast scenarios
Bullish (main) scenario: given high geopolitical uncertainty (Europe, Middle East, and Venezuela), as well as increased sanctions pressure on Russia’s oil sector, the market can receive a sharp upside driver at any moment.
In this case, Brent could move towards:
- first target: 69.10
- second target: 76.76
- main target of the first upward wave: 78.30
Bearish (alternative) scenario: the correction may extend. A breakout below 62.72 still preserves potential for a move to 61.90.

Forecasts presented in this section only reflect the author’s private opinion and should not be considered as guidance for trading. RoboForex bears no responsibility for trading results based on trading recommendations described in these analytical reviews.