Weekly technical analysis and forecast (9–13 February 2026)
This weekly technical analysis highlights the key chart patterns and levels for EURUSD, USDJPY, GBPUSD, AUDUSD, USDCAD, gold (XAUUSD), and Brent crude oil to forecast market moves for the upcoming week (9–13 February 2026).
Major technical levels to watch this week
- EURUSD: Support: 1.1765, 1.1605. Resistance: 1.1845, 1.2075
- USDJPY: Support: 156.15, 155.05. Resistance: 157.45, 159.45
- GBPUSD: Support: 1.3405, 1.3335. Resistance: 1.3665, 1.3875
- AUDUSD: Support: 0.6875, 0.6735. Resistance: 0.7025, 0.7255
- USDCAD: Support: 1.3605, 1.3505. Resistance: 1.3745, 1.3855
- Gold: Support: 4,575, 4,395. Resistance: 5,145, 5,450
- Brent: Support: 66.65, 64.75. Resistance: 70.65, 73.55
EURUSD forecast
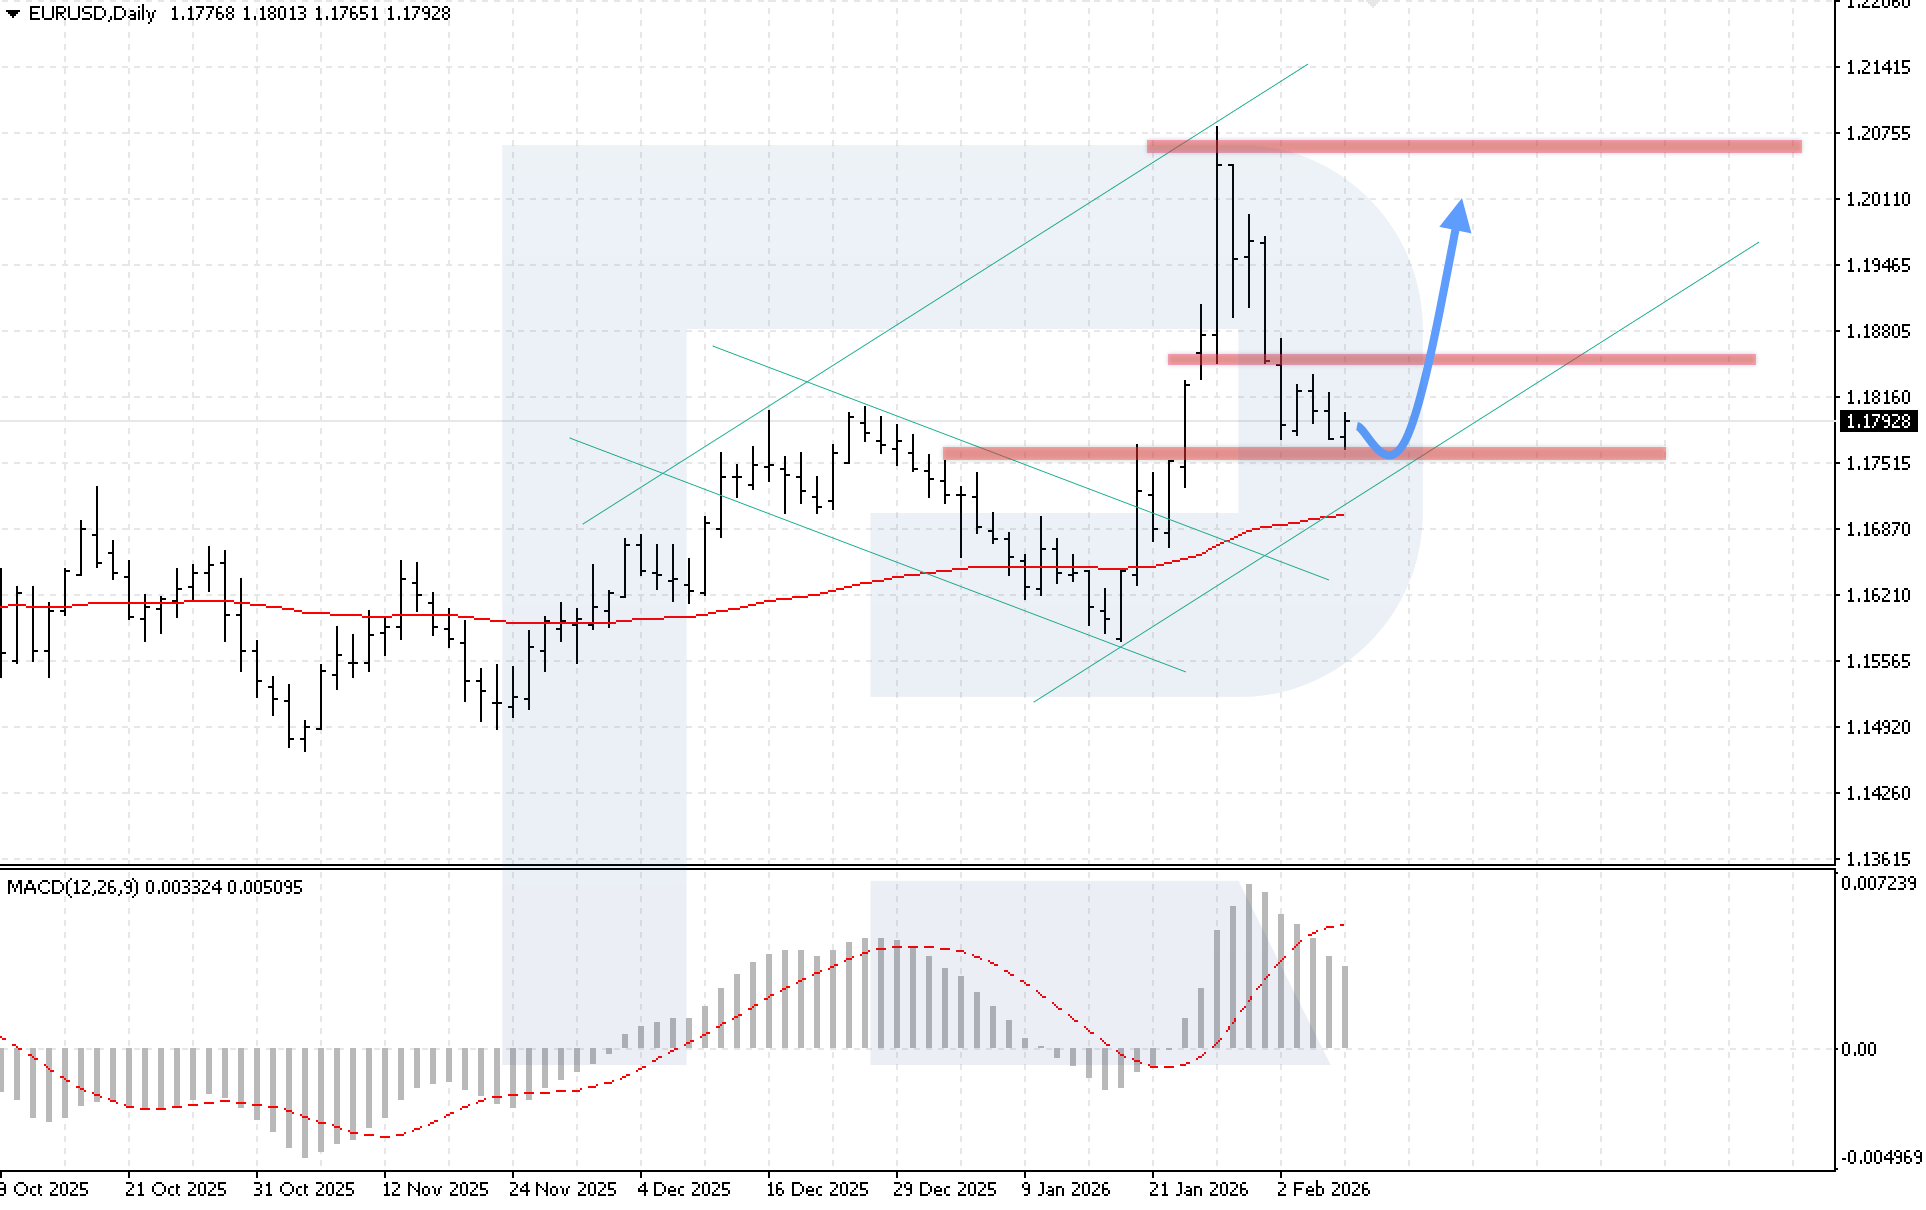
The EURUSD pair ends the second week lower, but quotes remain near the key support level and continue to test the upper boundary of a large Triangle pattern, which may indicate the possibility of short-term consolidation ahead of the next move.
The European Central Bank kept interest rates unchanged in line with market expectations. The ECB noted that inflation should stabilise at 2% in the medium term, while the eurozone economy is showing resilience amid risks from global trade policy and geopolitical tensions. This creates a neutral fundamental backdrop for the euro.
Eurostat data reinforces the signal that price pressures are easing. Headline inflation in January fell to its lowest level since September 2024. Slowing inflation may reduce pressure on the ECB to tighten policy, supporting a bearish bias for the EURUSD pair in the medium term.
EURUSD technical analysis
On the daily EURUSD chart, the market is undergoing a correction after rebounding from the support level. Quotes remain within a bullish channel and above the EMA-85, indicating that the upward momentum is still intact. Within the current price structure, growth could continue towards 1.2015 as the Triangle pattern begins to play out after a rebound from the lower boundary of the bullish channel at 1.1735.
MACD analysis confirms a consolidation phase: the histogram is declining, but the slowdown in the drop may point to a near-term price reversal. A key condition for the bullish scenario this week will be price consolidation above the nearest resistance level at 1.1865, which would open the way for a breakout above the upper boundary of the Double Bottom reversal pattern.
The alternative scenario comes into play if the price breaks below the 1.1675 level, opening the door for a further decline towards 1.1545 and the resumption of a full-fledged sell-off.
EURUSD forecast scenarios
Bullish scenario (baseline): continued bullish momentum after the correction, with a target at 1.2015
Bearish scenario (alternative): if the price breaks below the 1.1675 support level, a correction may develop, with a target at 1.1545.
USDJPY forecast
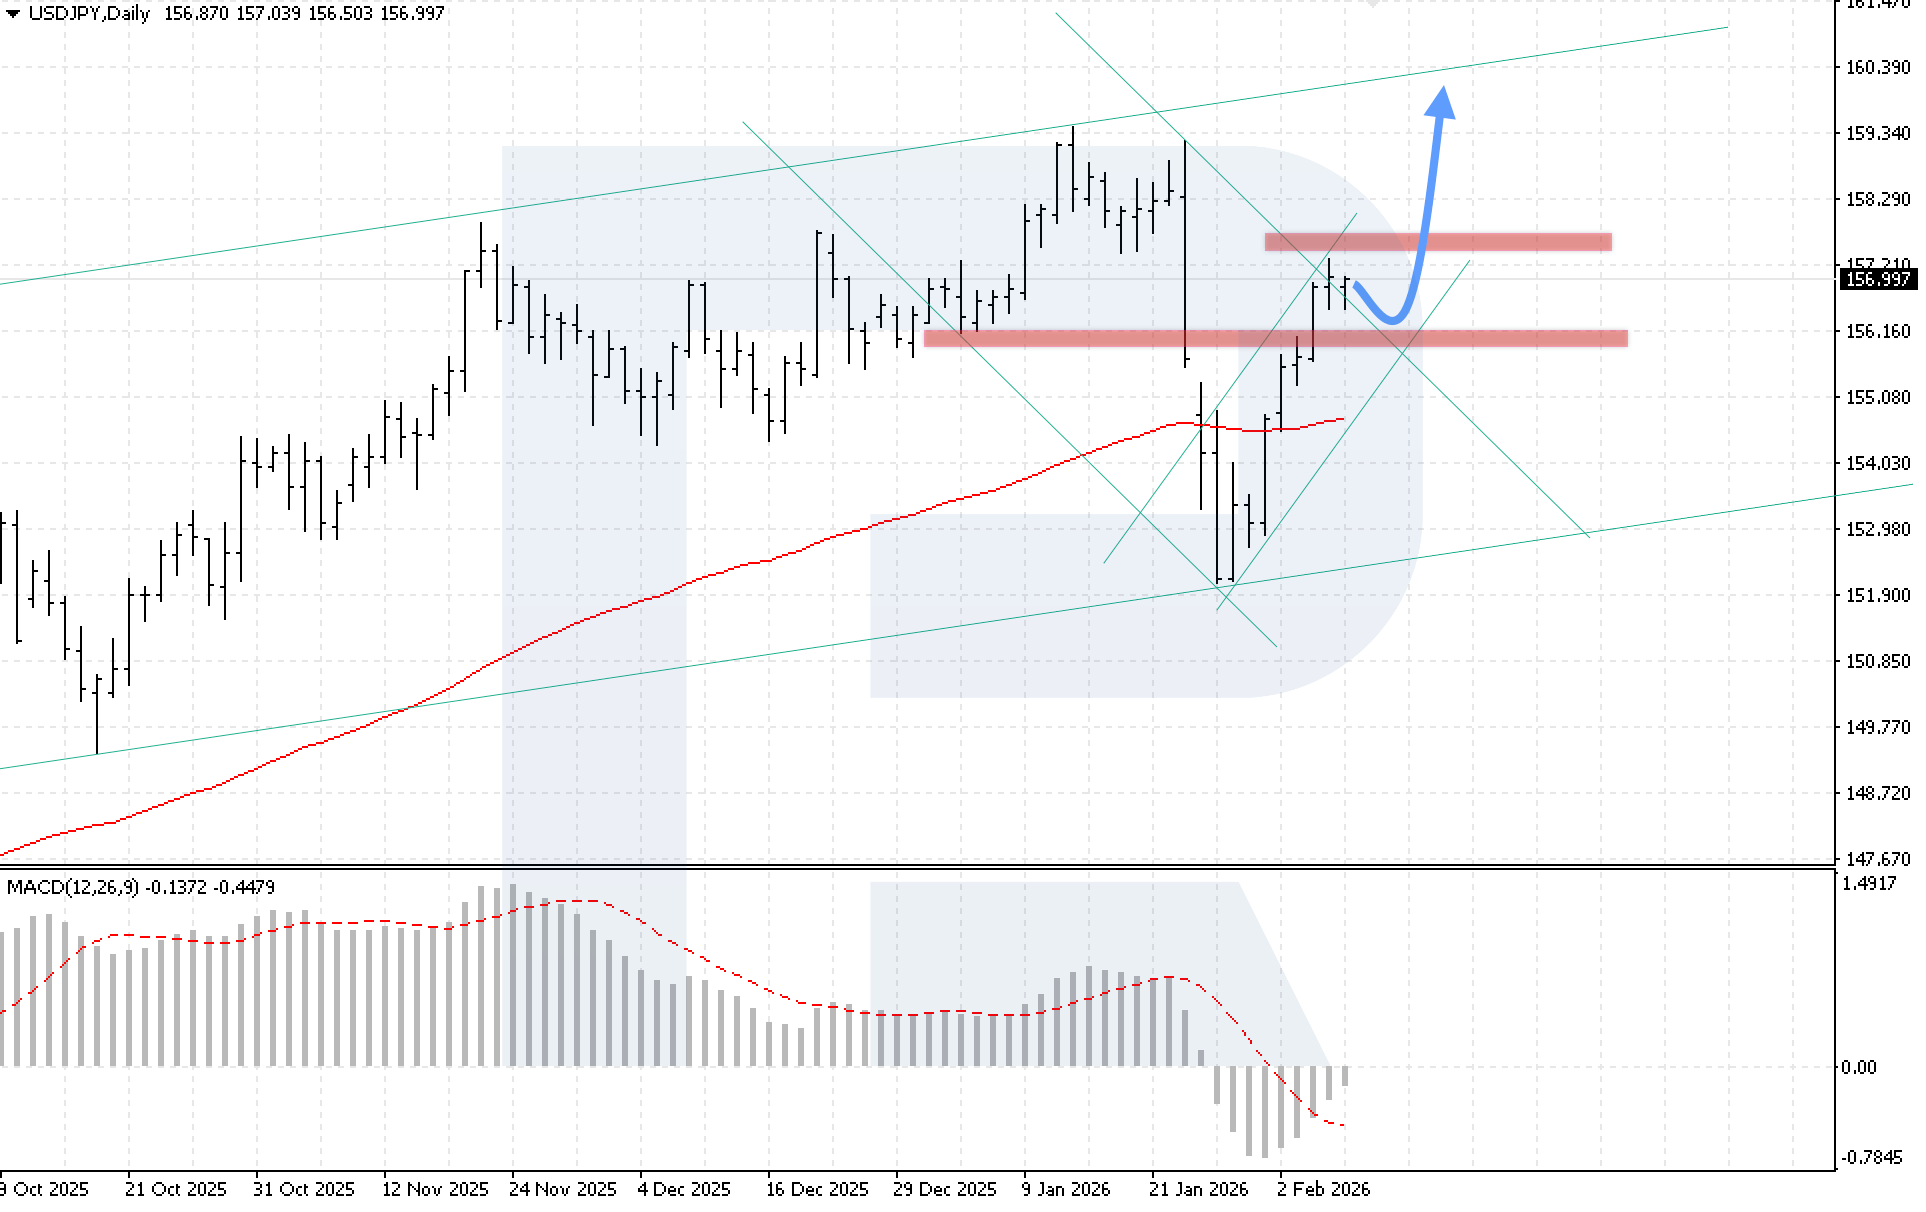
The USDJPY pair is strengthening aggressively after last week’s decline. Buyers have held the key support level at 154.35 and are already trying to consolidate above the upper boundary of the corrective descending channel, indicating a possible further growth.
The yen came under pressure amid expectations that Prime Minister Sanae Takaichi will gain voter support for higher spending and potential tax cuts. Uncertainty around how the government will finance ambitious plans and offset possible revenue losses is adding to the pressure on the market.
In addition, Takaichi noted that a weak yen may benefit exporters, later clarifying that her comments were aimed at supporting an economy capable of withstanding aggressive exchange-rate swings.
USDJPY technical analysis
On the daily USDJPY chart, the market is attempting to consolidate above the upper boundary of the corrective channel. Buyers brought quotes back above the EMA-85 fairly quickly, indicating that the uptrend in the pair remains intact. At the start of the week, there is still potential for continued growth after a rebound from the 156.25 support level, with a target at 159.85.
MACD analysis confirms the bullish scenario: the histogram is rising actively, and a bullish crossover of the signal line and the histogram points to renewed growth. A key condition for the upside scenario this week will be price consolidation above the 158.45 resistance level.
The alternative scenario comes into play if the pair breaks below the 156.05 level, signalling a return to the bearish channel with a possible decline towards the EMA-85.
USDJPY forecast scenarios
Bullish scenario (main): a rebound from the 156.25 support level will open the potential for bullish momentum, with a target at 159.85.
Bearish scenario (alternative): if quotes fall and break below 156.05, the probability of a downward correction will increase, with a target at 154.05.
GBPUSD forecast
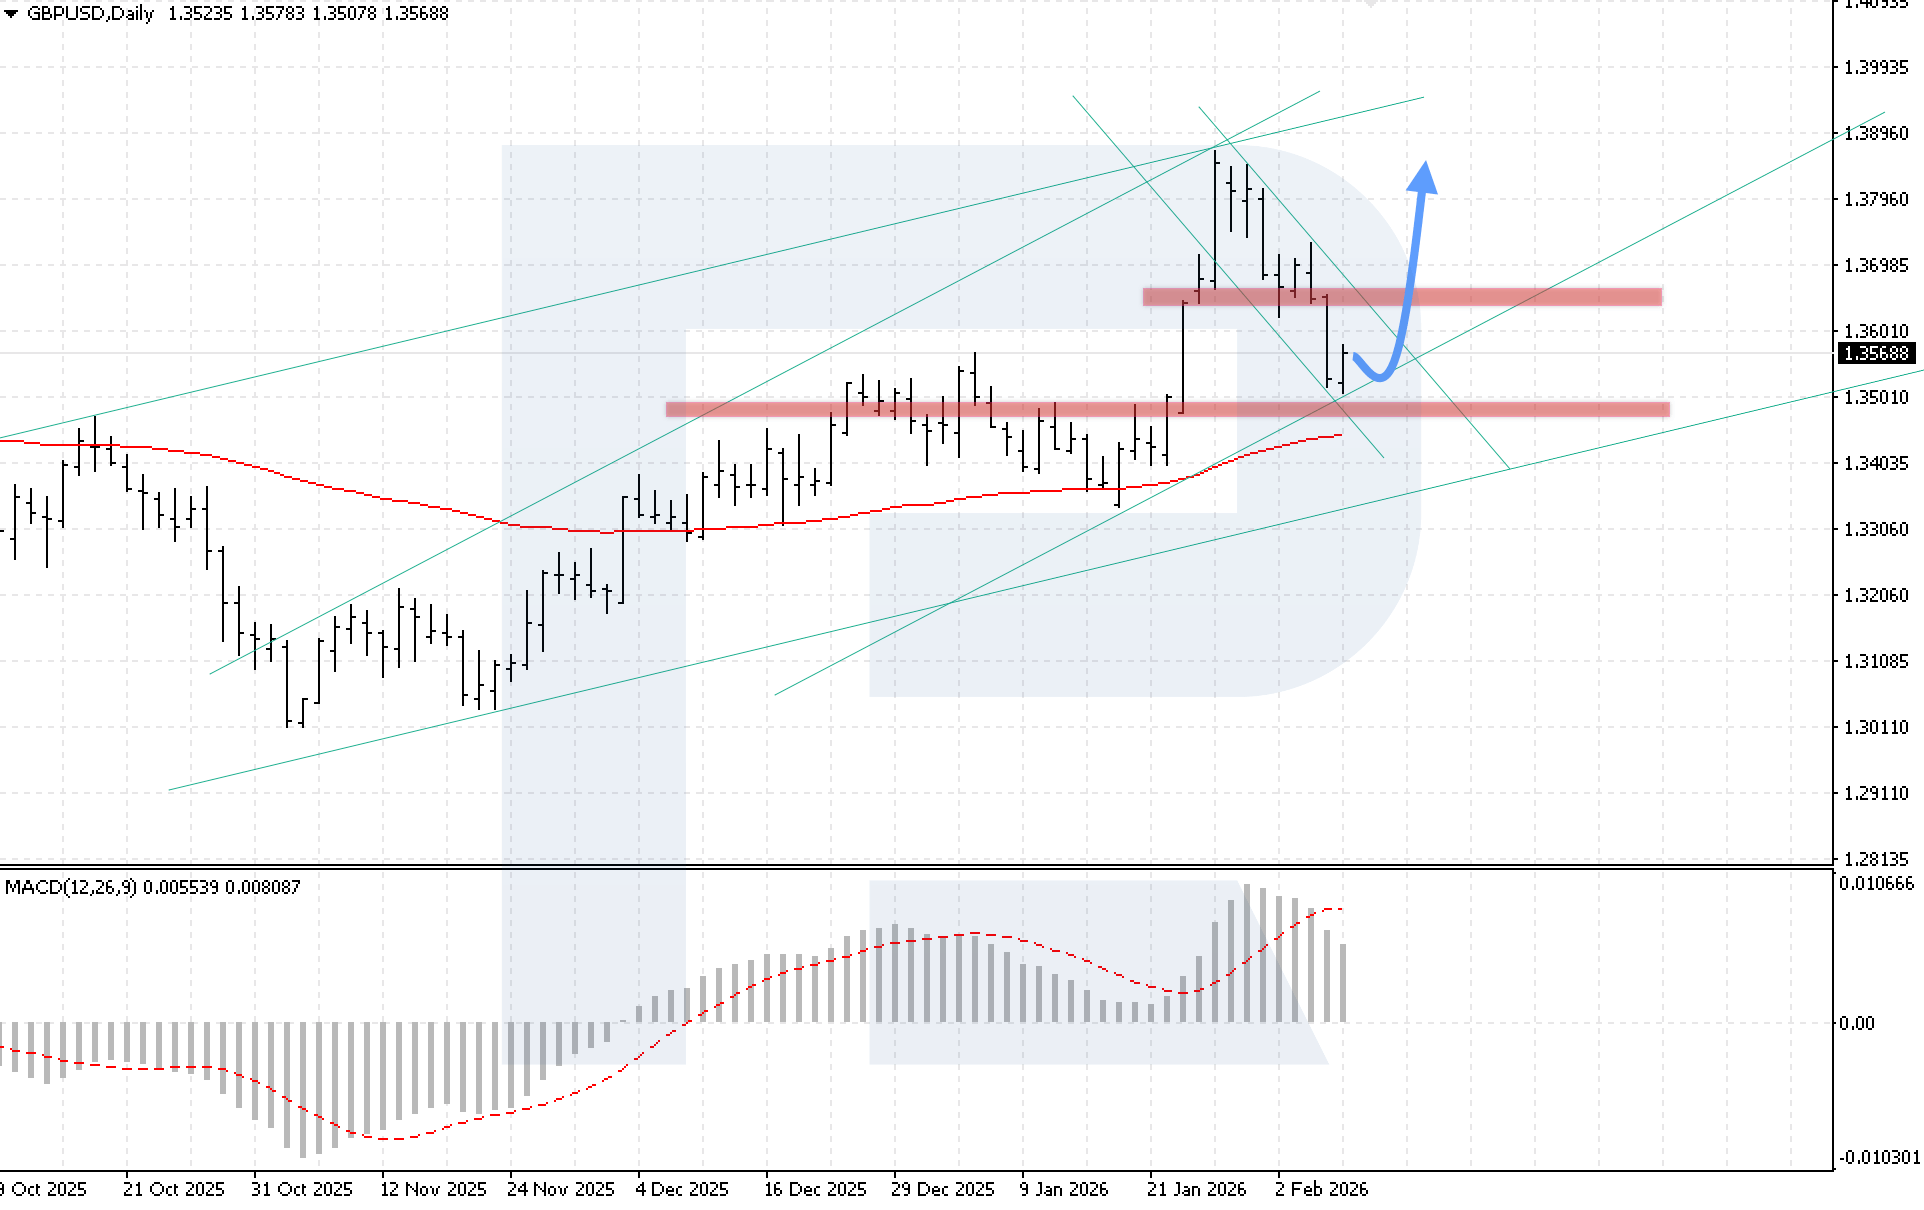
Although the GBPUSD rate declined, buyers are holding quotes above the key support level at 1.3520, indicating that the uptrend remains intact despite the current correction. The British pound came under pressure after the BoE held interest rates steady at 3.75%, taking a more dovish stance than the market expected.
Four members of the Monetary Policy Committee voted for an immediate 25-basis-point rate cut, noting that consumer price inflation is expected to return to the 2% target as early as April. The regulator also stressed that the risks of persistent inflation continue to ease, while risks of an economic slowdown linked to weakening demand and the labour market are becoming increasingly pronounced.
GBPUSD technical analysis
On the daily GBPUSD chart, the market continued to decline, but buyers held quotes within the ascending channel. The price briefly slipped below the key support level while remaining in an area of buying interest, reducing the risk of a full-fledged trend reversal. At the start of the trading week, the GBPUSD pair still has the potential to rise after rebounding from the lower boundary of the channel, with a target at 1.3825.
MACD analysis confirms a correction phase: the histogram is declining, but buyer activity that neutralised the bearish divergence forms a strong signal in favour of the bullish trend continuing. A key condition for the upside scenario this week will be price consolidation above 1.3665.
The alternative scenario becomes relevant if the lower boundary of the channel is broken and the price consolidates below 1.3465, opening potential for a decline towards 1.3305.
GBPUSD forecast scenarios
Bullish scenario (main): if the price rebounds from the lower boundary of the bullish channel, the upward structure is expected to continue with a target at 1.3825.
Bearish scenario (alternative): a decline below 1.3585 and 1.3465 will cancel the rally scenario and trigger a bearish correction.
AUDUSD forecast
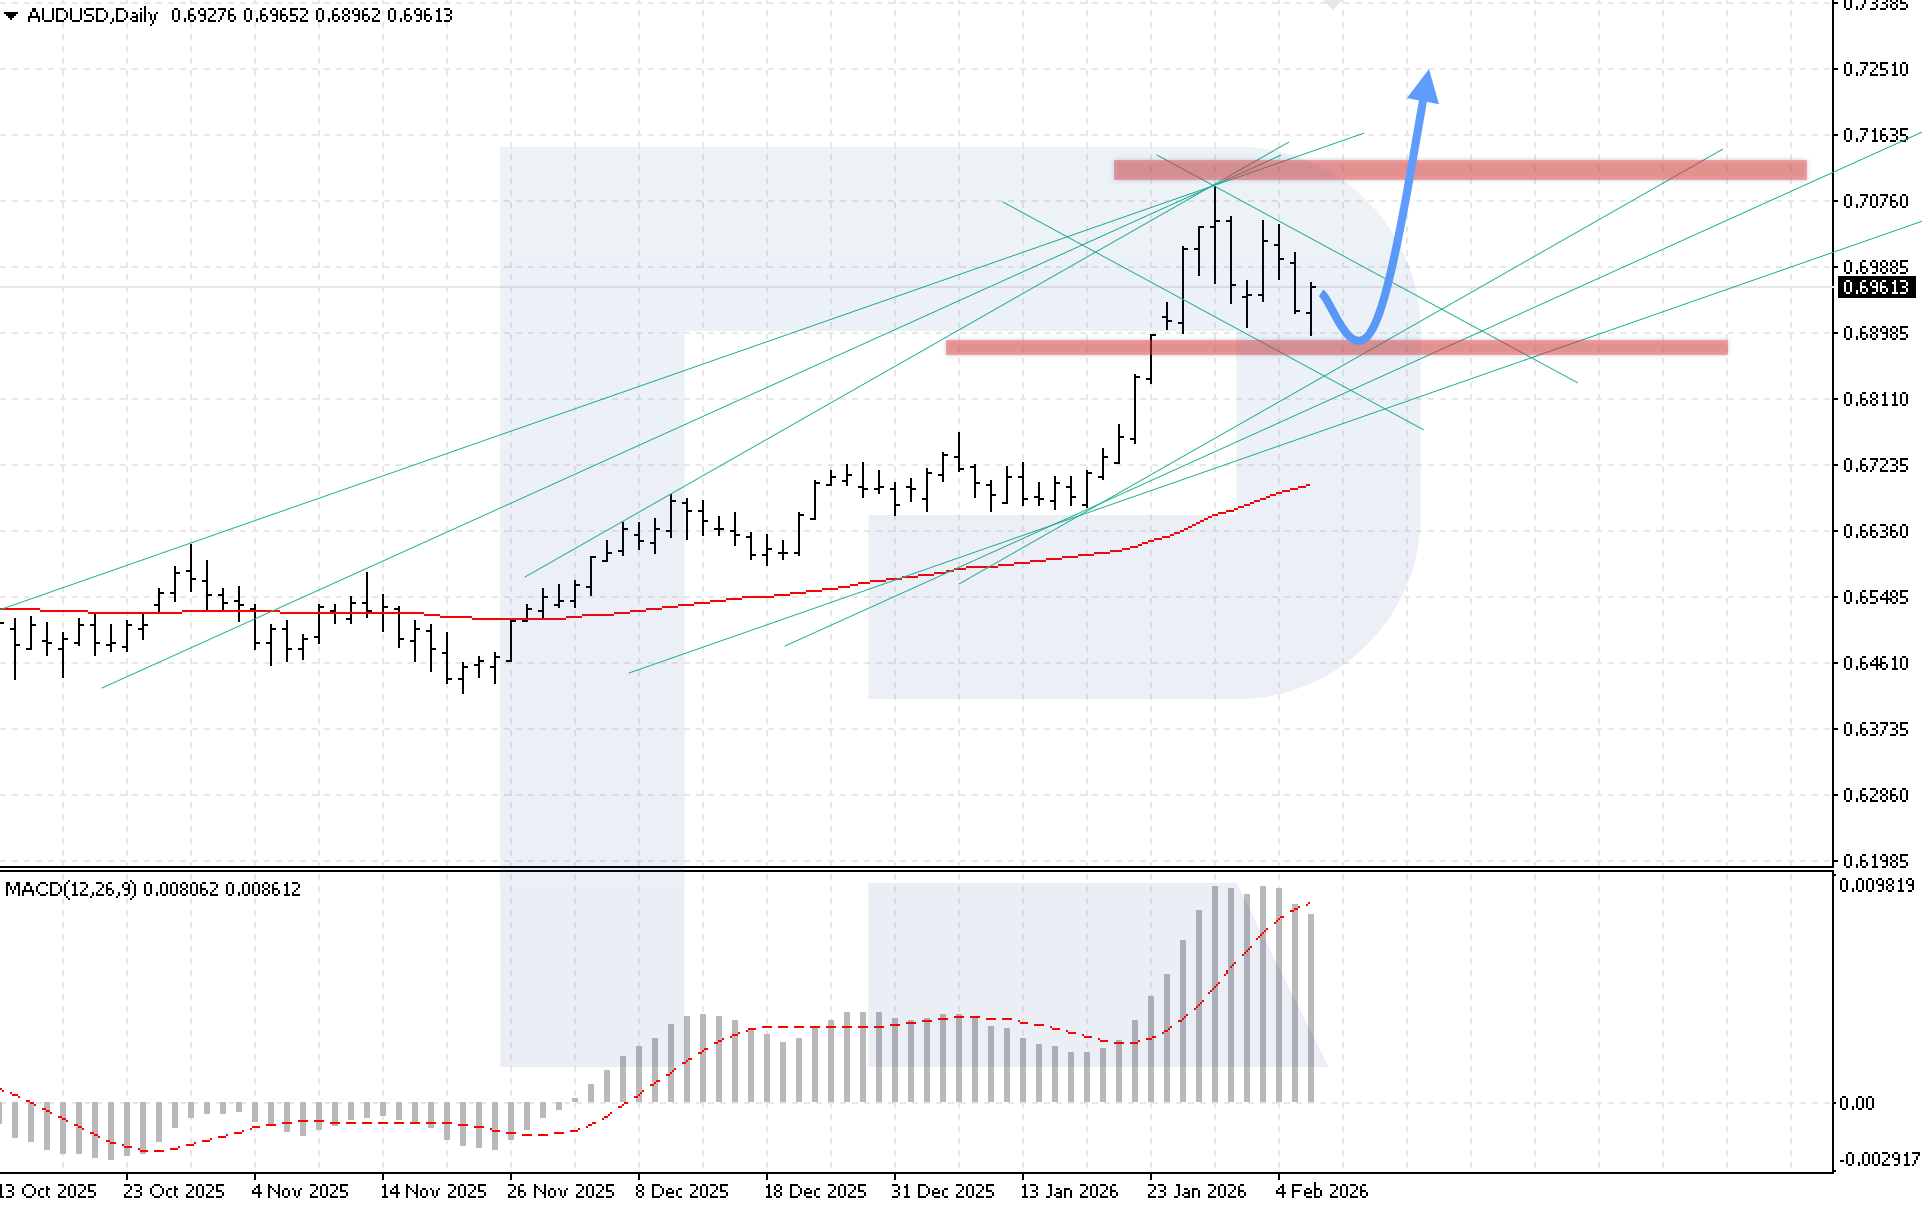
The AUDUSD rate has been rising for the fifth consecutive week. Despite corrective pullbacks, buyers quickly return to the market, building new long positions and pushing quotes further higher. Additional short-term pressure on the Australian dollar emerged amid a sell-off in global equity markets. Earlier, the Reserve Bank of Australia raised the interest rate by 25 basis points and signalled readiness to further tighten policy if inflation remains persistent, which continues to provide fundamental support for the AUDUSD pair.
Market expectations reflect this bias. Investors estimate the likelihood of a 25-basis-point hike in May to 4.10% at around 70% and the probability of a 50-basis-point increase by year-end at about 50%. At the same time, pressure on the Australian dollar persists. A broad sell-off in equities, commodities, and cryptocurrencies increased demand for safe-haven assets, strengthening the US dollar and limiting AUDUSD upside in the short term.
AUDUSD technical analysis
On the daily AUDUSD chart, quotes are bouncing from the key support level at 0.6885. At the start of the trading week, there remains potential for the uptrend to continue towards 0.7255 after rebounding from this support.
MACD analysis confirms a correction phase. The histogram is declining after reaching a peak, but the pace of the decline is slowing. Bulls neutralised the formation of a bearish divergence, indicating the strength of the current AUDUSD trend. A key condition for the bullish scenario is price consolidation above 0.7035. This level is the upper boundary of the descending corrective channel. A breakout would confirm the end of the correction phase and open the way towards 0.7255.
The alternative scenario will come into play if the 0.6775 support level is broken. This would mean consolidation below the lower boundary of the bullish channel and create conditions for further declines towards 0.6705.
Text 12
Bullish scenario (baseline): a breakout above the upper boundary of the descending corrective channel with consolidation above 0.7035 would enable continued growth towards 0.7255.
Bearish scenario (alternative): a breakout below the key support level with consolidation below 0.6775 would generate a signal for a decline and a bearish correction in the pair.
USDCAD forecast
The USDCAD rate is strengthening after a phase of active declines. Buyers are holding quotes above the key support level at 1.3625, forming a technical base for recovery. The pair pulled back from 16-month highs amid weakening signs of domestic economic growth in Canada and falling oil prices. These factors coincided with renewed US dollar strength, shifting the short-term balance in favour of a bullish USDCAD scenario.
The rise intensified after the release of macroeconomic data. Canada’s GDP in November remained flat, while goods production contracted for the third time in the past four months. Weakness in manufacturing points to a persistent supply overhang and low inflationary pressure in the economy. This trend reinforced expectations that the Bank of Canada will maintain a wait-and-see stance and will not shift to a more hawkish policy.
USDCAD technical analysis
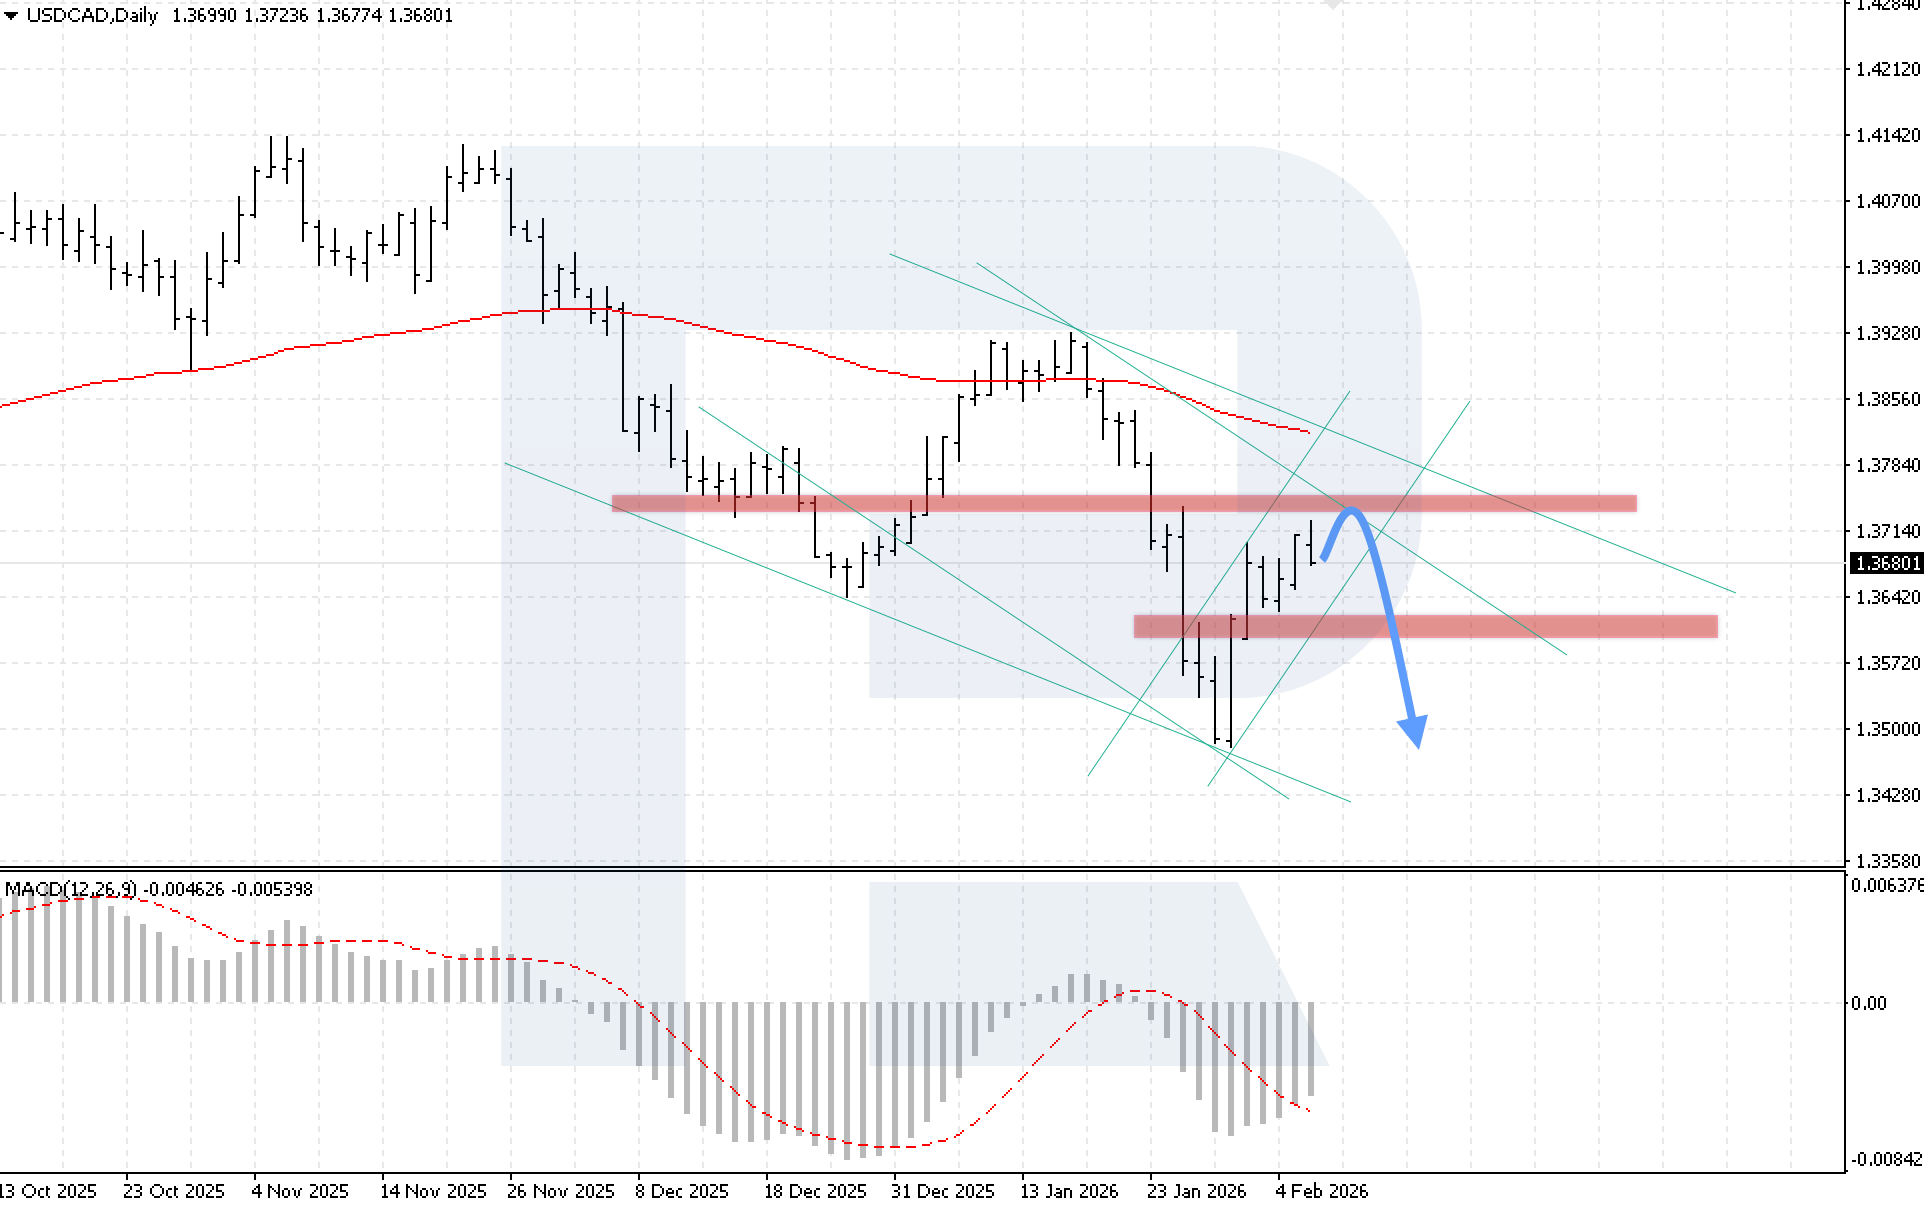
On the daily USDCAD chart, quotes are correcting within a bullish channel and have reached the key resistance level at 1.3735. The nearest support lies at 1.3605. At the start of the trading week, there is a high probability of a rebound from this resistance and a transition into a decline towards 1.3485, which corresponds to a correction phase within the uptrend.
MACD analysis confirms prevailing buying pressure. Although the histogram continues to rise, slowing momentum near the resistance zone indicates weakening impulse, creating conditions for a corrective reversal. A key condition for the downside scenario this week will be price consolidation below 1.3615. Such a signal would confirm a breakout below the lower boundary of the bullish corrective channel and increase selling pressure.
The alternative scenario will come into play if the price breaks above the 1.3785 resistance level, indicating a move above the upper boundary of the descending channel and opening the potential for continued growth towards 1.4075.
USDCAD forecast scenarios
Bearish scenario (main): if quotes consolidate below 1.3615, a full-fledged bearish momentum is expected to resume with a target at 1.3485.
Bullish scenario (alternative): if the price breaks above the upper boundary of the descending channel and consolidates above 1.3785, the market will receive a signal for an upward move to develop.
XAUUSD forecast
XAUUSD prices are rising after rebounding confidently from the strong support level at 4,395. Despite the deep correction, the medium-term trend in gold remains firmly upward. In the current phase, bulls are trying to regain control of the market and return to testing the key resistance level at 5,005.
The fundamental backdrop also supports higher gold prices. US job cuts in January reached the highest level for the month since 2009. At the same time, initial jobless claims rose to 231 thousand, and ADP employment data came in worse than expected. A series of weak labour market signals fuelled expectations of Fed policy easing.
Markets are increasingly pricing in rate cuts towards the end of this year, with the first step expected as early as June. Softer expectations for restrictive Fed policy are creating a favourable environment for XAUUSD gains.
XAUUSD technical analysis
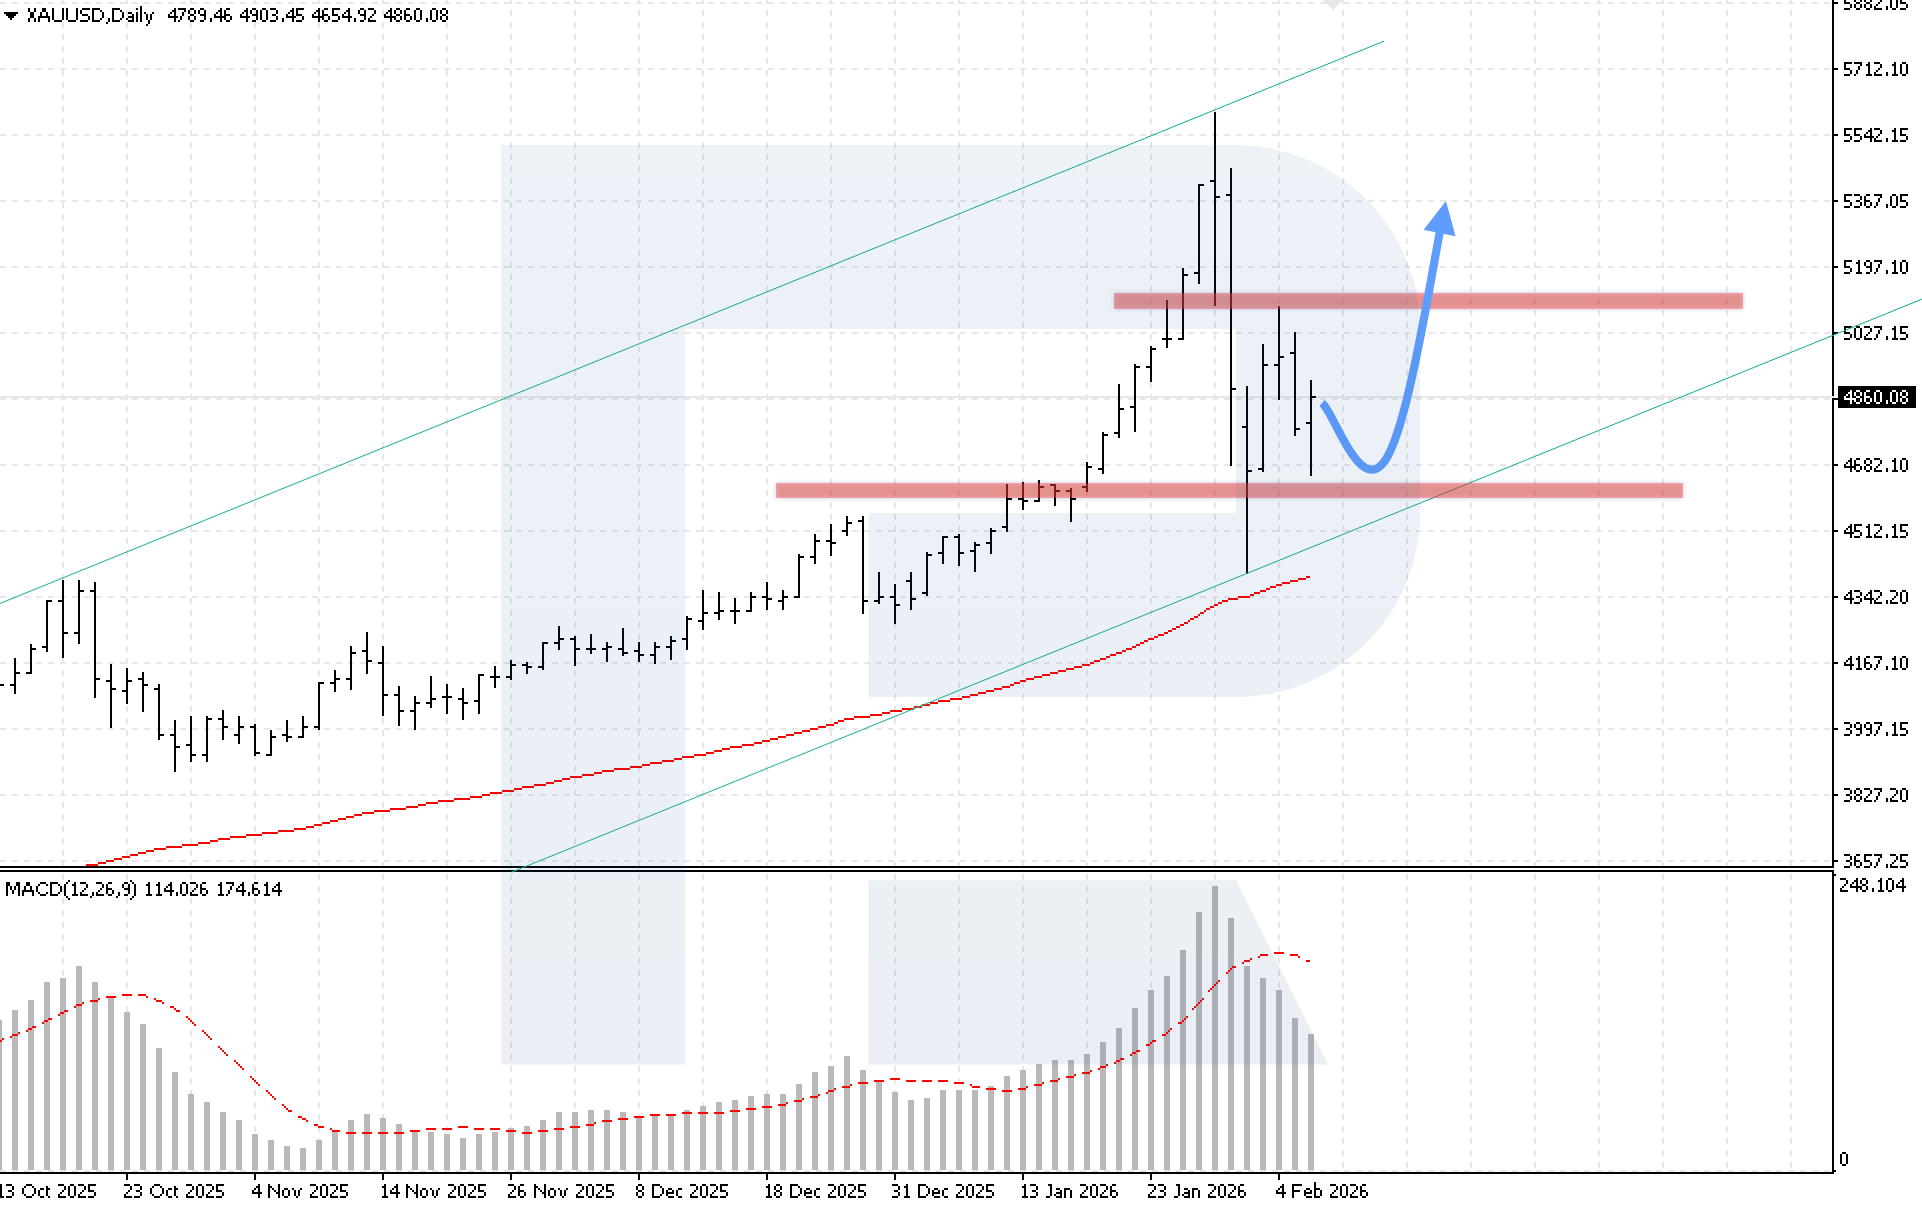
On the daily XAUUSD chart, quotes are rising after repeatedly testing the key support zone. Prices remain within a bullish channel and continue to trade above the EMA-85, confirming that the medium-term uptrend remains intact. The key resistance level is formed at 5,125 USD. At the start of the trading week, quotes could rebound from the channel’s lower boundary and resume the uptrend, with the first target at 5,365 USD.
MACD analysis points to a correction phase. The histogram has started to decline moderately, but the pace is slowing, signalling sellers’ weakness and the formation of conditions for growth to resume. A key condition for the bullish scenario this week will be price consolidation above 5,125 USD. This would confirm a breakout above the upper boundary of the Double Bottom reversal pattern and unlock the potential for accelerating upward momentum.
The alternative scenario will be activated if prices break below the support level and consolidate below 4,425 USD, signalling a breakout below the lower boundary of the long-term bullish channel and triggering a deeper and more aggressive correction in the gold market.
XAUUSD forecast scenarios
Bullish scenario (main): the potential for the bullish trend to continue remains, with a target at 5,365 USD.
Bearish scenario (alternative): a firm consolidation below 4,425 USD would open the door for a further decline in gold prices.
Brent forecast
At the end of last week, Brent quotes dipped moderately amid easing risks of potential supply disruptions in the Middle East. Geopolitical tensions in the region partially eased, weakening support for oil prices. Buyers are attempting to gain a foothold above the key resistance level at 69.55, but attempts to break above this zone have been unsuccessful. A breakout would be a technical signal for the uptrend to continue with a target around 77.80.
At the same time, investors remain cautious ahead of the outcome of US-Iran nuclear talks. The US insists on a broader agenda, while Iran demands the dialogue focus exclusively on the nuclear programme and sanctions relief, keeping uncertainty high. An additional source of tension was a statement by the US embassy in Iran urging US citizens to leave the country immediately. In similar situations in the past, such signals have typically led to higher oil prices by boosting the geopolitical premium in Brent.
Brent technical analysis
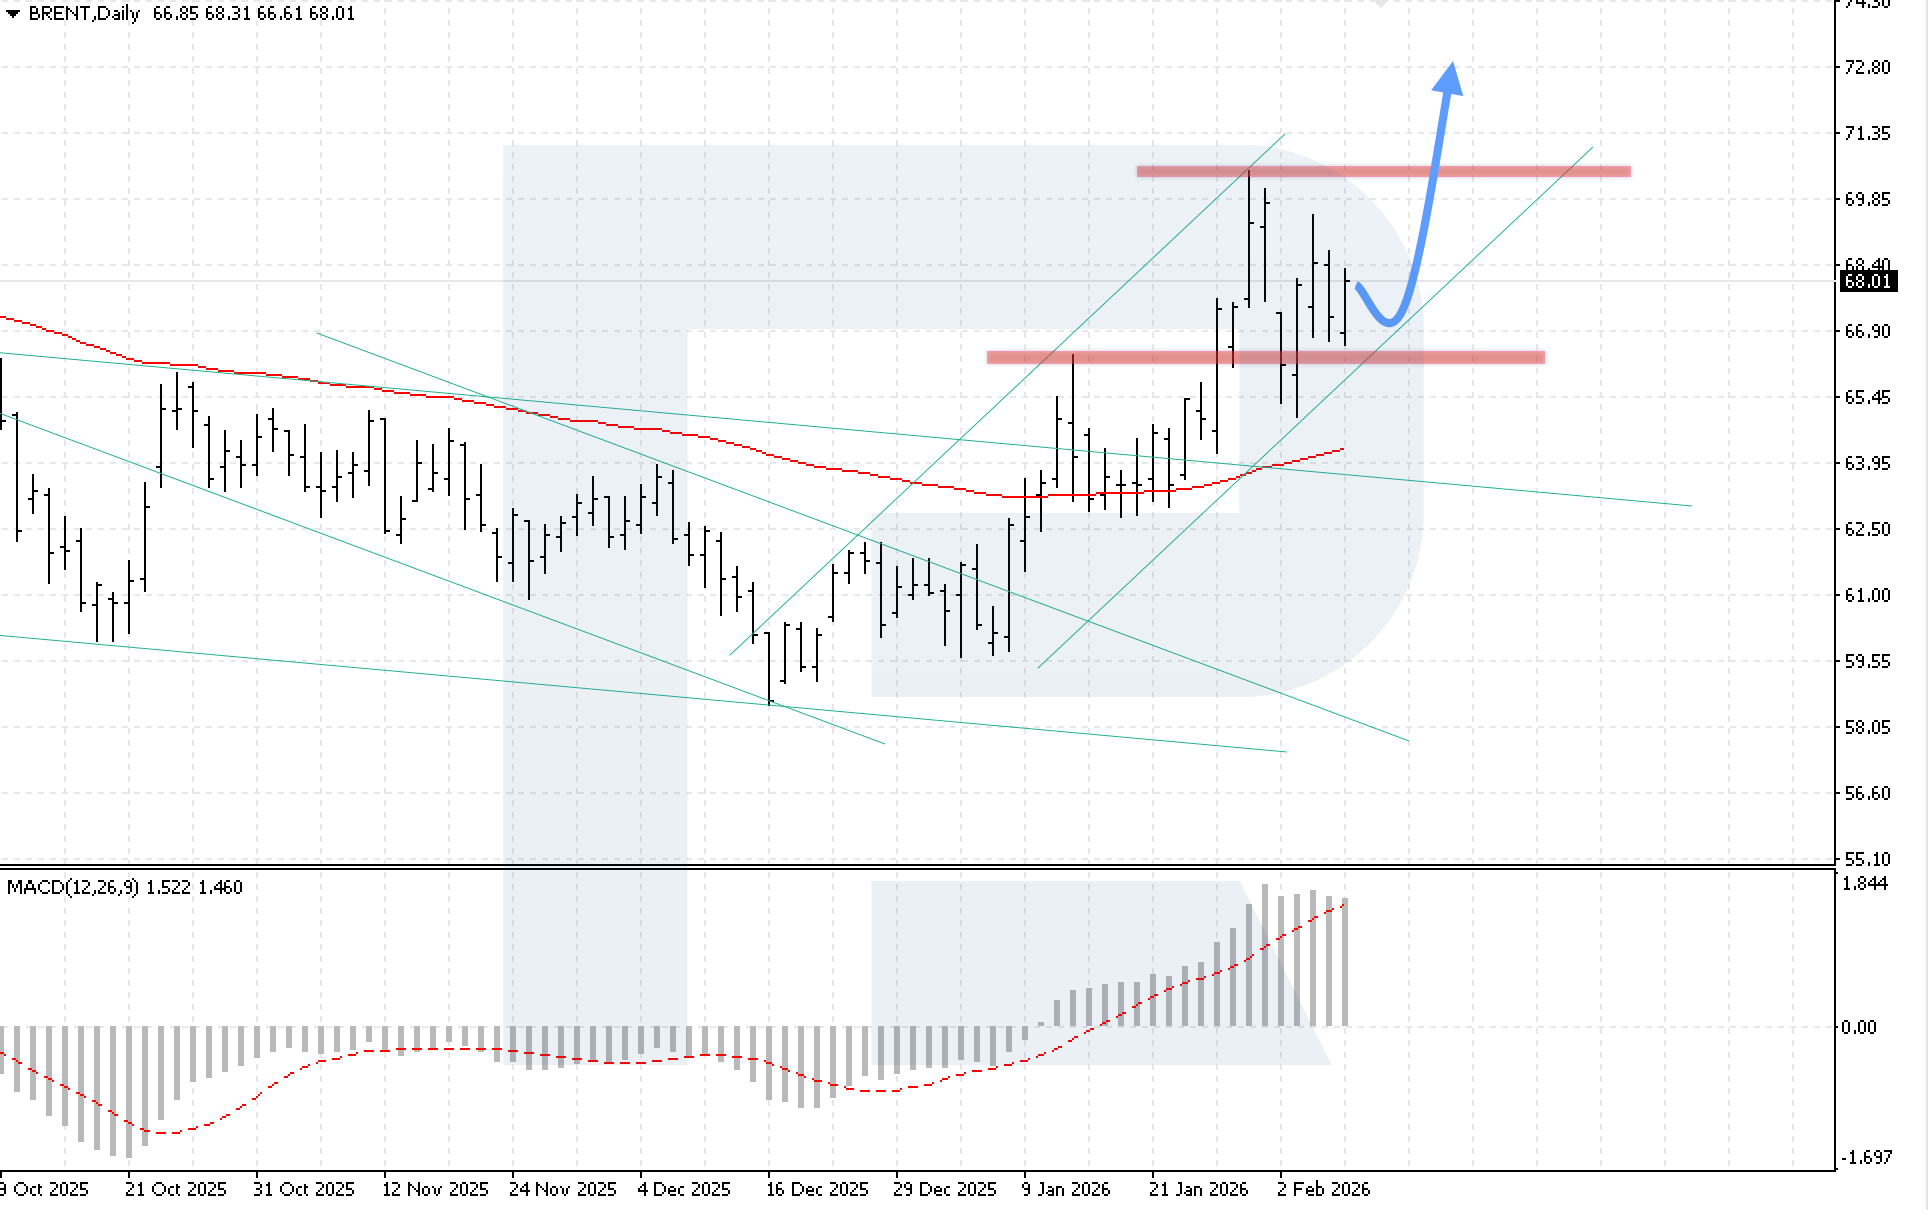
On the daily Brent chart, quotes continue to rise within a bullish channel. Buyers confidently held the 66.45 USD level, preventing a breakout lower, indicating that the upward momentum remains strong. The nearest key resistance level is located at 69.95 USD. As part of the current forecast, Brent retains the potential to resume growth with a target at 72.85 USD.
The MACD indicator confirms that the bullish trend dominates. The histogram resumed growth after a slowdown phase that reflected market consolidation, indicating buyers’ dominance and recovering momentum. A key condition for the bullish scenario this week will be price consolidation above 69.95 USD.
The bearish scenario will be activated if quotes break below the support level and consolidate below 65.35 USD, signalling that prices are moving below the lower boundary of the bullish channel and triggering a deeper corrective wave in the oil market.
Brent forecast scenarios
Bullish scenario (main): a quick breakout above the key resistance level and consolidation above 69.95 USD would open the door for the continued bullish momentum towards 72.85 USD.
Bearish scenario (alternative): if bearish pressure increases and the lower boundary of the bullish channel is broken with consolidation below 65.35 USD, the decline should be expected to resume.
Editors’ picks
 EURUSD 2026-2027 forecast: key market trends and future predictions
This article provides the EURUSD forecast for 2026 and 2027 and highlights the main factors determining the direction of the pair’s movements. We will apply technical analysis, take into account the opinions of leading experts, large banks, and financial institutions, and study AI-based forecasts. This comprehensive insight into EURUSD predictions should help investors and traders make informed decisions.
 Gold (XAUUSD) forecast 2026 and beyond: expert insights, price predictions, and analysis
Dive deep into the Gold (XAUUSD) price outlook for 2026 and beyond, combining technical analysis, expert forecasts, and key macroeconomic factors. It explains the drivers behind gold’s recent surge, explores potential scenarios including a move toward 4,500 to 5,000 USD per ounce, and highlights why the metal remains a strong hedge during global uncertainty.
Forecasts presented in this section only reflect the author’s private opinion and should not be considered as guidance for trading. RoboForex bears no responsibility for trading results based on trading recommendations described in these analytical reviews.