Weekly technical analysis and forecast (27 April–1 May 2026)
In this weekly technical analysis, we review key chart patterns and price levels for EURUSD, USDJPY, GBPUSD, AUDUSD, USDCAD, gold (XAUUSD), and Brent crude oil — and outline the most probable scenarios for the week of 27 April–1 May 2026.
Major technical levels to watch this week
EURUSD forecast for 27 April–1 May 2026
BearishEURUSD fundamental outlook
The fundamental backdrop for EURUSD continues to favour the US dollar heading into the new week. The European Central Bank has adopted a cautious stance as inflation in the eurozone decelerates and economic activity remains subdued. ECB officials have signalled a wait-and-see approach while assessing the cumulative effect of previous rate decisions, and markets are not pricing in any imminent policy shift from Frankfurt.
On the other side of the Atlantic, the US Federal Reserve maintains hawkish rhetoric. Inflation remains above the 2% target and the labour market continues to show resilience, giving the Fed little reason to pivot. Elevated US Treasury yields provide direct support to the dollar, attracting capital flows away from lower-yielding European assets.
This monetary policy divergence — a cautious ECB against a firm Fed — is the primary structural driver keeping pressure on the euro. Unless eurozone macro data surprise materially to the upside or Federal Reserve communication turns dovish, the fundamental bias remains tilted towards further EURUSD weakness in the medium term.
Key driver this week: Watch US labour market data and any Fed commentary. A stronger-than-expected NFP print or hawkish Fed minutes would reinforce dollar strength and add momentum to the bearish EURUSD scenario.
EURUSD technical analysis
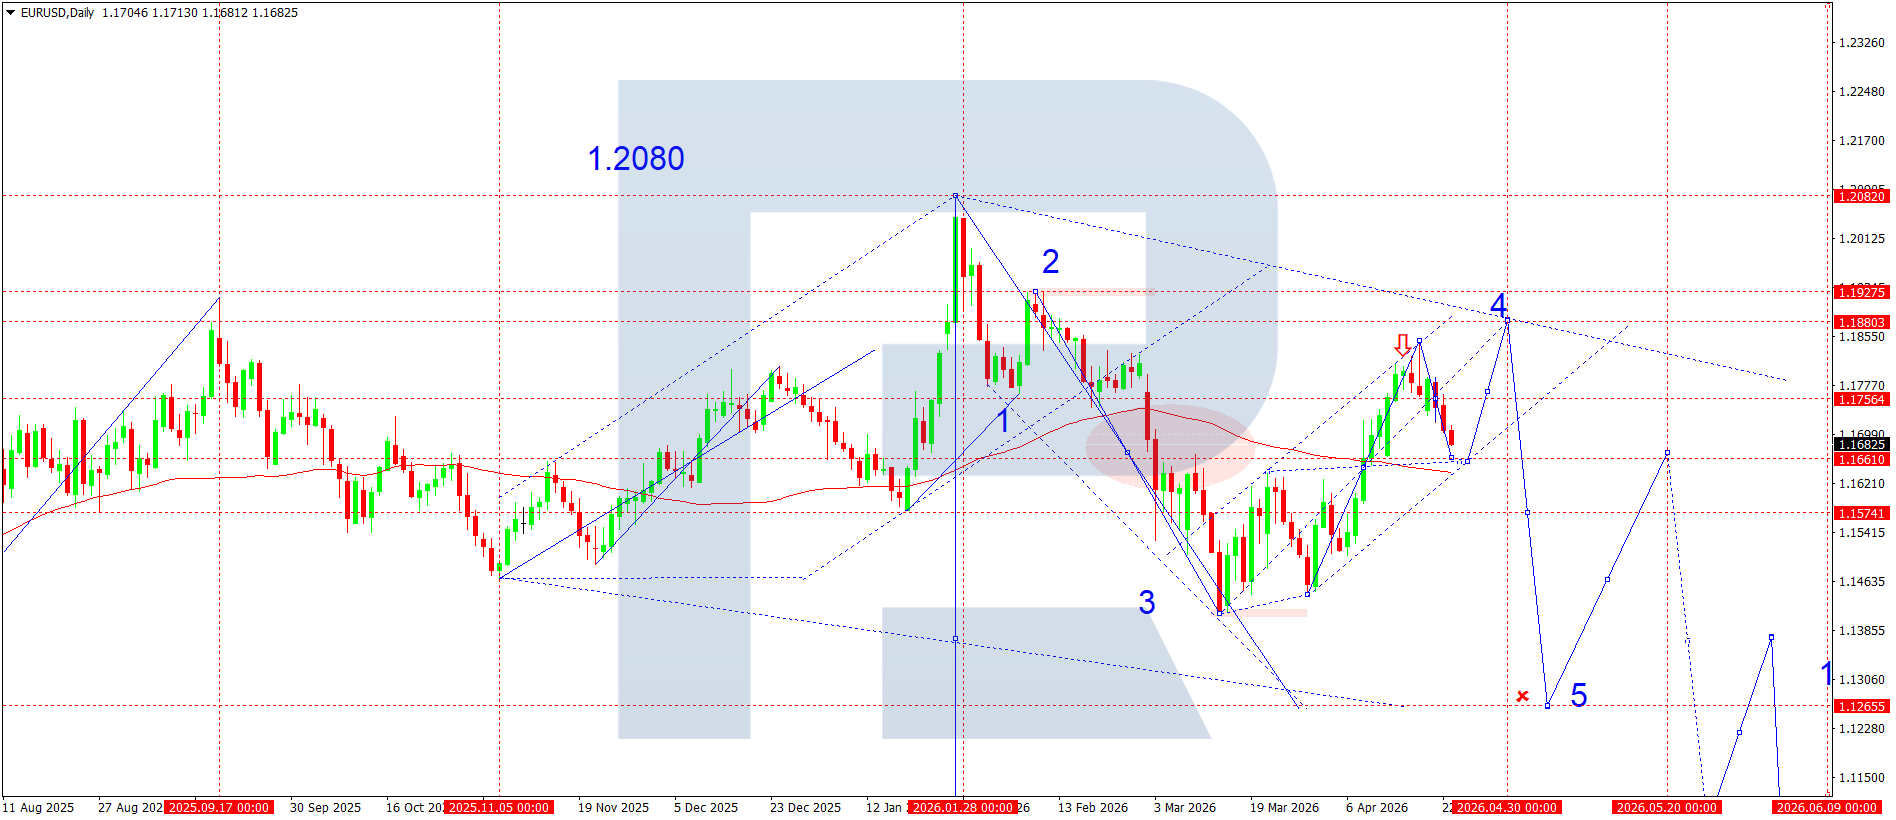
On the daily chart, price action is consistent with a well-defined descending channel that has been in place since the peak near 1.2080. After completing what appears to be a corrective wave near 1.1756, the pair has begun pulling back towards the 1.1660 area — a zone where the moving average and a previously broken structure level converge, making it a critical decision point for the week ahead.
The sequence of lower highs since the 1.1880 test is characteristic of a distribution pattern, indicating that rallies are being sold into rather than sustained. The 1.1756 level has proven to be firm resistance: each approach has been met with renewed selling pressure, and the price reaction there confirms that sellers remain in control below this threshold.
From a wave-count perspective, the structure suggests that wave 5 of the current impulsive decline is developing, with a target projection near 1.1265 — the lower boundary of the descending channel. An intermediate pause is probable around 1.1574, where prior support is still visible on the chart.
The alternative scenario should not be dismissed entirely. A short-term recovery from the 1.1660 zone could carry price back to retest the 1.1756–1.1880 supply area, particularly if risk sentiment improves or US data disappoints. However, this would remain a corrective move within the broader downtrend rather than a reversal, unless price closes convincingly above 1.1880 on a daily basis.
Price breaks below 1.1660, tests 1.1574 as intermediate support, and extends the impulse toward the channel target at 1.1265. Sellers retain control below 1.1756.
Bounce from 1.1660 carries price back to retest the 1.1756–1.1880 supply zone. Corrective in nature; does not negate the medium-term downtrend unless 1.1880 is closed above.
USDJPY forecast for 27 April–1 May 2026
BullishUSDJPY fundamental outlook
The key driver for USDJPY remains the divergence in monetary policy between Washington and Tokyo. The Federal Reserve maintains a cautiously hawkish tone despite signs of slowing inflation, which keeps US Treasury yields at relatively elevated levels and supports the dollar across the board.
At the same time, the Bank of Japan continues to follow a loose monetary policy despite a gradual rise in domestic inflation pressure. Comments from BoJ officials indicate a clear reluctance to tighten financial conditions quickly, which maintains structural yen weakness. Stable demand for the dollar as a safe-haven asset amid persistent geopolitical risks and global economic uncertainty adds an additional supportive layer for USDJPY buyers.
The fundamental bias therefore remains in favour of the dollar, although market participants are increasingly pricing in the probability of corrective moves given how extended the pair has become. Any surprise hawkish signal from the BoJ would be the most significant upside risk for the yen in the near term.
Key driver this week: Bank of Japan policy communication and any surprise from Japanese CPI data. A shift in BoJ tone — even modest — could trigger sharp short-covering in the yen and push USDJPY toward the 157.20 support.
USDJPY technical analysis
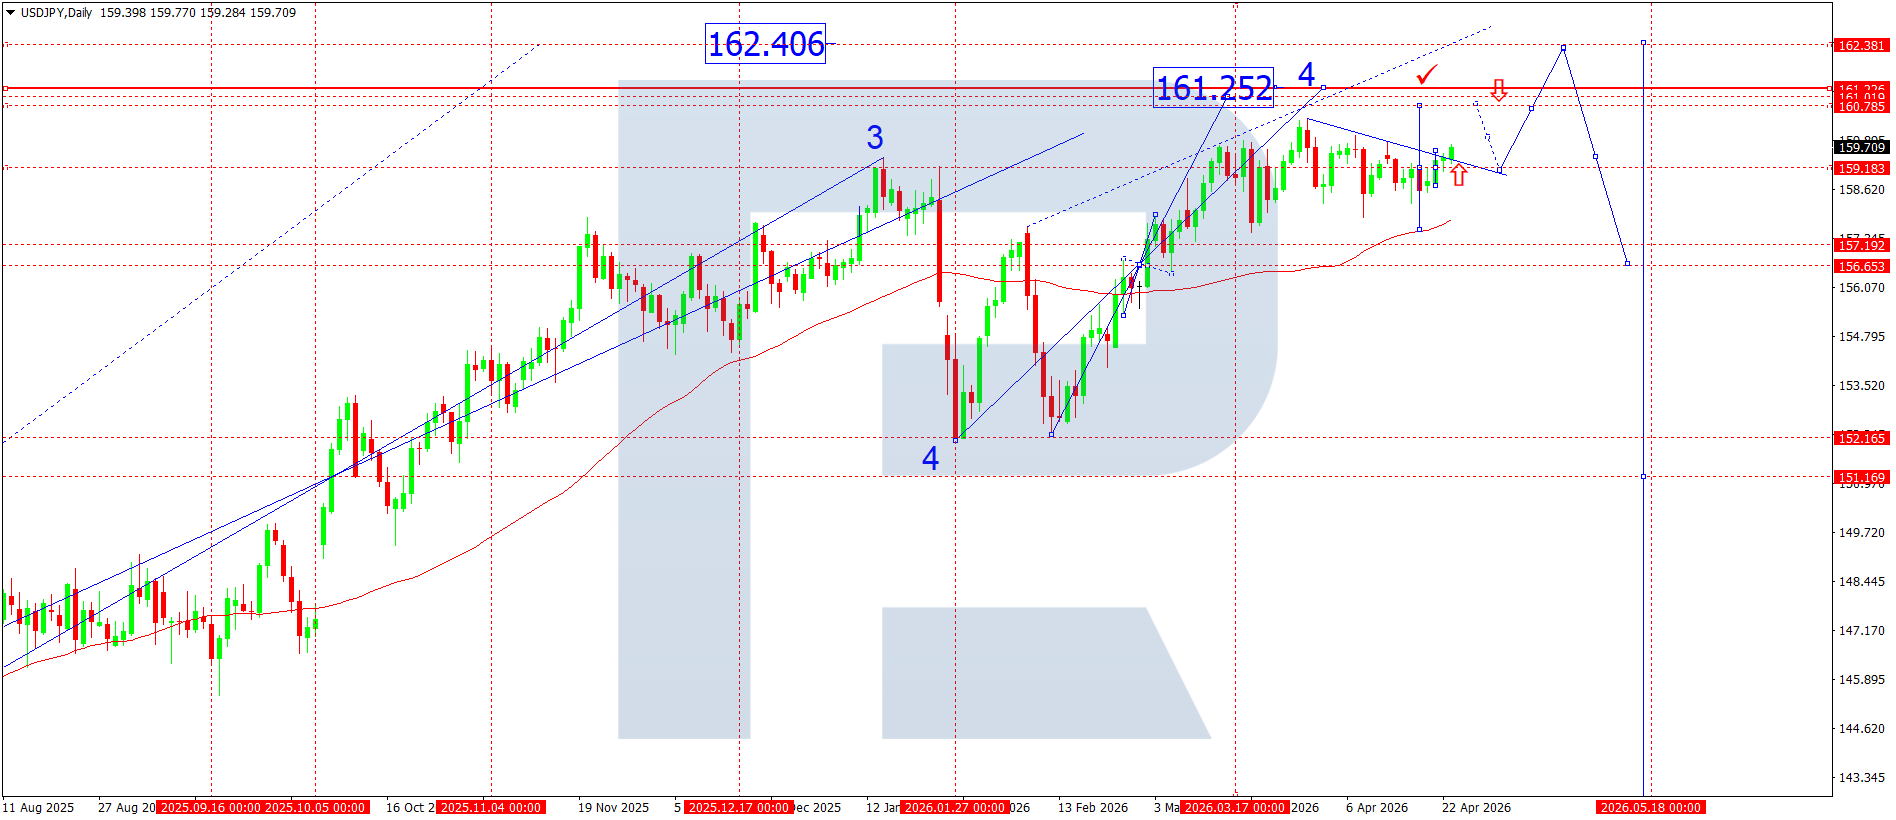
On the daily chart, the ascending structure remains intact, with a clearly defined impulsive wave sequence. Wave 3 was completed near 161.25, after which the market entered a correction phase, forming wave 4 as a sideways consolidation range. The current dynamics point to range compression below the key resistance level, while the price is holding above the ascending trendline and the moving average — confirming that the medium-term uptrend remains intact.
The 160.70–161.25 area acts as a strong resistance zone where profit-taking has occurred on previous approaches. At the same time, the local structure shows a narrowing range, which often precedes an impulsive breakout. The potential completion of wave 4 creates conditions for the start of wave 5, with targets near 162.40 and above — coinciding with the upper boundary of the expanding channel.
On the other hand, failure to consolidate above 160.70 may deepen the correction. A breakout below the local support at 159.20 will increase downside pressure and open the way for a test of 157.20, where more significant support and buyer interest are located. It is important to note that any such correction would remain technical in nature and would not disrupt the main trend structure.
Wave 4 correction completes; price breaks above 160.70 and resumes the uptrend toward 161.25, then 162.40. Medium-term structure remains intact above 159.20.
Failure to hold 159.20 deepens the pullback toward 157.20 and potentially 156.60. Does not invalidate the broader uptrend but extends the corrective phase.
GBPUSD forecast for 27 April–1 May 2026
BearishGBPUSD fundamental outlook
The fundamental backdrop for GBPUSD is shaped by competing expectations around monetary policy and macroeconomic data from both the US and the UK. The market continues to reassess the Fed's rate path, with cautious rhetoric persisting amid slowing inflation but a resilient US labour market — a combination that keeps the dollar bid.
On the UK side, the Bank of England faces weaker economic dynamics, which limits the scope for maintaining tight policy over an extended horizon. The latest UK business activity data points to slowing growth, placing additional pressure on the pound. Fluctuations in US Treasury yields, which have remained elevated, continue to support the dollar as the dominant safe-haven currency.
Overall, the fundamental balance is tilted towards moderate dollar strengthening against the pound, though short-term corrections remain possible around key data releases and ahead of position-squaring.
Key driver this week: UK PMI and any Bank of England commentary. Weaker-than-expected UK business activity data would add fundamental weight to the bearish scenario and could accelerate a move below 1.3436.
GBPUSD technical analysis
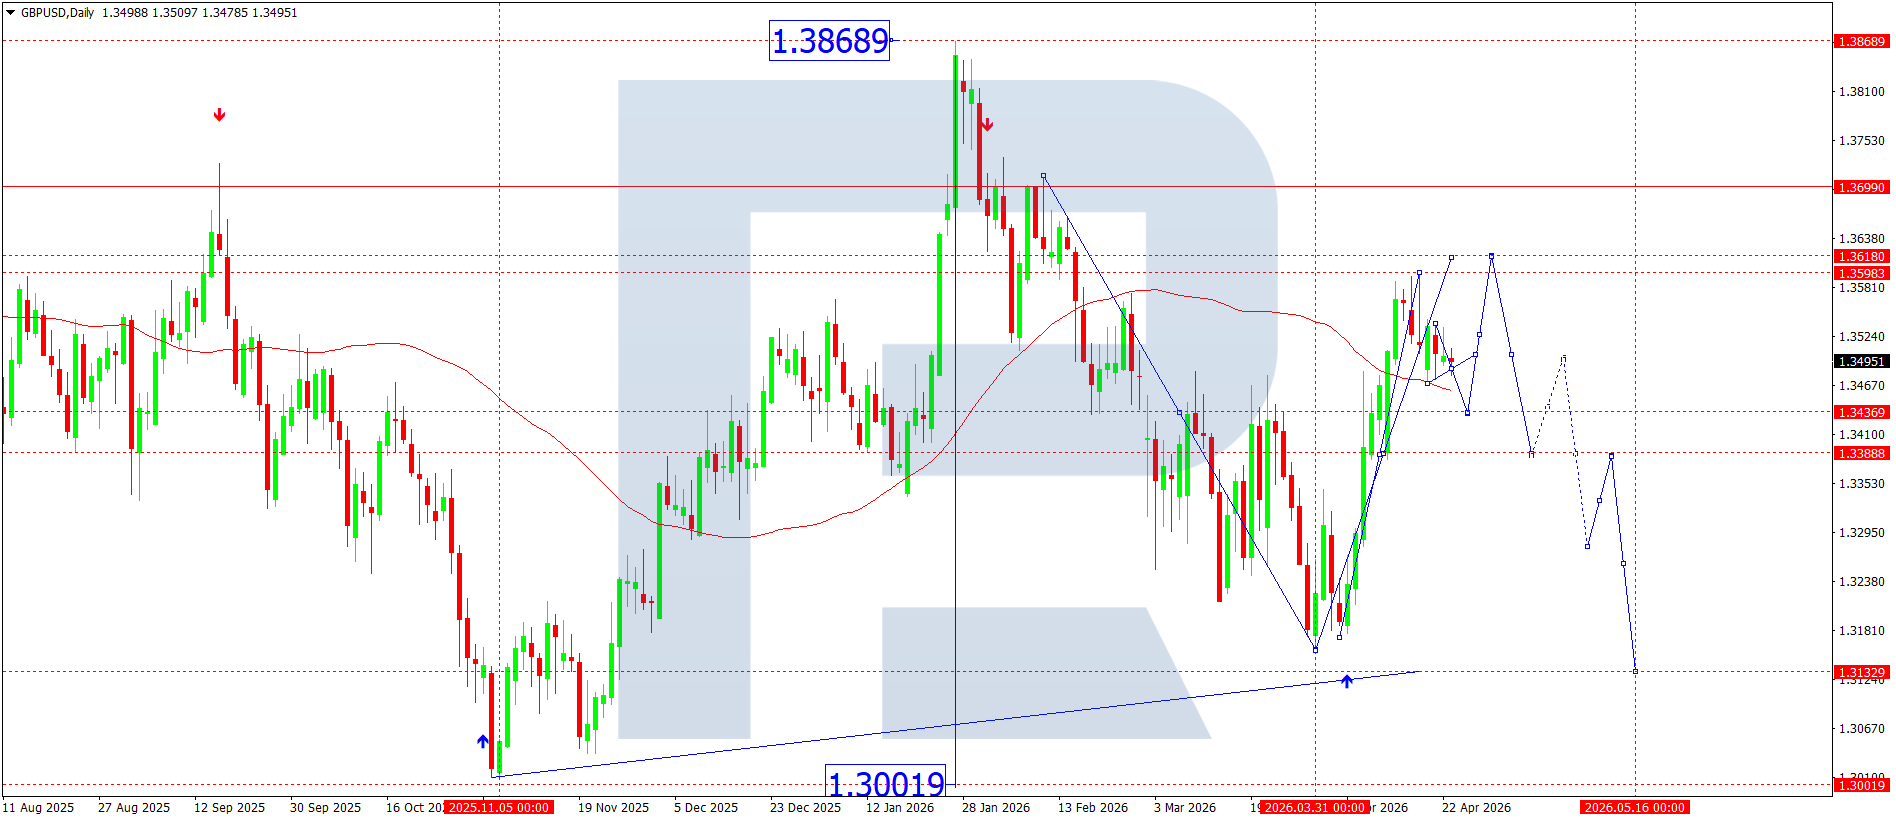
On the daily chart, the medium-term downward structure remains in place following the formation of a peak near 1.3869. Price completed an impulsive move lower and then shifted into a corrective recovery phase. The current dynamics point to an upward correction within the broader downtrend, with price testing the 1.3598–1.3618 supply zone. This area coincides with a previously broken support level that has now flipped to act as key resistance.
Locally, a wave structure has formed with sequentially renewed highs, but the angle of the advance remains corrective rather than impulsive. Price is trading near the moving average, confirming the absence of a sustained uptrend. The scenario in which the correction exhausts itself in the 1.3598–1.3618 zone looks preferable, after which the downward impulse is expected to resume.
The key support below is 1.3436. A decisive break of this level will confirm the end of the corrective phase and open the way for a decline towards 1.3132, where the long-term support line runs. The structure points to the formation of a potential downward wave aimed at renewing local lows.
Rejection from 1.3598 triggers a decline toward 1.3436, then an impulse lower to 1.3132. Sellers maintain control while price stays below the 1.3618 resistance cluster.
A daily close above 1.3618 invalidates the immediate bearish scenario and opens upside potential toward 1.3699. Would require a notable shift in fundamental drivers.
AUDUSD forecast for 27 April–1 May 2026
BearishAUDUSD fundamental outlook
The fundamental backdrop for AUDUSD heading into the week is shaped by mixed factors pulling in opposite directions. Market participants remain focused on Federal Reserve policy, as the Fed maintains a cautious approach to rate cuts amid persistent inflation in the US. Recent macroeconomic data point to a moderate economic slowdown, but the labour market remains sufficiently strong to keep the dollar supported.
The Reserve Bank of Australia is signalling a pause in tightening as it assesses slower domestic demand and the ongoing influence of China's economic conditions. Weak data from China — Australia's key trading partner — continue to weigh on the Australian dollar, as reduced Chinese demand directly affects commodity export revenues. Metal price instability adds further uncertainty to the AUD outlook.
Together, these factors form a restrained backdrop for AUD appreciation and support demand for USD as a safe-haven asset, making the bearish scenario the more probable path for AUDUSD in the near term.
Key driver this week: Chinese PMI data and commodity market developments. Weak Chinese manufacturing figures or a drop in iron ore prices would provide direct fundamental justification for a test of 0.7077 support.
AUDUSD technical analysis
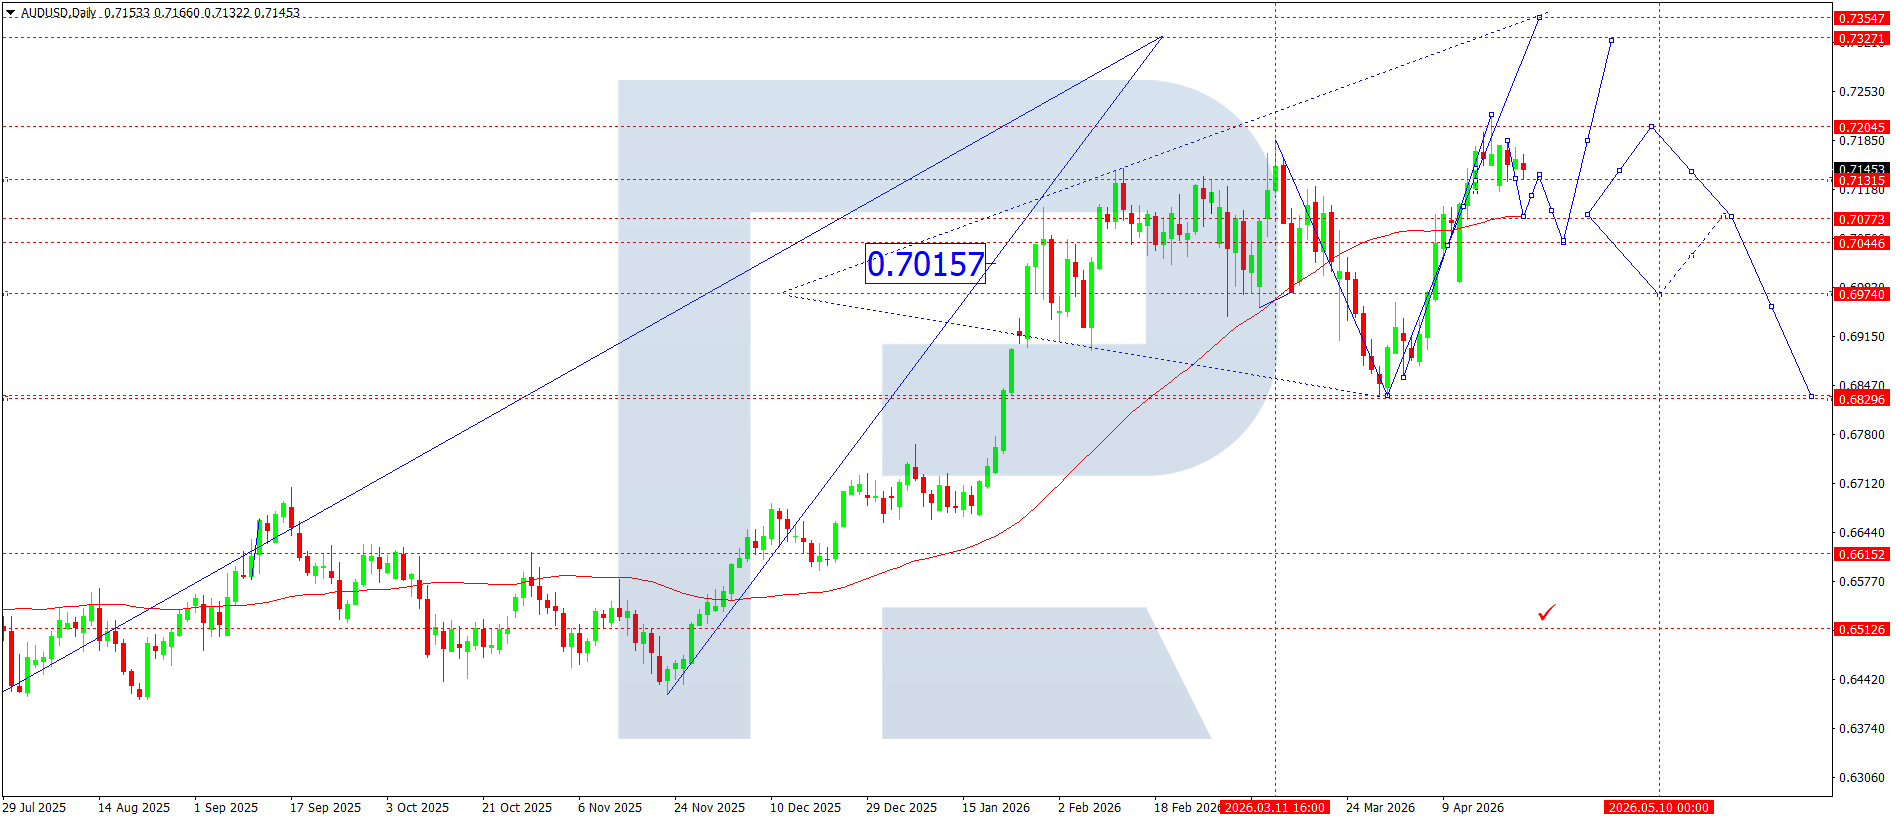
From a technical perspective, AUDUSD retains an ascending structure in the broader picture, though momentum is clearly slowing near the 0.7200–0.7250 resistance zone. After forming a local high near 0.7200, the price shifted into a corrective phase, testing the 0.6847 area before a confident rebound followed. The current structure points to the formation of an ascending channel, supported by the 0.6974 area which acts as the key pivot point.
The moving average indicates that the medium-term uptrend remains intact, but the price is trading in proximity to resistance, which increases the probability of a correction before any further advance. Within the wave structure, the completion of the impulsive phase can be assumed, with a shift into correction now underway.
The current 0.7131–0.7204 zone acts as a strong resistance cluster. If the market fails to consolidate above this area, a downward correction is likely to develop with an initial target at 0.7077 and then 0.6974. The alternative scenario considers a new impulse if the price consolidates above 0.7204, opening upside potential towards 0.7327 and then 0.7354.
Failure to break above 0.7204 triggers a pullback to 0.7077, with possible continuation to the 0.6974 pivot. The ascending channel structure remains intact during this move.
A daily close above 0.7204 triggers a new impulsive wave toward 0.7327, then 0.7354. Requires a positive catalyst from China data or a dovish Fed signal.
USDCAD forecast for 27 April–1 May 2026
BullishUSDCAD fundamental outlook
Over the coming week, market participants will focus on monetary policy developments and commodity market dynamics. The US dollar retains broad support amid firm expectations that the Federal Reserve will maintain a cautious approach to rate cuts because of persistent inflation pressure, while stable US labour market data continue to limit the potential for meaningful dollar weakness.
The Canadian dollar, in turn, is influenced by oil market dynamics, which are showing signs of stabilisation after recent volatility. The Bank of Canada continues to signal readiness for policy easing, but is doing so cautiously as it assesses inflation risks and the spillover from US tariff policy. This creates an asymmetric situation where the BoC is more likely to ease before the Fed, which structurally supports USDCAD.
Overall, this creates a mixed but dollar-leaning fundamental backdrop for USDCAD, with the primary bias towards moderate US dollar strengthening as long as oil prices do not stage a significant rally.
Key driver this week: Canadian employment data and crude oil inventory reports. A surprise in either direction could set the short-term tone for CAD — a weak jobs print combined with falling oil would strongly support the bullish USDCAD scenario.
USDCAD technical analysis
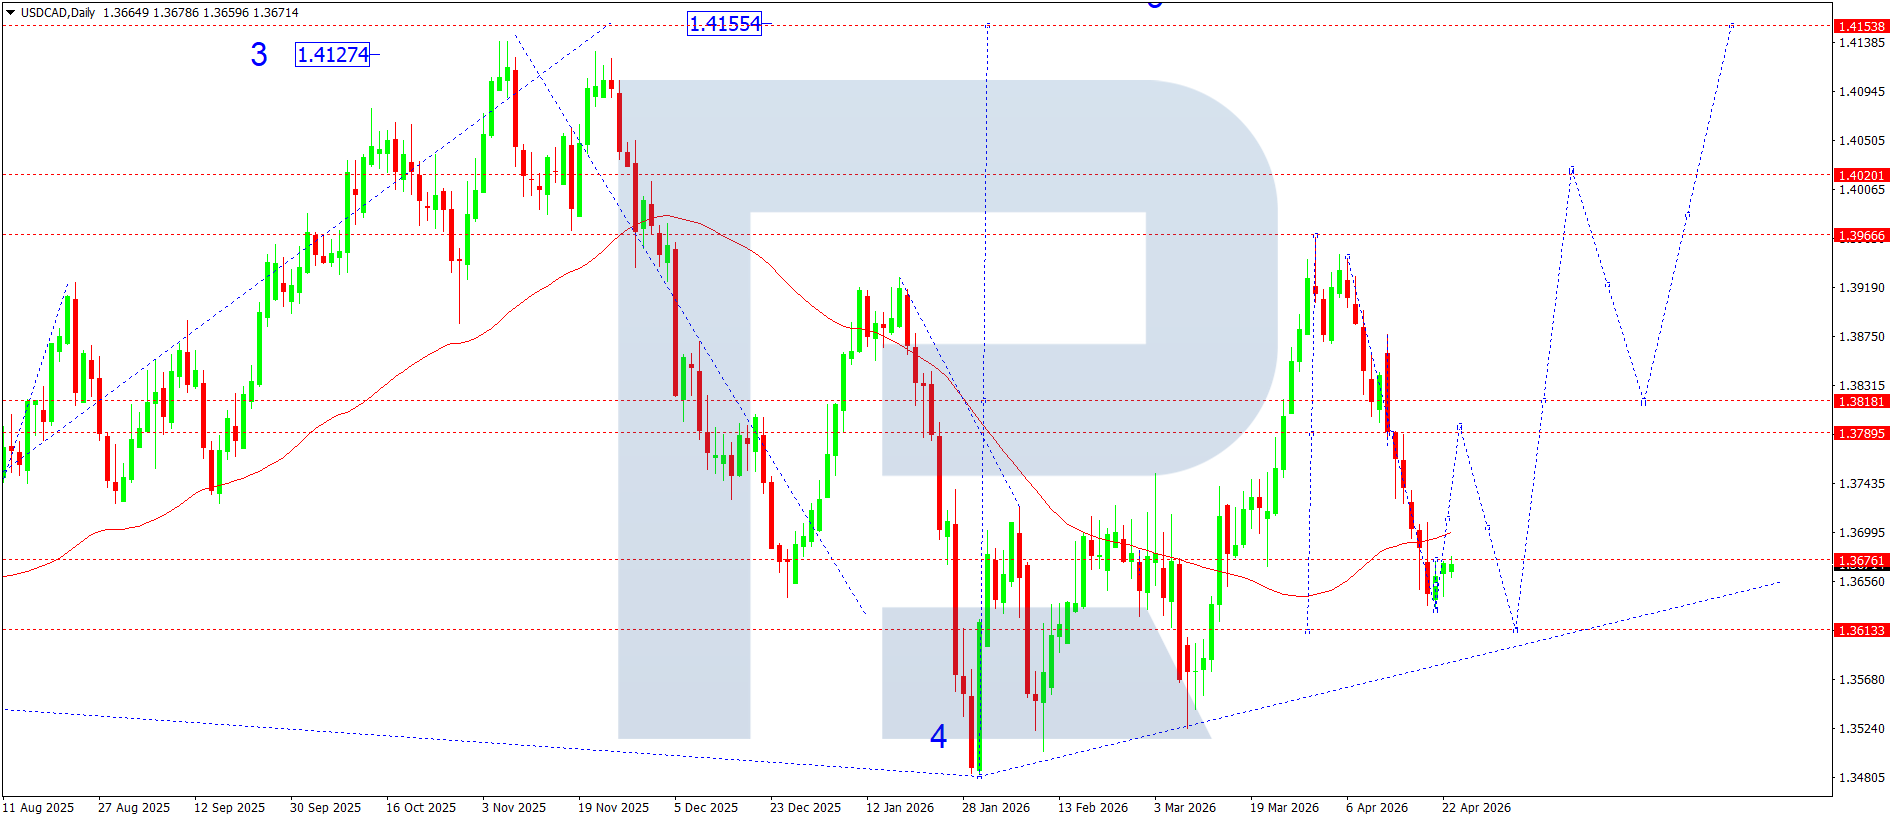
From a technical perspective, the daily chart maintains a medium-term corrective structure following the formation of a peak near 1.4155. Price tested the 1.3613 support zone and formed a local rebound, indicating an attempt to stabilise after the downward impulse. The moving average acts as dynamic resistance, and the current consolidation is taking place below it — keeping pressure on the pair in the near term while the base forms.
The rebound from 1.3613 is accompanied by compressed volatility, which often precedes a new directional impulse. The nearest resistance zone is around 1.3789–1.3818, where active selling previously occurred. A consolidation above this area would open potential for movement towards 1.3966 and then 1.4020.
The wave structure indicates the completion of the downward phase and a shift to corrective growth, but confirmation through a break of key resistance is still absent. The channel is gradually narrowing, forming a potential base for the next directional move. As long as 1.3613 holds as support, the path of least resistance is upward.
Consolidation above 1.3613 supports a move toward 1.3818 resistance. A break there opens the path to 1.3966 and potentially 1.4020 as the corrective rally extends.
A daily close below 1.3613 resumes downside pressure toward 1.3550. Would require a strong oil rally or notably hawkish BoC communication to materialise.
Gold (XAUUSD) forecast for 27 April–1 May 2026
BearishGold fundamental outlook
Gold remains highly sensitive to US dollar dynamics and interest rate expectations. The market is currently focused on signals from the Federal Reserve, where rhetoric remains moderately hawkish amid persistent inflation and a strong labour market. US Treasury yields have stabilised after their recent rise, which limits gold's upside potential in the near term — higher real yields increase the opportunity cost of holding the non-yielding metal.
Geopolitical tension continues to act as an intermittent supporting factor, periodically renewing demand for safe-haven assets. However, a stronger dollar is simultaneously creating headwinds for XAUUSD prices, as the two assets have maintained their traditional inverse correlation. Ahead of the new week, market participants will closely monitor US macroeconomic statistics — including inflation and business activity data — which could set a meaningful short-term impulse for the metal in either direction.
Key driver this week: US Core PCE inflation and ISM data. A higher-than-expected inflation print would push yields higher and the dollar stronger, reinforcing the bearish case for gold and increasing the likelihood of a break below 4,550.
XAUUSD technical analysis
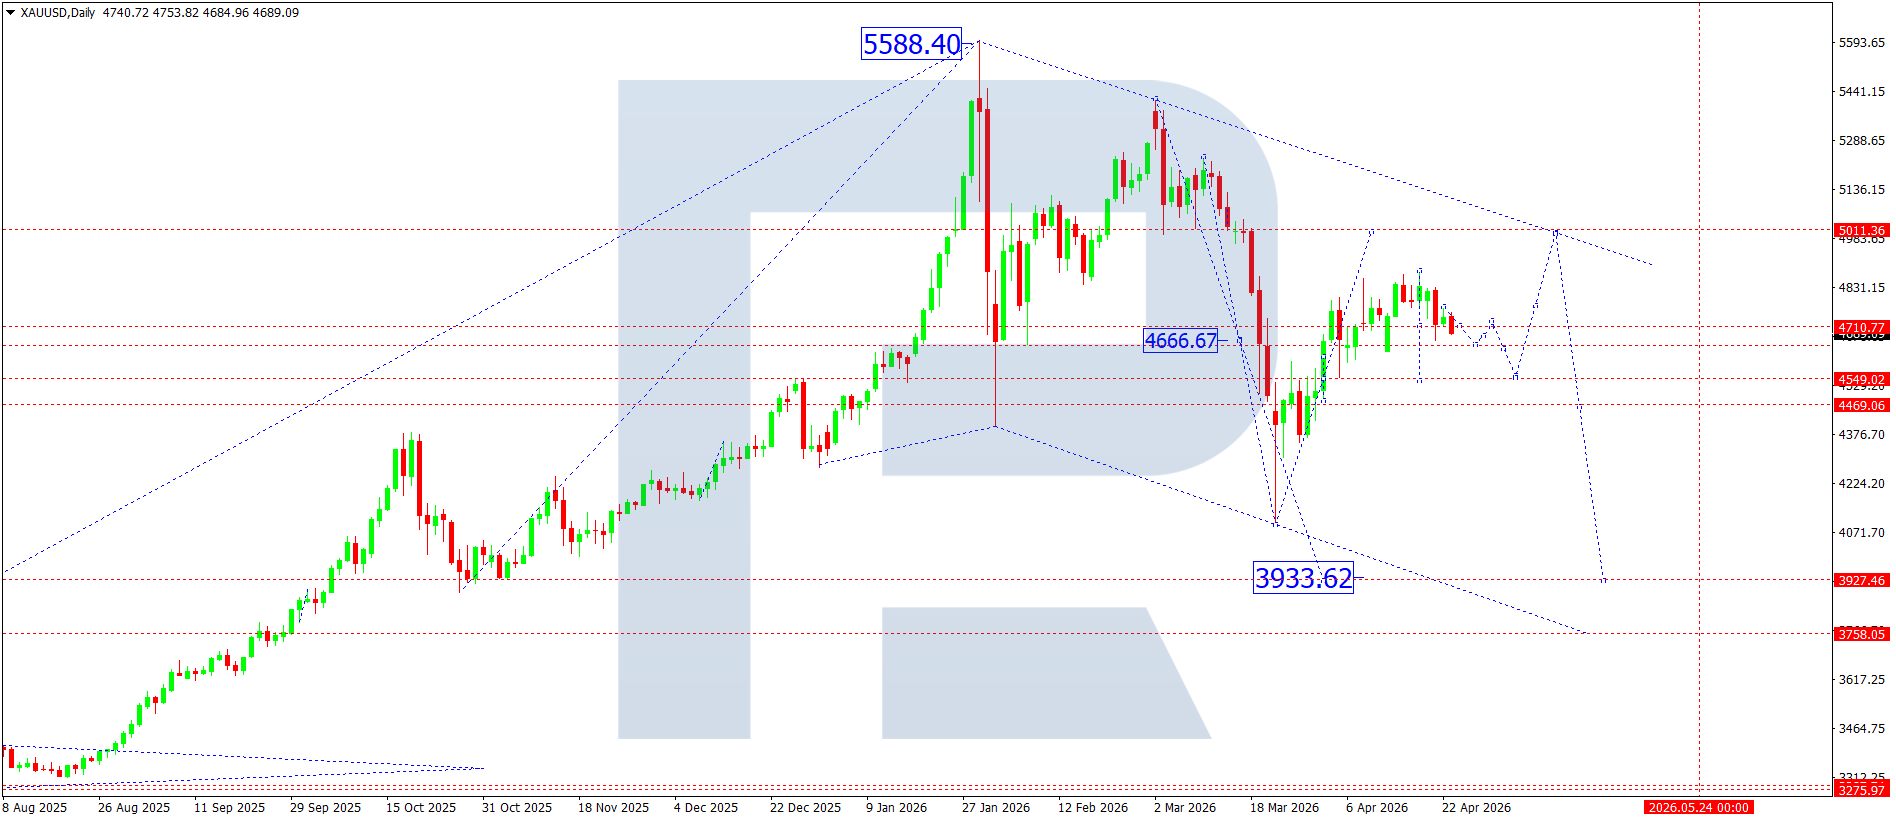
On the daily chart, XAUUSD maintains a downward corrective structure after forming a local high in the 5,588.40 area. From this level, price shifted into a decline, followed by the formation of a volatile sideways range. The current price remains below the key resistance zone of 4,710–4,750, indicating continued seller pressure and the absence of a sustained recovery attempt.
From a wave structure perspective, a corrective model is developing after the impulsive rise to the all-time high area. The 4,666 level acts as an intermediate pivot, from which a local rebound previously formed. The deeper downside target is located near 3,933, corresponding to the lower boundary of the descending channel.
Price is moving inside a descending channel where the upper boundary consistently limits recovery attempts. Each approach toward the 4,800 area has been met with selling pressure, confirming the dominance of the bearish scenario. In the short term, consolidation is forming between 4,550 and 4,710, which can be interpreted as accumulation ahead of the next directional move. The structure of lower highs and lower lows remains intact, increasing the probability of continued decline. Only a confident consolidation above 5,000 on a closing basis would shift the medium-term picture in favour of buyers.
Sustained selling below 4,550 opens the path to the channel target at 3,933. Confirmed by continued dollar strength and stable or rising US Treasury yields.
A break above 4,710 on a daily close would shift short-term momentum to buyers and target 5,010. Requires a notably dovish catalyst — weak US data or escalating geopolitical risk.
Brent crude oil forecast for 27 April–1 May 2026
MixedBrent fundamental outlook
The oil market is heading into the new week in a state of elevated volatility, influenced by several fundamental factors simultaneously. Market participants remain focused on OPEC+ policy, where a high level of discipline in limiting production continues to provide a structural floor for prices. The alliance has maintained its output restriction commitments, and there are no current signals of an imminent change in this stance.
The market is also reacting to geopolitical tension in the Middle East, which creates ongoing risks of supply disruptions that periodically support the risk premium embedded in oil prices. On the other hand, pressure comes from the strengthening US dollar amid Federal Reserve hawkishness, which traditionally reduces the appeal of dollar-denominated commodity assets. US oil inventory data have been showing unstable dynamics, adding to near-term uncertainty about the demand side of the equation.
Overall, the fundamental backdrop remains mixed — OPEC+ discipline and geopolitical risk provide support, while dollar strength and demand uncertainty cap the upside. The bias is towards price support in the medium term, but directional conviction is limited for the immediate week ahead.
Key driver this week: US crude oil inventory data (EIA report) and any OPEC+ statements. A larger-than-expected inventory draw combined with escalating Middle East tensions would be the strongest catalyst for a break above 102.30.
Brent technical analysis
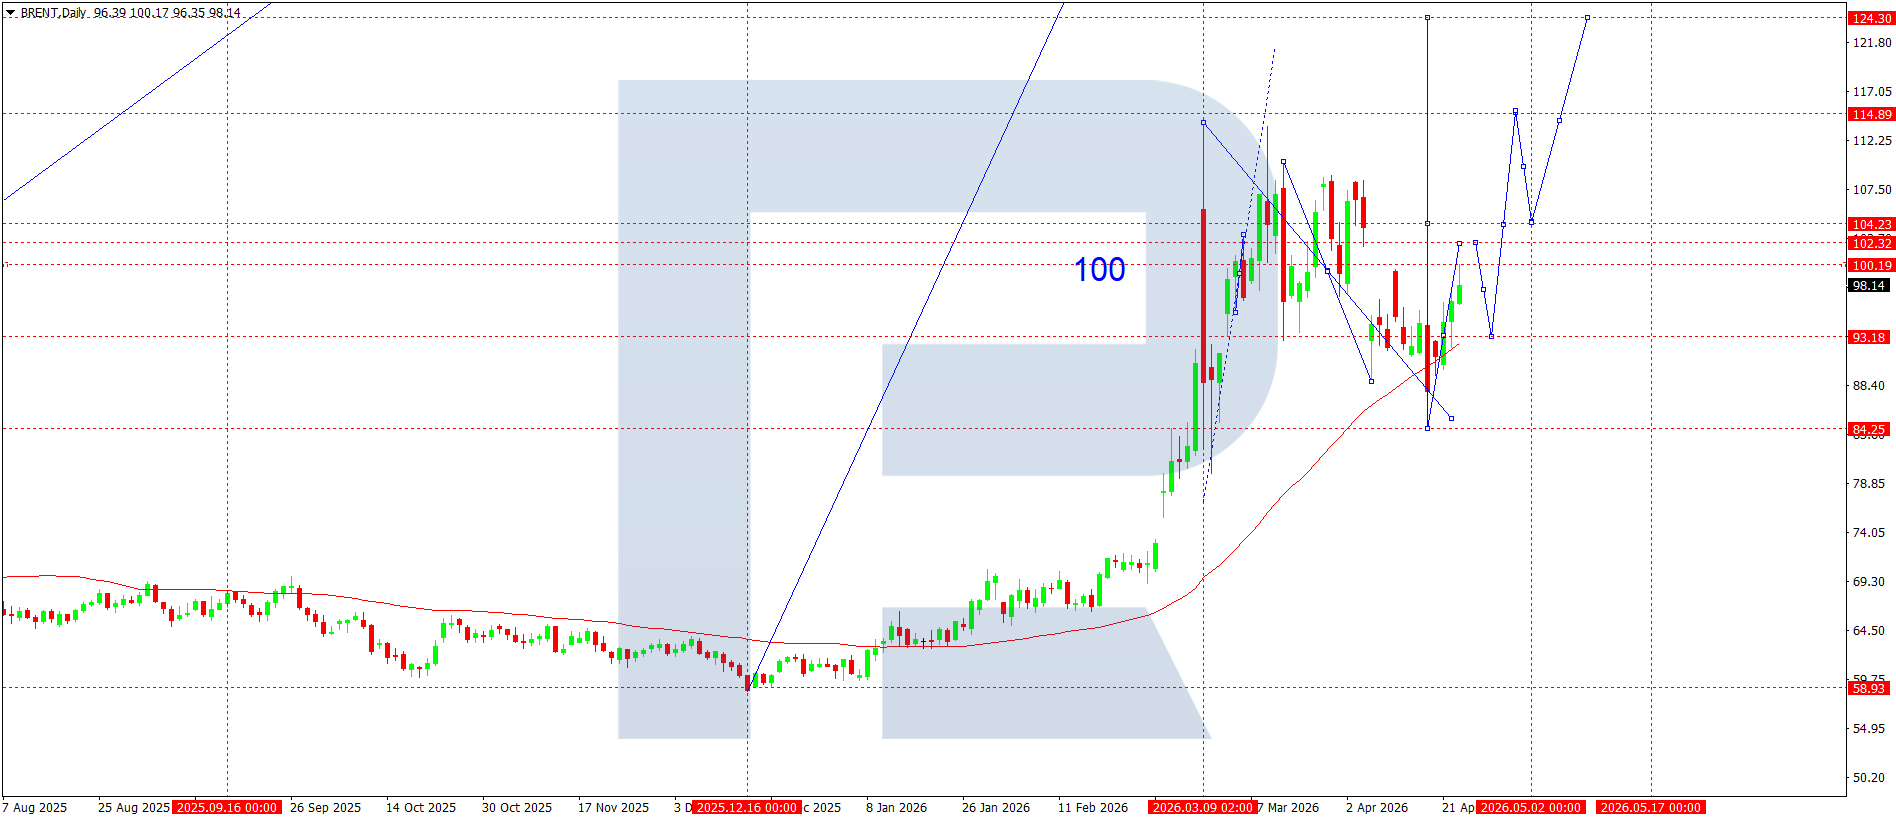
On the daily chart, Brent retains an ascending structure after an impulsive rise from the 70.00–75.00 base area, where a reversal formation was established. Price reached the key 104.20–104.80 zone, after which it entered a correction and consolidation phase. At present, a local corrective pattern is forming with support at 93.18, which acts as intermediate support within the ascending structure.
The movement of recent weeks can be interpreted as the development of a corrective wave following the completion of the prior impulse. A pullback into the 88.40–84.25 area represents a potential correction completion zone, where support from the ascending channel and the dynamic moving average also converge. The market has already shown a rebound from this zone, indicating that buyer interest remains active at these levels.
The upper boundary of the range runs through 104.23, acting as key resistance. A breakout of this zone would open the way to the next target at 114.89, and in the broader picture toward 124.30 — corresponding to the projection of the next impulsive wave. However, failure to consolidate above 100.00–102.30 in the near term increases the risk of a continuation of the sideways correction. The current structure looks more like accumulation ahead of the next directional move than a clear trend signal in either direction.
Consolidation above 102.30 confirms the end of the correction and triggers an impulsive move toward 104.23, then 114.89. A sustained break of 104.23 projects toward 124.30.
Failure to hold above 100.00 resumes the corrective decline toward 93.18 and potentially 88.40, where the ascending channel and moving average provide structural support.
Forecasts presented in this section only reflect the author’s private opinion and should not be considered as guidance for trading. RoboForex bears no responsibility for trading results based on trading recommendations described in these analytical reviews.