
Gold (XAUUSD) Forecast 2026: Technical Analysis, Price Levels & Predictions
Disclaimer: This article is prepared on the basis of reputable financial sources and analytical data from RoboForex specialists. It reflects the conclusions of thorough research; however, economic changes may significantly affect market conditions and alter the XAUUSD forecast. We recommend conducting your own research and consulting with professionals before making financial decisions.
Gold (XAUUSD) is trading near 4,150 USD per troy ounce as of late September 2026, after the August recovery faded and price slipped back below the key moving averages. The market is moving in a sideways range between 3,920 USD and 4,500 USD, and a downward wave is developing inside it: on the daily chart price has crossed EMA65 and EMA200 from above, and the weekly candle has closed below the middle Bollinger Band. The main pressure comes from the Federal Reserve, which raised the rate to 4.00% on 16 September, its first hike since 2023. Demand keeps supporting the metal: global gold ETFs have recorded 11 consecutive weeks of inflows, lifting holdings to a record 4,189 tonnes, and central banks bought 288.9 tonnes in Q2 2026. A confirmed breakout above 4,500 USD would reopen the path toward 4,855 USD, while a close below 3,920 USD would extend the decline.
Key takeaways: XAUUSD forecast
- Market structure: Sideways range between 3,920 USD and 4,500 USD, with a downward wave developing inside it. Price is near 4,150 USD.
- Key resistance: 4,855 USD, the April 2026 high. Intermediate levels on the way: 4,500 USD (breakout trigger) and 4,750 USD (EMA 200 test zone).
- Key support: 3,920 USD. A confirmed close below this level cancels the growth scenario and extends the downward wave.
- Active scenario: Bullish on a breakout. A move above 4,500 USD confirms growth toward 4,855 USD and then 5,597 USD.
- Main risk: USD strength after Fed tightening. The Fed raised the rate to 4.00% in September, and markets price a 54.2% chance of another hike in October.
| Horizon | Range (USD/oz) | Bias |
|---|---|---|
| 2026 (annual) | 3,942-5,597 | Bullish |
| 2027 | ~5,400 | Bullish |
| 2028-2030 | 7,000-8,000 | Bullish |
XAUUSD technical analysis
The technical picture has weakened since the August review, when gold was building a growth wave above both moving averages near 4,360 USD. Price has given back the August gains and trades near 4,150 USD. On the daily and H4 charts it sits below EMA65 and EMA200, and both averages on H4 point lower. On the weekly chart the candle has closed below the middle Bollinger Band. Oscillators are close to oversold on the shorter timeframes, so a corrective bounce is possible, although the indicators have yet to confirm a new growth wave. The monthly timeframe stays on Sell.
Indicator summary
| Indicator | Daily (D) | Weekly (W) | Monthly (M) |
|---|---|---|---|
| MA 65 / 200 | Neutral | Neutral | Neutral |
| RSI (14) | Sell | Neutral | Sell |
| MACD (12/26/9) | Neutral | Buy | Sell |
| Stochastic (%K/%D) | Buy | Buy | Buy |
| Overall signal | Neutral | Neutral | Sell |
Daily timeframe (D1)
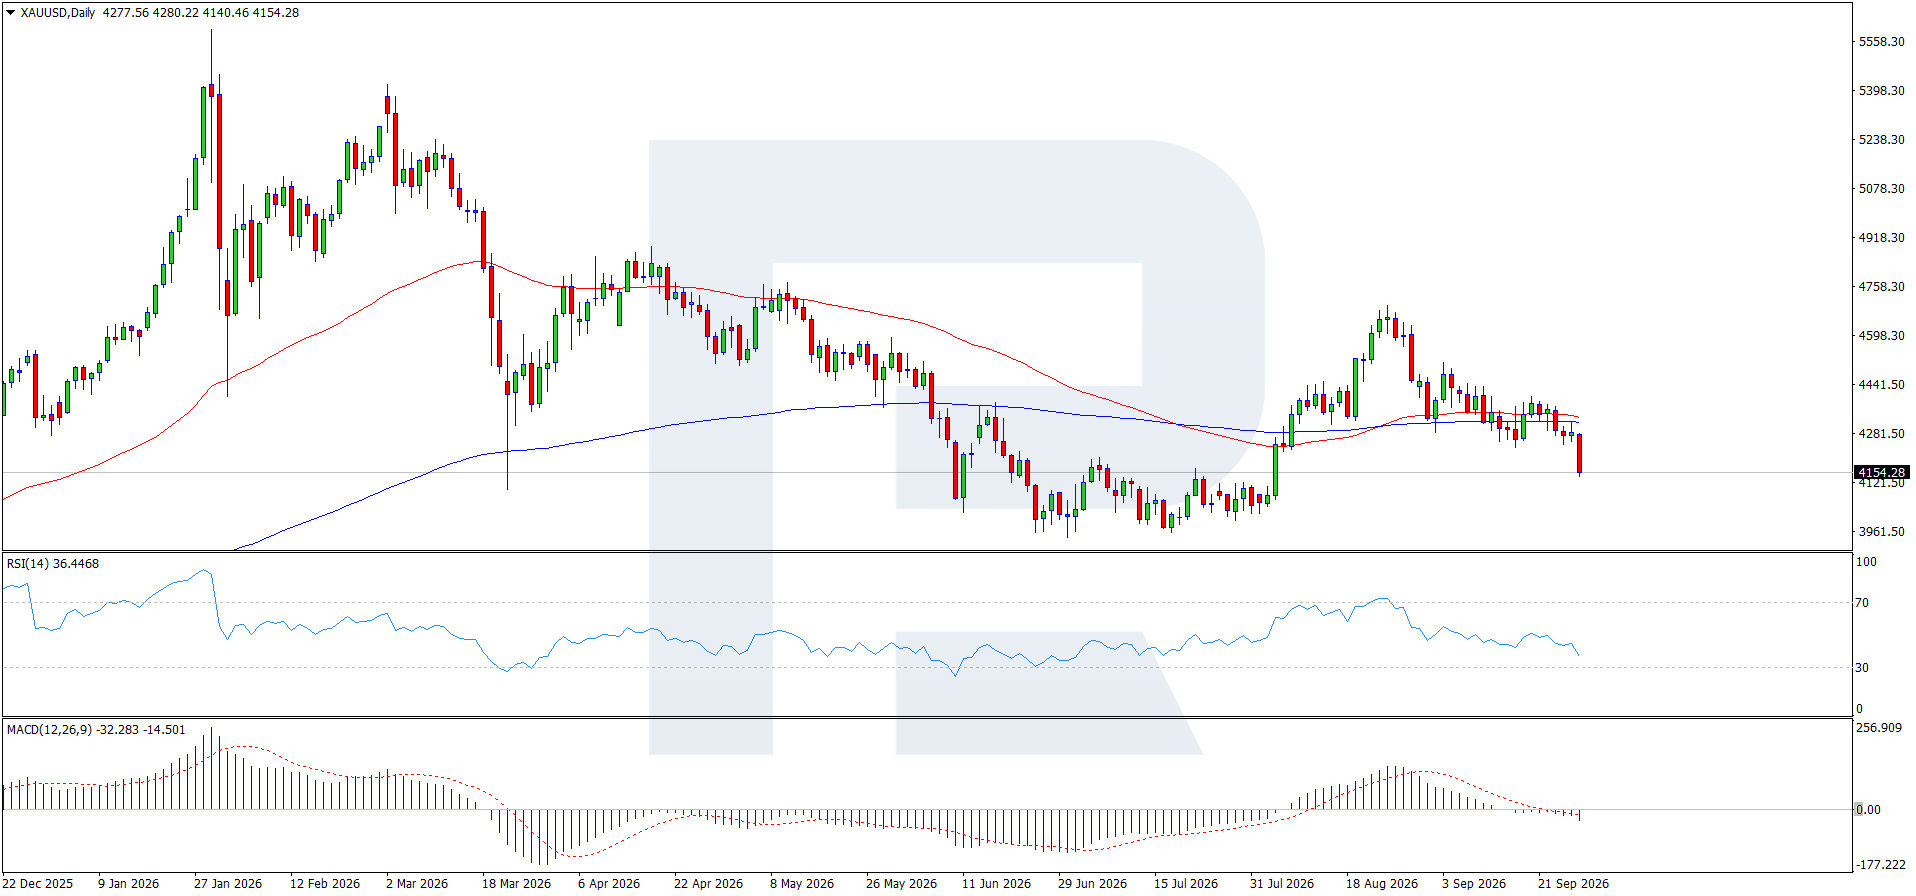
On the D1 chart, XAUUSD has crossed EMA65 and EMA200 from above and continues its downward wave, leaving the horizontal range that held through most of September. The RSI signal line is moving toward the 30 level and stood near 36 at the time of review. The MACD histogram is below zero and still falling, which shows that sellers control the short-term move.
At this stage the indicators call for patience. A new growth wave would need three confirmations: an EMA65 and EMA200 crossover from below, the RSI signal line crossing 30 upward, and the MACD signal line crossing zero from below. Together they would show that the corrective wave has ended and a new growth wave can begin. The buy scenario is cancelled if EMA65 crosses EMA200 from above and price closes below 3,920 USD.
H4 timeframe
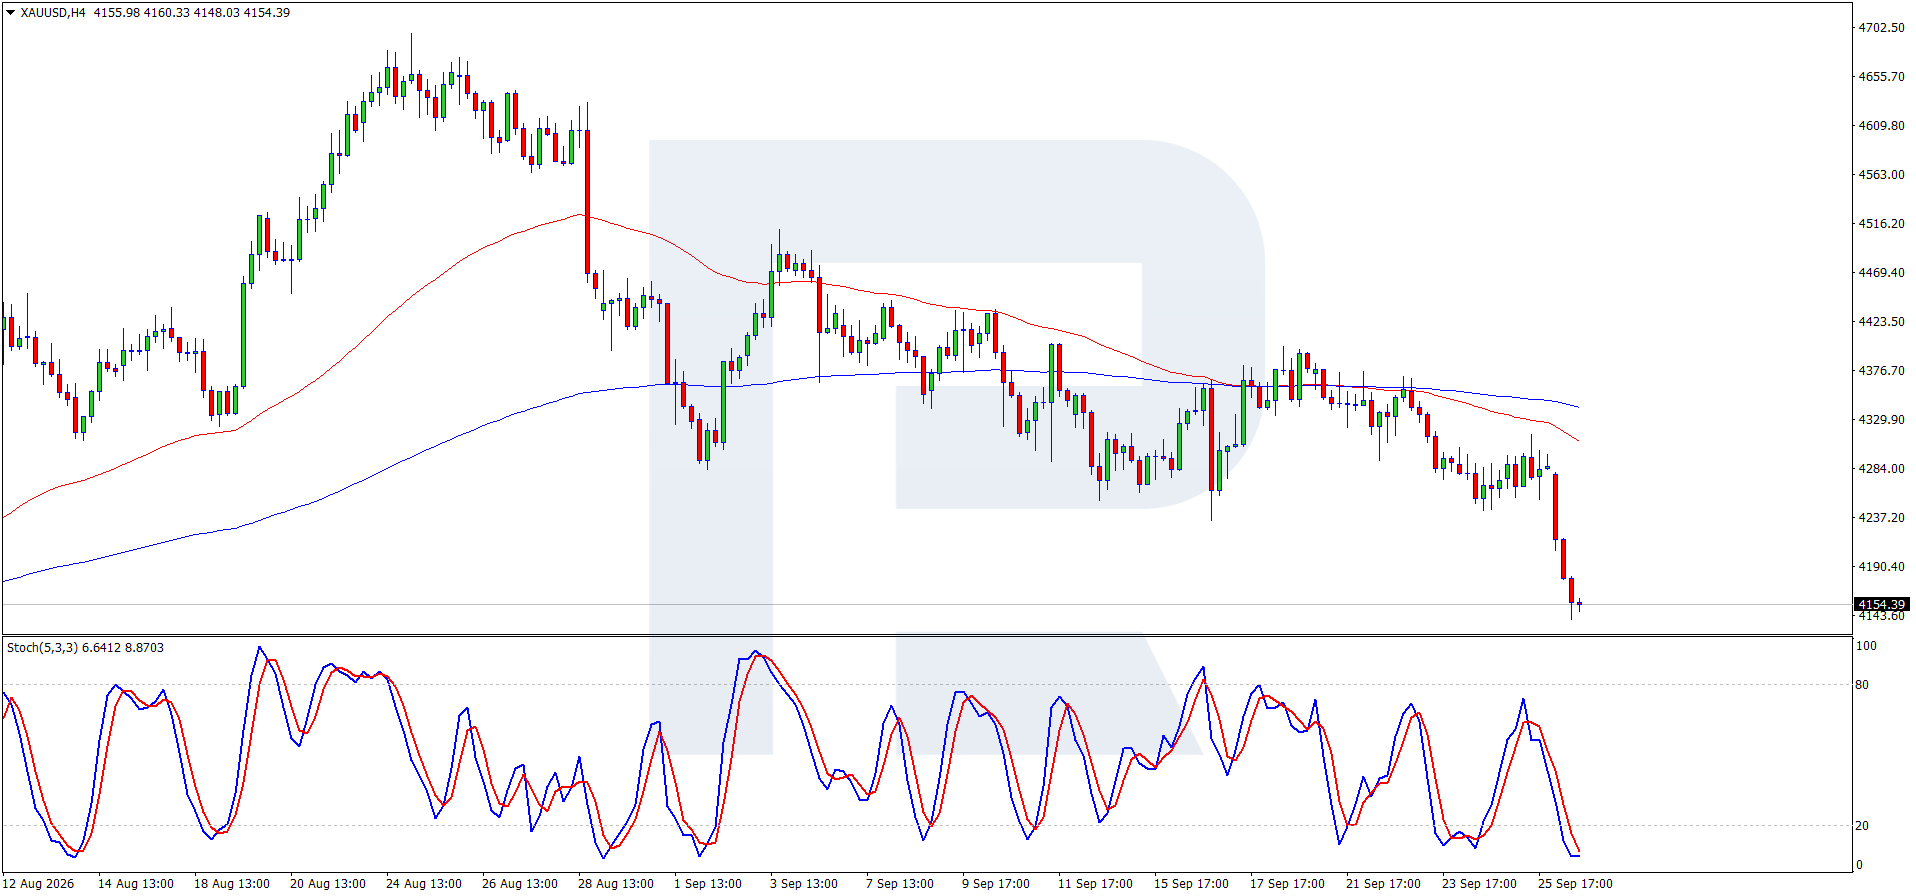
On the H4 chart, XAUUSD is trading near 4,150 USD. Price bounced off the moving averages from below and resumed its decline, forming short corrective waves along the way. After their crossover, EMA65 and EMA200 both continue to slope downward, which points to a developing downward wave.
The Stochastic oscillator is in the oversold zone, which can signal a corrective bounce. If a new growth wave starts, the first target is the nearest resistance at 4,750 USD. Beyond it, price could extend toward 4,855 USD and then the 5,597 USD all-time high.
Weekly timeframe (W)
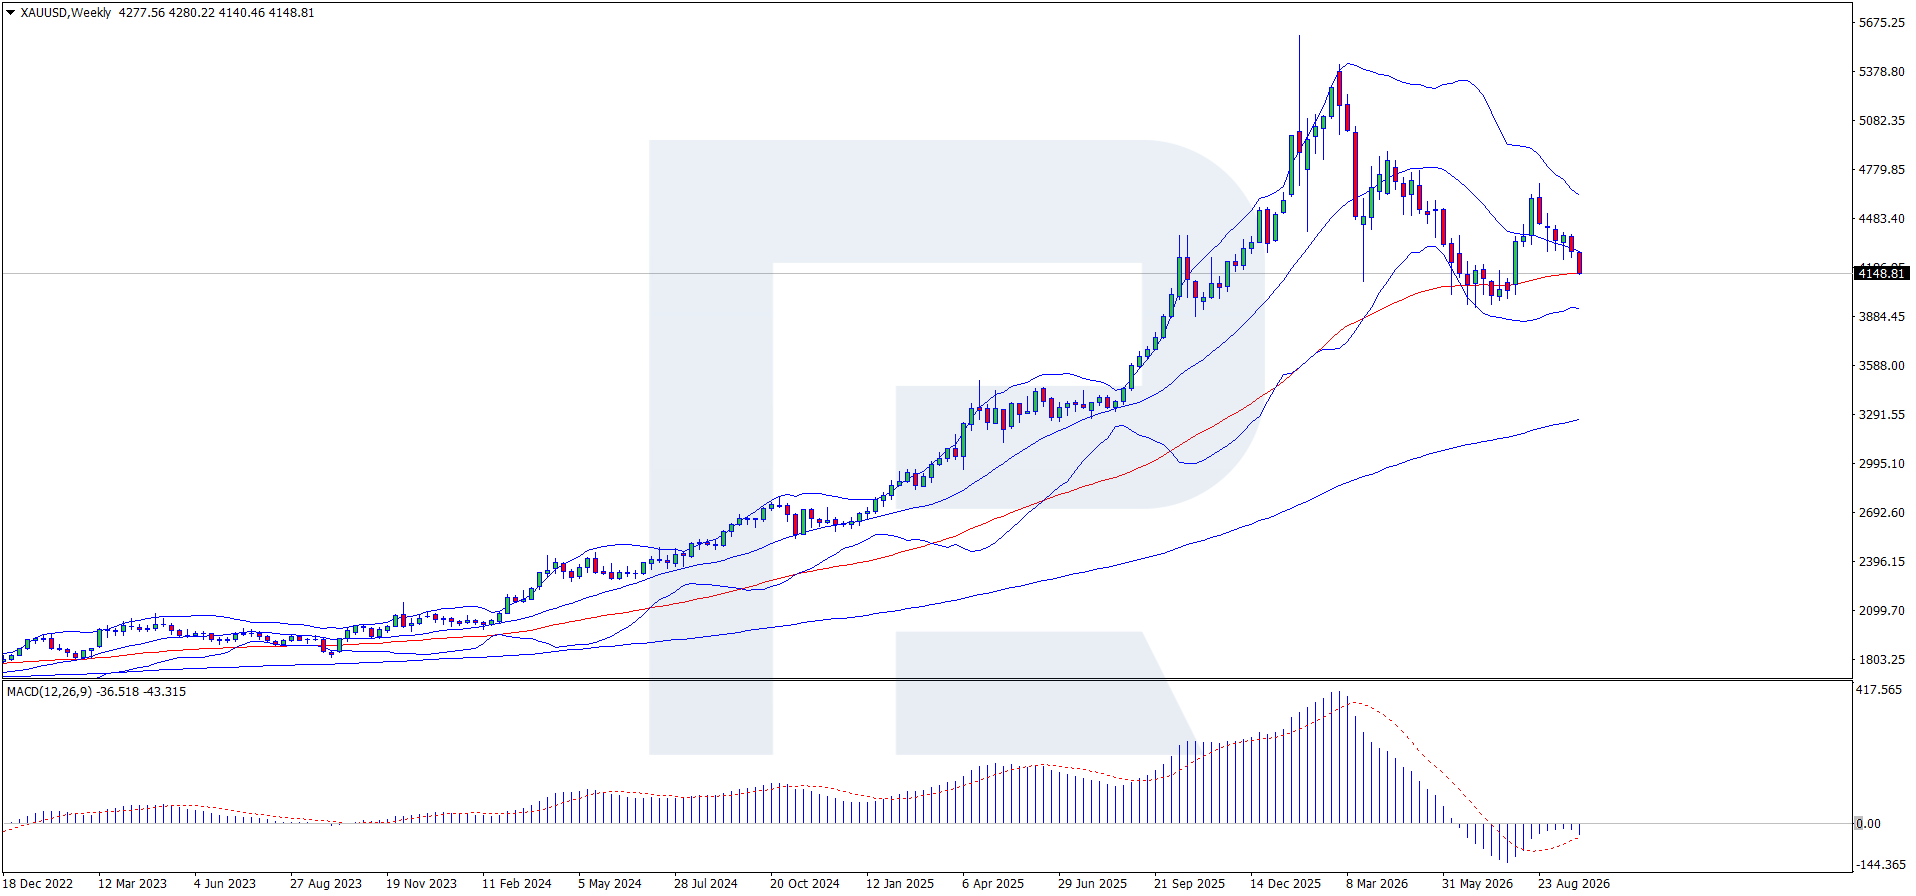
On the weekly chart, XAUUSD is testing 4,150 USD within a downward wave. The candle has closed below the middle Bollinger Band, and price is resting on the moving average near 4,150 USD. If price consolidates below the middle band, the next target is the 3,920 USD support.
The MACD histogram is below zero and shrinking, and the signal line is turning up toward zero. This shows that selling pressure is easing and the downward phase may be close to completion. In the longer term, a growth wave that breaks 4,750 USD and 4,855 USD would open the way toward 5,597 USD. The 3,920 USD support is the signal barrier: a break below it cancels the growth scenario and extends the downward wave.
Trading scenarios
Bullish scenario
A breakout above the 4,500 USD resistance starts a new growth wave and gives price a chance to renew the all-time high.
| Entry trigger | Above 4,500 USD |
| Invalidation | Below 4,316 USD |
| Target 1 | 4,855 USD |
| Target 2 | 5,597 USD (ATH) |
Bearish scenario
A break below the 3,920 USD support starts a new downward wave toward the next structural support zones.
| Entry trigger | Below 3,920 USD |
| Invalidation | Above 4,120 USD |
| Target 1 | 3,360 USD |
| Target 2 | 3,000 USD |
Sideways scenario
If price keeps moving within a sideways range, the preferred approach is buying after a confirmed breakout and consolidation above resistance, targeting the upper boundary of the channel.
| Entry trigger | Above 4,550 USD |
| Invalidation | Below 4,450 USD |
| Target 1 | 4,840 USD |
| Target 2 | 5,597 USD |
Key XAUUSD price levels
The levels below come from structural analysis of the Daily, H4 and Weekly charts: historical swing highs and lows, EMA zones and Bollinger Band references. 4,855 USD is the main resistance, and R1 marks the intermediate step on the way to it.
| Type | Level (USD/oz) | Significance |
|---|---|---|
| Resistance 3 (R3) | 5,597 | All-time high (January 2026), the ultimate upside target of a growth wave |
| Resistance 2 (R2) | 4,855 | Resistance formed in April 2026, the main barrier on the way up |
| Resistance 1 (R1) | 4,750 | EMA 200 test zone, the first barrier above the 4,500 USD breakout trigger |
| Pivot (P) | 4,150 | Current price zone, at the moving average on the weekly chart |
| Support 1 (S1) | 3,920 | Multi-tested level with repeated bounces, the signal barrier for the growth scenario |
| Support 2 (S2) | 3,360 | September 2025 resistance that turned into support, the key level in the bearish scenario |
| Support 3 (S3) | 3,000 | Psychological round number, the extreme downside reference if S2 fails |
Psychological levels: in April 2026 price made three attempts to break through 4,855 USD, and each ended with a false breakout and a rejection. That makes it the most technically significant barrier on the path higher. 5,597 USD is the historic maximum for gold prices and the defining target for the long-term bull case.
XAUUSD forecast by horizon
Short-term expectations are set through level-based conditions, so the forecast stays valid between scheduled reviews. Medium- and long-term ranges reflect the institutional consensus and RoboForex analytical assumptions.
| Horizon | Range (USD/oz) | Average | Bias |
|---|---|---|---|
| 2026 (annual) | 3,942-5,597 | ~4,900 | Bullish |
| 2027 | ~5,400 | ~5,400 | Bullish |
| 2028-2030 | 7,000-8,000 | ~7,000 | Bullish |
The 2026 range assumes the 3,920 USD signal barrier holds and central bank buying keeps its Q2 pace. The Fed's September hike to 4.00% and the chance of another move in October are the main pressure on the lower half of the range. The upper bound reflects a return to the all-time high, which would need a breakout above 4,855 USD. The long-term case (2028-2030) rests on structural de-dollarisation and steady central bank demand, factors that work largely independently of short-term price action.
What drives the XAUUSD price
Federal Reserve policy
As of 23 September 2026, the Federal Reserve rate stands at 4.00%. On 16 September the FOMC raised the rate by 25 basis points for the first time since 2023. The vote was 12-0, which replaced the split seen at the July meeting. The next meeting is scheduled for 27-28 October 2026. Markets expect more tightening: CME FedWatch puts the probability of another hike in October at 54.2%, and the probability of at least one more hike by December at about 90%. Kevin Warsh sets the tone, describing inflation as too high for too long and stressing that Fed policy carries no advance commitments.
Central bank gold demand
According to the latest World Gold Council Gold Demand Trends Q2 2026, central bank demand for gold stays firm. In Q2 2026, central banks added 288.9 tonnes to their gold reserves, 62% more than a year earlier. Poland was the largest single buyer, while China accelerated its accumulation. Uzbekistan and Kazakhstan were also among the most active buyers. Total demand for the first half of 2026 reached 2,522 tonnes, up 2% year-on-year. The physical market stays resilient: weaker jewellery demand is offset by central bank purchases, investment demand and strong activity from Asian buyers.
Geopolitics, DXY & ETF flows
Geopolitics. On 23 September market attention was on the UN General Assembly. Donald Trump spoke of a possible deal with Iran and a quick resolution of the Ukraine conflict, while Iran set out its conditions for reopening the Strait of Hormuz. A meeting between Marco Rubio and Sergei Lavrov was scheduled for the same day. The Middle East conflict and energy prices remain the main geopolitical influence on gold.
Dollar. The US Dollar Index (DXY) is trading near 100.8, a two-month high, and is forming a growth wave. Fed signals support it: markets price a 54.2% chance of an October hike after the September increase to 4.00%. A stronger dollar makes gold more expensive for holders of other currencies and limits demand.
ETF flows.Global gold ETFs have recorded 11 consecutive weeks of inflows, adding 27.1 tonnes in the latest week and lifting total holdings to a record 4,189 tonnes. SPDR Gold Trust added 0.57 tonnes on 22 September, bringing its holdings to 1,056 tonnes. The inflows continue despite a firmer dollar and rising rates.
What could push XAUUSD lower
- Fed tightening: Further tightening and another rate hike would draw investors into USD assets and could trigger a decline in XAUUSD. The Fed already raised the rate in September, and markets see a 54.2% chance of another hike in October.
- Sustained USD strengthening: A stronger dollar and higher USD rates make a zero-yield asset less attractive for yield-seeking capital.
- Geopolitical de-escalation: A deal with Iran or progress on Ukraine would reduce the safe-haven premium in the price and could shift capital from gold back into riskier assets.
- Speculative profit-taking: Speculators, alongside central banks, took profits near the historic highs and are likely looking for new entry points at lower prices, which can cap rallies in the near term.
Bank & institution forecasts
Major institutions keep year-end targets above current levels, from 4,500 USD to 6,000 USD per ounce. The width of the range reflects different views on the Fed's policy path and on how fast gold can recover toward its historic highs.
| Institution | Target (USD/oz) | Horizon | Date |
|---|---|---|---|
| J.P. Morgan | 6,000 | End of 2026 | 3 Jul 2026 |
| Deutsche Bank | 6,000 | End of 2026 | 23 Jun 2026 |
| Wells Fargo | 5,300-5,500 | End of 2026 | 16 Jun 2026 |
| UBS | 5,200 | Next 12 months | 3 Jul 2026 |
| Morgan Stanley | 5,200 | H2 2026 | 3 Jul 2026 |
| Goldman Sachs | 4,900 | End of 2026 | 3 Jul 2026 |
| Bank of America | 4,800 | End of 2026 | 3 Jul 2026 |
| Citi Research | 4,500-5,000 | Next 6-12 months | Jun 2026 |
Long-term gold outlook (2030)
| Analyst / source | 2030 estimate (USD/oz) | Key assumption |
|---|---|---|
| Charlie Morris (LBMA Alchemist) | 7,000 | Gold price growth tied directly to inflation; real inflation reaching ~4% per decade |
| Peter Leeds | 10,000 | Growth driven by a combination of compounding economic and geopolitical factors |
| RoboForex base case | 7,000-8,000 | Continued central bank accumulation, an eventual Fed easing cycle, persistent US fiscal deficit |
Long-term forecasts vary widely depending on assumptions about inflation and the pace of de-dollarisation. The bull cases above need a sustained loss of confidence in fiat currencies and continued central bank diversification away from USD assets. The key risk to all long-term targets is a lasting return to tighter global monetary policy, which would delay the longer-term upward path and would not necessarily end it.
How to trade XAUUSD
Traders and investors can gain exposure to gold through several instruments, each with its own cost structure, leverage and time horizon.
| Instrument | Leverage / cost | Best suited for |
|---|---|---|
| CFD on XAUUSD | High leverage available; spread + overnight swap | Short- and medium-term traders seeking directional exposure |
| Gold futures (COMEX) | Standardised contracts; margin requirement; roll cost | Institutional and professional traders hedging or speculating |
| Gold ETF (GLD, IAU) | No leverage; low annual fee; exchange-traded | Medium- to long-term portfolio allocation |
| Physical gold (bars, coins) | No leverage; storage/insurance cost; wide bid-ask | Long-term wealth preservation |
Trade XAUUSD with tight spreads on MobileTrader and MetaTrader 5.
Open an accountPros and cons of trading gold
Pros
- Exceptional liquidity: XAUUSD is one of the most liquid markets globally, with deep order books and tight spreads around the clock.
- Tradeable volatility: Regular directional moves driven by FOMC decisions, CPI releases and geopolitical events create opportunities across multiple timeframes.
- Safe-haven demand: Gold benefits from risk-off flows and geopolitical stress, which makes it a natural diversifier against stocks.
- Strong central bank demand: Q2 2026 purchases of 288.9 tonnes, up 62% year-on-year, provide a structural demand floor largely independent of price.
- Record ETF holdings: 11 weeks of inflows and a record 4,189 tonnes show steady investor demand even as rates rise.
- Inflation hedge: Over multi-decade periods, gold has preserved purchasing power better than most fiat currencies.
Cons
- No yield: Gold pays no dividends or interest, so it competes with interest-bearing assets, and rising real rates increase the cost of holding it.
- Sharp drawdowns: As the 2026 correction showed, gold can lose 25-30% from an all-time high within months when the Fed tightens.
- DXY and rate sensitivity: A strong dollar and rising real yields remain the main structural pressure on gold, and the link between them is persistent and well documented.
- Fed policy uncertainty: After the September hike to 4.00%, a 54.2% chance of another hike keeps headline risk high for gold positions ahead of the 27-28 October meeting.
- Leverage risk (CFD): High leverage amplifies both gains and losses; a 1% adverse move on 1:100 leverage wipes out the full margin.
XAUUSD forecast methodology
How we build the forecast
- Technical analysis (three timeframes). We analyse the Daily (D1), H4 and Weekly (W) XAUUSD charts. On each timeframe we identify market structure, key support and resistance levels, and signals from trend indicators (MA 65/200, Bollinger Bands) and oscillators (RSI 14, MACD 12/26/9, Stochastic).
- Fundamental analysis. We track the key XAUUSD drivers: Fed rate decisions (source: federalreserve.gov), central bank demand data (source: World Gold Council), gold ETF flows, the US Dollar Index (DXY) and the geopolitical risk environment.
- Institutional forecast consensus. We aggregate the latest published targets from major investment banks, sourced from official publications and verified through Reuters and Bloomberg.
- Update schedule. RoboForex Analysis Department reviews this article at least once a month. Unscheduled updates follow significant market events (FOMC decisions, WGC data releases, sharp price moves). The date of the most recent review is shown at the top of the article.
Conclusion
XAUUSD has given back its August gains and trades near 4,150 USD inside a sideways range between 3,920 USD and 4,500 USD. On the daily chart price has crossed EMA65 and EMA200 from above, and the weekly candle has closed below the middle Bollinger Band, so a downward wave is developing within the range. The Stochastic is oversold on H4 and the weekly MACD shows easing selling pressure, which leaves room for a corrective bounce. The upside trigger to watch is a confirmed breakout above 4,500 USD, which would open the path to 4,855 USD and the 5,597 USD all-time high.
The fundamental picture is mixed. The Fed raised the rate to 4.00% in September, its first hike since 2023, and markets see a 54.2% chance of another increase on 27-28 October. The dollar index is near a two-month high. On the demand side, gold ETFs have logged 11 weeks of inflows to a record 4,189 tonnes, and central banks bought 288.9 tonnes in Q2. Institutional year-end targets range from 4,500 USD (Citi Research) to 6,000 USD (J.P. Morgan and Deutsche Bank). The 3,920 USD support is the key line: while it holds, the growth scenario stays in play.
FAQ
What is the XAUUSD forecast for the next week?
XAUUSD is trading near 4,150 USD after crossing EMA65 and EMA200 from above on the daily chart. The Stochastic on H4 is in the oversold zone, so a short corrective bounce is possible. While price holds above 3,920 USD the range stays intact; a confirmed close below it would extend the downward wave toward 3,360 USD. A move back above 4,500 USD would restore the growth scenario toward 4,855 USD.
What are the key support and resistance levels for XAUUSD?
Key resistance: 4,500 USD (breakout trigger), 4,750 USD (EMA 200 test zone), 4,855 USD (the main resistance, April 2026 high with three failed breakout attempts), 5,597 USD (all-time high). Pivot: 4,150 USD (current price zone). Key support: 3,920 USD (signal barrier; a break cancels the growth scenario), 3,360 USD (September 2025 resistance turned support), 3,000 USD (psychological level). See the Key Price Levels table for the complete picture.
Is XAUUSD bullish or bearish right now?
The overall signal is Neutral on the daily and weekly timeframes and Sell on the monthly, with bearish short-term pressure. Price trades below EMA65 and EMA200 on the daily chart, RSI is near 36 and MACD is below zero. The bullish scenario needs a breakout above 4,500 USD; a close below 3,920 USD would confirm the bearish one.
Will gold reach 5,000 USD per ounce again?
The institutional consensus supports a return to 5,000 USD and above: J.P. Morgan and Deutsche Bank target 6,000 USD, Wells Fargo 5,300-5,500 USD, and UBS and Morgan Stanley 5,200 USD by year-end 2026. Technically, the path needs a breakout above 4,500 USD, then 4,750 USD and the 4,855 USD April resistance. Further Fed hikes, starting with the 27-28 October meeting, are the main obstacle.
Why is gold falling in September 2026?
The decline reflects Fed policy and the dollar. On 16 September the Fed raised the rate by 25 basis points to 4.00%, its first hike since 2023, and markets price a 54.2% chance of another hike in October. The US Dollar Index rose to a two-month high near 100.8. Demand stays firm: gold ETFs have recorded 11 weeks of inflows to a record 4,189 tonnes, and central banks bought 288.9 tonnes in Q2 2026.
What is the XAUUSD forecast for 2026?
RoboForex Analysis Department places the 2026 range at 3,942-5,597 USD with a bullish bias, conditional on price holding above the 3,920 USD signal barrier and confirming a breakout above 4,500 USD. The institutional consensus: J.P. Morgan and Deutsche Bank target 6,000 USD, Wells Fargo 5,300-5,500 USD, UBS and Morgan Stanley 5,200 USD, Goldman Sachs 4,900 USD, Bank of America 4,800 USD, and Citi Research 4,500-5,000 USD.
How is the XAUUSD forecast on this page prepared?
This forecast combines technical analysis across the Daily, H4 and Weekly timeframes (MA 65/200, RSI 14, MACD 12/26/9 and Stochastic) with fundamental drivers (Fed policy, WGC central bank data, ETF flows, DXY and geopolitics) and published forecasts from major investment banks. The article is reviewed and updated regularly by RoboForex Analysis Department.
What is XAUUSD?
XAUUSD is the trading symbol for gold priced in US dollars, where XAU is the international ISO code for gold (from the Latin Aurum) and USD is the US dollar. The XAUUSD price shows how many dollars one troy ounce of gold (31.1 grams) costs on the spot market. It is one of the most liquid instruments in global financial markets, traded 24 hours a day, five days a week.
What is the difference between an XAUUSD forecast and a gold price forecast?
They refer to the same thing: the XAUUSD price is the spot price of gold in US dollars per troy ounce. XAUUSD forecast is the term preferred by forex and CFD traders, while gold price forecast is more common among investors in physical gold or ETFs. The same technical and fundamental factors drive both.
Forecasts presented in this section only reflect the author’s private opinion and should not be considered as guidance for trading. RoboForex bears no responsibility for trading results based on trading recommendations described in these analytical reviews.