Goldman Sachs stock is trading at an all-time high. Does it have the potential for further growth?
Goldman Sachs Group, Inc. (NYSE: GS) stock broke above the 416.50 USD resistance level on 23 April 2024 and headed upwards, reaching new all-time highs. Price growth was driven by the Q1 2024 report released on 15 April. What factors are prompting market participants to buy the bank’s shares at their peak prices, and is there a possibility that the uptrend will persist? Let us delve into this as part of the GS comprehensive fundamental analysis.
Goldman Sachs Group’s Q1 2024 quarterly report
Goldman Sachs Group released its Q1 2024 financial results on 15 April 2024. Below is the report data compared to the corresponding period in 2023:
- Revenue – 14.21 billion USD (+16%)
- Earnings per share – 11.58 USD (+32%)
- Net earnings – 4.10 billion USD (+28%)
Revenue by segment:
- Global Banking & Markets – 9.70 billion USD (+ 15%)
The Global Banking & Markets segment includes revenues from investment banking (mergers and acquisitions, bond and stock flotation, and consulting on strategic issues), securities trading (stocks, bonds, and derivatives), asset management, and other services provided by the investment bank - Asset & Wealth Management – 3.80 billion USD (+18%)
Asset & Wealth Management comprises revenues generated from asset management services. This may include fees for investment portfolio management, financial planning, retail and corporate asset management, and revenues from selling financial products such as mutual funds, ETFs, structured products, and other investment products - Platform Solutions – 0.69 billion USD (+24%)
Platform Solutions include revenues from providing clients with various financial platforms and technology solutions. This may be revenues from giving access to trading platforms, technological infrastructure for trading in financial markets, cloud computing, cybersecurity services, analytical instruments, and other financial technologies
Chairman and CEO David Solomon singled out Global Banking & Markets at a press conference as he has been waiting for a revival in this area for two years. The segment units with the most significant gains are listed below:
- Equity underwriting – 370 million USD (+45%)
- Debt underwriting – 688 million USD (+38%)
- Investment banking fees – 2.00 billion USD (+32%)
While the Global Banking & Markets segment showed the smallest revenue increase in percentage terms, it saw a rise of 1.20 billion USD in revenue, the most significant value compared to other sectors.
Subdivisions providing underwriting services for IPOs and bond sales have demonstrated the most significant gains of 45% and 38%, respectively. Following these is the merger and acquisition services segment, which saw 32% growth. This suggests that following a lull that started in 2022, companies are gradually returning to capital markets, and investors are taking an interest in risky assets.
GS analysis: Q1 2024 IPO, merger, and acquisition data
The bank’s management stated that companies and investors are returning to capital markets, as reflected in the Q1 2024 statistics. Below is the diagram showing the number of IPOs in the US from Q1 2020 to Q1 2024.
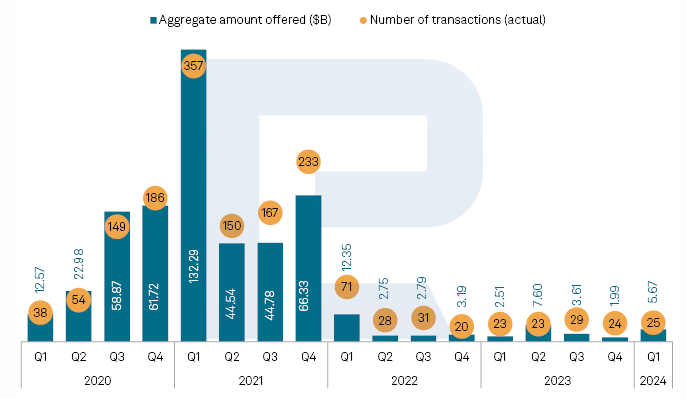
Number of IPOs in the US stock exchanges
The IPO peak occurred in Q1 2021 and was followed by a decline, which lasted until Q4 2023 inclusive. The trend reversed in Q1 2024, with 25 companies going public and raising 5.67 billion USD, 184% more than in the previous quarter and 125% higher than in the corresponding quarter in 2023.
The M&A (merger and acquisition) sector is also witnessing positive developments. Citing data from Dealogic, Reuters informed in its article that total merger and acquisition volumes increased by 30% in Q1 2024, reaching approximately 755.10 billion USD compared to the corresponding period in 2023.
The Federal Reserve’s interest rate and its potential impact on Goldman Sachs’s revenue
As of 12 June 2024, the interest rate in the US is 5.5%, representing the highest reading since 2001. Under elevated interest rate conditions, banks can benefit from high rates on loans granted. However, this segment of Goldman Sachs experienced an 11% revenue decline in Q1 2024 from Q1 2023, down to 1.6 billion USD. This decline was caused by increased client deposit rates, which significantly lagged behind loan interest rates.
Elevated interest rates complicate the operations of financially weak companies that resort to raising additional funding by selling bonds or agreeing to merge with other companies. The negative impact of elevated interest rates can be seen in the number of bankruptcies in the US.
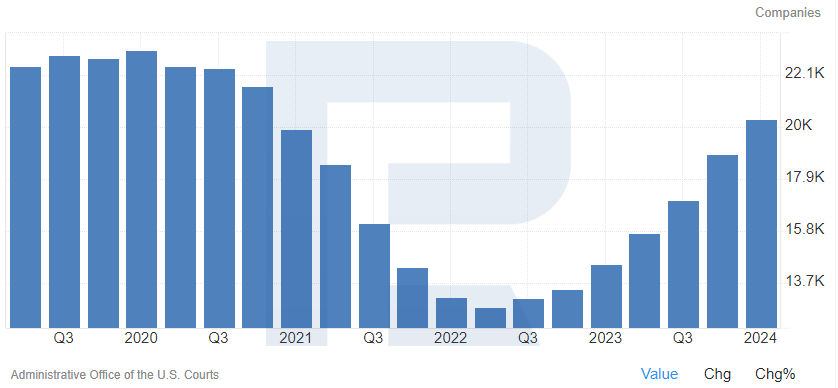
Bankruptcies in the US
The robust employment market and inflation above the 2% target suggest that the Federal Reserve may delay the interest rate reduction or even proceed to another round of monetary policy tightening. As a result, the position of financially weak companies will remain unstable, indirectly driving up the number of M&A deals and bond flotations in the market. Therefore, revenues from Goldman Sachs’s Global Banking & Markets segment have a strong potential for further growth.
Technical analysis and Goldman Sachs stock forecast
Goldman Sachs stock is trading within an ascending channel on the weekly timeframe. A correction that started in January 2021 and ended in November 2023 was shaped as a triangle. The upper boundary of the pattern was breached on 27 November 2023, signalling a price rise. According to the triangle, the estimated target was 470 USD per share. The price reached this target relatively fast and halted its ascent. Given an aggressive upward price movement, a correction is expected in this situation, with the stock price potentially declining to the nearest 400 USD support level. A rebound from this level will signal the completion of the correction and the beginning of another growth wave, aiming for new all-time highs.
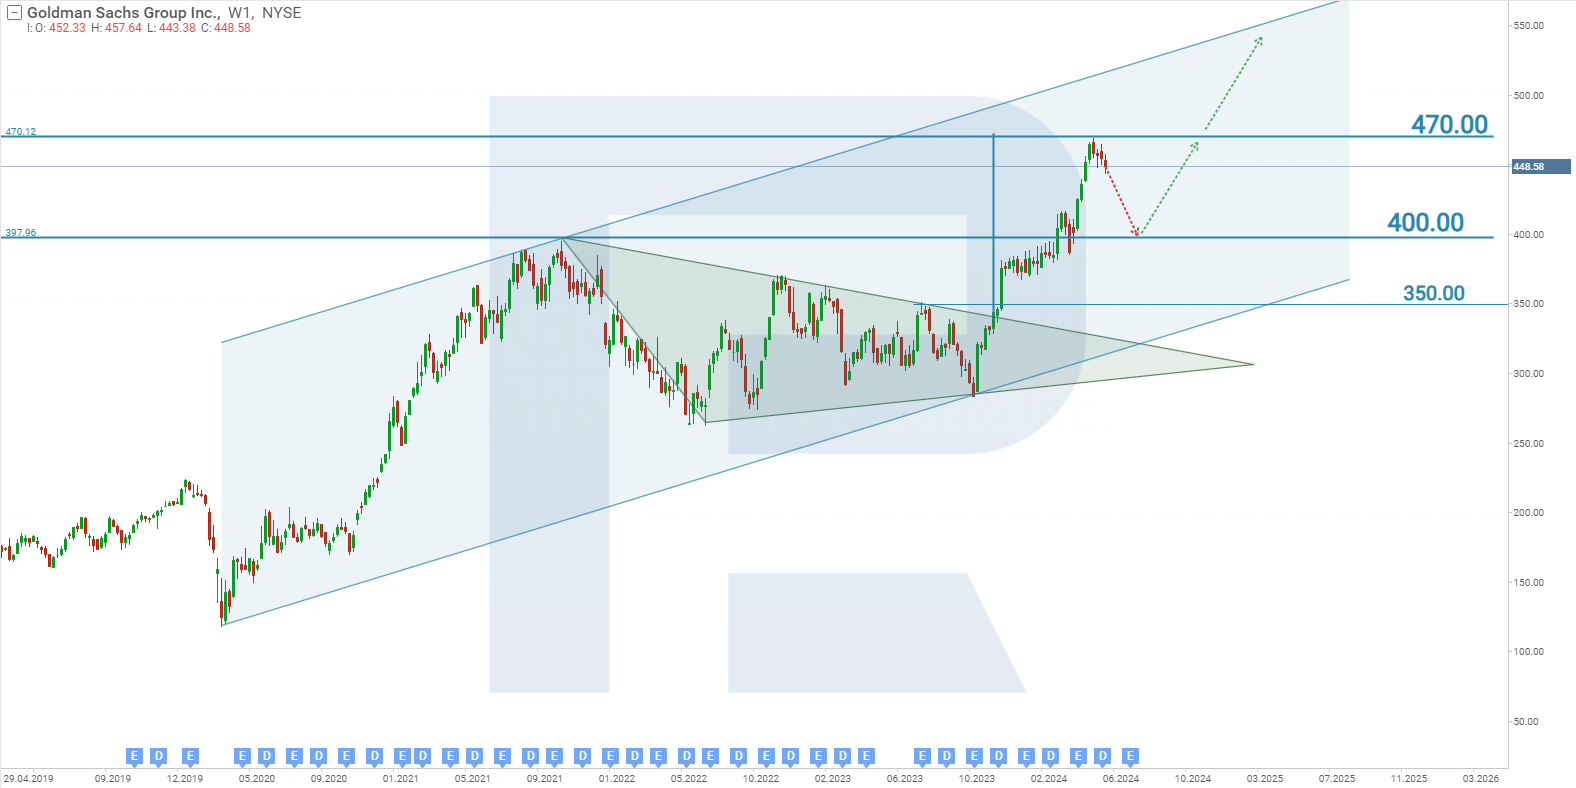
Goldman Sachs Group, Inc.’s stock chart
Summary: prospects for Goldman Sachs stock
Goldman Sachs stock enjoyed favourable conditions in capital markets in Q1 2024. The bank took advantage of the situation, which positively affected its revenue. Propelled by these conditions, the stock headed up and boosted its growth after the release of the quarterly report.
We are currently awaiting the Q2 data, scheduled for 15 July. Earnings per share are projected to rise by 188% from the corresponding period last year and amount to 8.87 USD, with revenues reaching 12.76 billion USD, showing a 17.12% growth from the corresponding period in 2023.
Given the 16% increase in the stock price since the Q1 report release date, the above expectations may be said to be factored into the stock price. The bank must align with these or exceed them; otherwise, the stock price will inevitably fall.
The bank’s management reported that overall, the potential for a further increase in revenue persists in 2024, which is encouraging news for long-term investors as it increases the prospects of the uptrend continuing further.
Forecasts presented in this section only reflect the author’s private opinion and should not be considered as guidance for trading. RoboForex bears no responsibility for trading results based on trading recommendations described in these analytical reviews.