Apple – earnings analysis and stock forecast for 2026
Apple delivered its strongest quarterly results on record, exceeding expectations for revenue and earnings. However, its premium valuation leaves the shares highly sensitive to growth forecasts for 2026
Apple Inc. (NASDAQ: AAPL) delivered record results for the Q1 2026 financial year (quarter ended 27 December 2025). Revenue reached 143.8 billion USD (+16% year-on-year), net income totalled 42.10 billion USD, and earnings per share came in at 2.84 USD (+19% year-on-year). Market expectations had been more conservative – around 138.4 billion USD in revenue and 2.68 USD in EPS – making the report significantly stronger than forecasts.
The primary driver of growth was the iPhone, which generated 85.27 billion USD in revenue (+23% year-on-year), alongside Services, which rose to 30.01 billion USD (+14% year-on-year). Mac sales declined to 8.39 billion USD (–7% year-on-year), while iPad revenue increased to 8.60 billion USD (+6% year-on-year). The Wearables, Home and Accessories segment amounted to 11.49 billion USD (–2% year-on-year). Management noted that the iPhone delivered the strongest quarter in its history, Services reached a new record, and the installed base exceeded 2.5 billion active devices, reinforcing the stability of recurring ecosystem revenue.
Apple also demonstrated robust cash generation, with operating cash flow reaching 54 billion USD during the quarter. Around 32 billion USD was returned to shareholders through dividends and share buybacks.
For the Q2 2026 financial year, management expects total revenue growth of 13–16% year-on-year and gross margin of 48–49%, anticipating that Services growth will remain broadly in line with the December quarter.
This article reviews Apple Inc., provides a fundamental analysis of its financial reports, and presents a technical analysis of Apple shares, forming the basis for the Apple 2026 stock forecast.
About Apple Inc.
Apple Inc. is a US company founded in 1976 by Steve Jobs, Stephen Wozniak, and Ronald Wayne. Initially, it focused on manufacturing personal computers but later expanded its operations to become the leader in the consumer electronics industry. Apple is renowned for its innovative devices – the iPhone, iPad, Mac, Apple Watch, and AirPods – and its unique ecosystem, which integrates these products into its existing services.
Apple went public on the NASDAQ on 12 December 1980 under the AAPL ticker symbol. The company raised approximately 100 million USD, marking it as one of the largest and most successful initial public offerings of its time.
Consistent investor demand drove up Apple’s share value, eventually limiting the number of participants who could afford them. As a result, the company has conducted four stock splits in its history, each time lowering the share value and increasing the number of shares. In 1980, there were approximately 4.6 million shares in circulation; by 2024, this figure had exceeded 15 billion.
In addition to investor demand, Apple generates market demand for its stock through share buybacks. This strategy enables the company to reduce the total number of outstanding shares, thereby increasing earnings per share for the remaining stock and making the securities more appealing to investors. Since Apple introduced its share buyback program in 2012, it has allocated approximately 700 billion USD to this initiative, making it one of the world’s leading companies in terms of buyback volume, surpassing major corporations across other sectors.
The stock buyback is financed through free cash flow and low-interest loans.

Apple Inc.’s main revenue streams
In 2025, the company’s revenue came from the following streams:
- iPhone: the primary source of income, generating about half of the company’s total revenue due to its popular smartphone models.
- iPad and Mac: earnings from tablet and computer sales for both personal and business use. Although their share of total revenue has declined, they remain a vital part of Apple’s business model.
- Wearables, Home and Accessories: revenue from sales of Apple Watch, AirPods, and other accessories, including MagSafe and apps for iPhone, Mac, and iPad.
- Services: a rapidly expanding area that includes subscriptions to Apple Music, Apple TV+, iCloud, App Store, and other services. Services have become one of the company’s most profitable revenue streams.
- Financial services: Apple is constantly improving its financial products, such as the Apple Pay payment system and Apple Card credit cards, and actively expanding its offerings in this area in 2024.
- Products for businesses and corporate services: Apple offers a range of devices and services tailored for corporate clients, including businesses, educational institutions, and healthcare organisations.
Conclusion: based on the above, Apple generates revenue from manufacturing and selling hardware devices, as well as earning from digital service subscriptions and commissions on App Store transactions.
Apple Inc. Q4 2024 financial results
Apple reported strong financial results for Q4 of the 2024 fiscal year. Below are the key figures from the report:(https://investor.apple.com/investor-relations/default.aspx):
- Revenue: 94.93 billion USD (+6%)
- Net income: 14.73 billion USD (–36%)
- Earnings per share: 0.97 USD (–34%)
- Operating profit: 29.59 billion USD (+9%)
Revenue by segment:
- iPhone: 46.22 billion USD (+5%)
- Mac: 7.74 billion USD (+2%)
- iPad: 6.95 billion USD (+8%)
- Wearables, Home and Accessories: 9.04 billion USD (–3%)
- Services: 24.97 billion USD (+12%)
Revenue by region:
- Americas: 41.66 billion USD (+4%)
- Europe: 24.92 billion USD (+11%)
- Greater China: 15.03 billion USD (–1%)
- Japan: 5.92 billion USD (+8%)
- Rest of Asia Pacific: 7.38 billion USD (+16%)
Nearly all metrics, except for data from the Wearables, Home and Accessories segments, demonstrated growth. However, the company’s net profit still dropped by 36%. This decline was due to a 10.2 billion USD fine imposed by the European Union. Excluding this one-off payment, the net profit growth in Q4 2024 would have been 8%.
The company provided a conservative forecast for the next quarter. Revenue is expected to grow in the low to mid-single digits year-on-year, service income is anticipated to reach double-digit figures, and gross profit is forecast to be 46–47%, 1–2% higher than the previous quarter.
Apple Inc. Q1 2025 financial results
Apple released its Q1 2025 earnings report on 30 January 2025. The key report data is outlined below: (https://investor.apple.com/investor-relations/default.aspx):
- Revenue: 124.30 billion USD (+4%)
- Net income: 36.33 billion USD (+7%)
- Earnings per share: 2.40 USD (+10%)
- Operating profit: 42.83 billion USD (+6%)
Revenue by segment:
- iPhone: 69.13 billion USD (–1%)
- Mac: 8.99 billion USD (+15%)
- iPad: 8.09 billion USD (+15%)
- Wearables, Home and Accessories: 11.75 billion USD (–2%)
- Services: 26.34 billion USD (+14%)
Revenue by region:
- Americas: 52.44 billion USD (+4%)
- Europe: 33.86 billion USD (+11%)
- Greater China: 18.51 billion USD (–11%)
- Japan: 8.98 billion USD (+15%)
- Rest of Asia Pacific: 10.29 billion USD (+1%)
In its Q2 2025 forecast, Apple anticipates revenue growth in the low to mid-single digits year-on-year. Given the Q2 2024 revenue of 95 billion USD, this suggests a range of approximately 98 to 100 billion USD. Services revenue was expected to grow in the low single digits.
Based on the report data, Apple delivered record financial results in Q1 2025 despite challenges in certain segments. Total revenue rose by 4% to an all-time high of 124.3 billion USD, while EPS increased by 10% to 2.40 USD, exceeding analysts’ expectations.
The iPhone segment saw a modest decline in revenue, suggesting stagnant demand or a weaker-than-expected reception for the new iPhone 16 line-up. Mac sales grew, driven by new models featuring M4 chips. The iPad segment also expanded, benefiting from model upgrades. Conversely, the Wearables, Home and Accessories segment declined, possibly indicating market saturation or intensifying competition. Apple’s services, including the App Store, Apple Music, iCloud, and AppleCare, posted strong growth, highlighting the company’s strategic shift towards diversifying revenue through subscriptions and services.
Sales in China fell sharply by 11%, reflecting difficulties in this market due to local competition and potential geopolitical factors. However, growth in other regions, including the Americas, Europe, and Asia-Pacific, helped offset some losses. Overall, Apple reaffirmed its resilience and growth potential despite various market challenges.
Apple Inc. Q2 2025 financial results
Apple released its Q2 2025 financial year results on 1 May 2025. Below are the key figures from the report compared with the same period in 2024: (https://investor.apple.com/investor-relations/default.aspx):
- Revenue: 95.35 billion USD (+5%)
- Net income: 24.78 billion USD (+5%)
- Earnings per share: 1.65 USD (+8%)
- Operating profit: 29.58 billion USD (+6%)
Revenue by segment:
- Net sales Products: 68.71 billion USD (+3%)
- Net sales Services: 26.65 billion USD (+12%)
- iPhone: 46.84 billion USD (+2%)
- Mac: 7.95 billion USD (+7%)
- iPad: 6.40 billion USD (+15%)
- Wearables, Home and Accessories: 7.52 billion USD (–5%)
Revenue by region:
- Americas: 40.31 billion USD (+8%)
- Europe: 24.45 billion USD (+1%)
- Greater China: 16.00 billion USD (–2%)
- Japan: 7.30 billion USD (+16%)
- Rest of Asia Pacific: 7.29 billion USD (+8%)
Apple Inc.’s report Q2 2025 report for the financial year revealed a combination of solid growth and emerging challenges. Revenue reached 95.4 billion USD, a 5% increase compared to the same period last year, while earnings per share rose by 8% to 1.65 USD.
The services division performed particularly well, achieving record figures. Revenue amounted to 26.65 billion USD, up 12% year-on-year, underscoring Apple’s successful strategic shift towards stable, recurring income streams. As of May 2025, the number of paid subscriptions exceeded 1 billion. iPhone sales also demonstrated resilience, increasing by 2% to 46.84 billion USD despite a 2% decline in sales in China, offset by growth in the Americas and Japan.
Nevertheless, the company encountered several notable challenges. First, the potential imposition of new tariffs in the US, particularly on products assembled in China, could significantly impact the Q3 2025 results of the financial year. Apple estimates that if the proposed package of tariff measures within the revised US trade policy is implemented, the company’s total costs could reach 900 million USD as early as the June quarter. These expenses are related to the rising costs of components manufactured or assembled in China, including key device categories such as the iPhone, MacBook, and accessories. This increase in expenses could reduce margins and affect retail prices, potentially impacting demand. Apple’s management has openly expressed concern, particularly amid ongoing geopolitical tensions and uncertainty in US-China trade relations. The company is accelerating the reorganisation of its supply chain, including shifting iPhone assembly for the US market to India, though this transition requires time and investment.
Secondly, the ongoing antitrust investigation and legal proceedings concerning the App Store’s structure and terms for third-party developers could potentially affect the services business, as the App Store is a key component of this rapidly growing revenue category.
Thirdly, Apple is experiencing delays in launching the updated version of its voice assistant Siri, which was highly anticipated in the context of generative AI development. These difficulties created uncertainty around the company’s upcoming innovations in user experience and artificial intelligence.
Looking ahead, Apple forecast Q3 2025 revenue growth in the low- to mid- single-digit range, with an expected gross margin between 45.5% and 46.5%. This projection reflected the company’s cautious optimism amid market pressure and internal challenges.
A positive development for Apple shareholders was the announcement of a substantial share buyback program worth 110 billion USD, alongside a 4% increase in quarterly dividends to 0.26 USD per share.
Apple Inc. Q3 2025 financial results
Apple released its results for Q3 of the 2025 financial year on 31 July 2025. Below are the key figures compared to the same period in 2024: (https://investor.apple.com/investor-relations/default.aspx):
- Revenue: 94.03 billion USD (+10%)
- Net income: 23.43 billion USD (+10%)
- Earnings per share: 1.57 USD (+12%)
- Operating profit: 28.20 billion USD (+11%)
Revenue by segment:
- Net sales Products: 66.61 billion USD (+8%)
- Net sales Services: 27.42 billion USD (+13%)
- iPhone: 44.58 billion USD (+13%)
- Mac: 8.05 billion USD (+15%)
- iPad: 6.58 billion USD (–8%)
- Wearables, Home and Accessories: 7.40 billion USD (–8%)
Revenue by region:
- Americas: 41.20 billion USD (+9%)
- Europe: 24.01 billion USD (+10%)
- Greater China: 15.37 billion USD (+4%)
- Japan: 5.78 billion USD (+13%)
- Rest of Asia Pacific: 7.67 billion USD (+20%)
Apple’s Q3 2025 financial report set a record for this period. Revenue rose to 94 billion USD, up 10% year-on-year and exceeding consensus expectations. Net income reached 23.4 billion USD, while earnings per share grew 12% year-on-year to 1.57 USD. iPhone sales increased by 13% to 44.6 billion USD, with services achieving an all-time high of 27.4 billion USD.
Apple management issued an optimistic outlook for the next reporting period. For Q4 2025, total revenue growth was projected to be in the mid- to high-single-digit range compared with the previous year. The gross margin was expected to remain within the 46–47% range, despite the company setting aside nearly 1.1 billion USD for new tariffs.
Apple Inc. Q4 2025 financial results
On 30 October 2025, Apple released its Q4 earnings report for fiscal year 2025. The key figures compared with the same period of fiscal 2024 are as follows:
- Revenue: 102.47 billion USD (+8%)
- Net income: 27.47 billion USD (+10%)*
- Earnings per share (EPS): 1.85 USD (+13%)*
- Operating profit: 32.43 billion USD (+10%)
Revenue by segment:
- Net sales – Products: 73.72 billion USD (+5%)
- Net sales – Services: 28.75 billion USD (+15%)
- iPhone: 49.03 billion USD (+6%)
- Mac: 8.73 billion USD (+13%)
- iPad: 6.95 billion USD (0%)
- Wearables, Home and Accessories: 9.01 billion USD (0%)
Revenue by region:
- Americas: 44.19 billion USD (+6%)
- Europe: 28.70 billion USD (+15%)
- Greater China: 14.49 billion USD (−4%)
- Japan: 6.64 billion USD (+12%)
- Rest of Asia Pacific: 8.44 billion USD (+14%)
*Growth in net income and EPS is calculated on a non-GAAP basis, with 2024 adjusted for the one-off EC tax penalty.
Apple closed fiscal Q4 2025 with a robust quarter: revenue rose 8% year-on-year, and adjusted EPS increased 13% year-on-year (excluding the one-off EC tax charge).
This was a record September quarter for revenue, iPhone sales, and earnings per share – effectively a successful finish to a record-breaking year, with annual revenue of around 416 billion USD and double-digit EPS growth. Gross margin rose to 47.2%, at the upper end of guidance, showing that the company not only returned to growth but also strengthened profitability despite tariff pressures and increasing investment costs.
Within the quarter, performance appeared well balanced. iPhone revenue reached around 49 billion USD, showing solid growth following the launch of the iPhone 17 line-up – even though only a week of sales was included in the reporting period.
Mac revenue totalled 8.7 billion USD, delivering double-digit growth driven by the rollout of M5-based models. In contrast, iPad remained flat.
The main growth driver was Services, with revenue reaching a record 28.8 billion USD, up about 15% year-on-year. For the full year, Services revenue approached 110 billion USD and now contributes a disproportionately large share of profit, thanks to margins above 70%.
Geographically, China remained the weak spot, with regional revenue down roughly 4% amid tougher competition from local brands and temporary supply constraints.
Meanwhile, sales in several emerging markets – including India – continued to grow rapidly, and the active device base reached new highs across all categories, underscoring the strength of Apple’s ecosystem.
In fiscal Q4 2025, capital expenditure rose to 12.7 billion USD, up 35% year-on-year, largely due to spending on AI infrastructure, chip development, and new data centres. While competitors were investing far more aggressively, Apple remained relatively disciplined. Management openly highlighted the significant increase in capital expenditure due to AI initiatives and outlined plans to launch a more advanced Siri and other AI-powered features in 2026. Financially, this poses no challenge: even with annual capex of around 14 billion USD or higher in fiscal 2026, Apple maintains a vast liquidity buffer and strong free cash flow, meaning the risk of balance-sheet strain remains minimal.
The main risks lie in how quickly these investments will start generating new service revenues and monetisable features.
Management provided an aggressive outlook for the next quarter (Q1 of fiscal 2026), with CEO Tim Cook expecting total revenue to grow by 10–12% year-on-year, alongside double-digit iPhone sales growth, which is significantly above the pre-report consensus. He also guided for a gross margin in the 47–48% range, that is, at or above the current quarter’s level. Management also expects China to return to growth in Q1, while Services will maintain double-digit growth rates.
Apple Inc. Q1 2026 financial results
On 29 January 2025, Apple released its report for Q1 2026 (financial year ended 27 December 2025). Below are the key figures from the report compared to the same period in the 2025 financial year:
- Revenue: 143.75 billion USD (+16%)
- Net income: 42.10 billion USD (+15%)
- Earnings per share: 2.84 USD (+19%)
- Operating profit: 50.85 billion USD (+19%)
Revenue by segment:
- Net sales – Products: 113.74 billion USD (+16%)
- Net sales – Services: 30.01 billion USD (+14%)
- iPhone: 85.27 billion USD (+23%)
- Mac: 8.39 billion USD (–7%)
#. iPad: 8.60 billion USD (+6%)
- Wearables, Home, and Accessories: 11.49 billion USD (–2%)
Revenue by region:
- Americas: 58.53 billion USD (+11%)
- Europe: 38.15 billion USD (+12%)
- Greater China: 25.53 billion USD (+38%)
- Japan: 9.41 billion USD (+5%)
- Rest of Asia Pacific: 12.14 billion USD (+18%)
Apple delivered one of the strongest quarters in its history in Q1 2026, confirming the resilience of its business model even amid a slowdown in global consumer demand. Record revenue and a clear beat versus consensus forecasts suggest that the market had underestimated both demand for flagship products and the scale of ecosystem monetisation.
The key driver of performance was the iPhone, which posted the strongest quarter in the segment’s history. This is particularly significant given the maturity of the global smartphone market. Services also set a new all-time high, reinforcing Apple’s strategic shift towards more predictable and higher-margin revenue streams. An installed base of over 2.5 billion active devices further strengthens this trend, making Services growth structural rather than cyclical.
At the same time, weakness in certain hardware categories, such as Mac and wearables, does not appear critical. These segments remain secondary to iPhone and Services and are more exposed to demand fluctuations between upgrade cycles. Importantly, the broader ecosystem continues to generate substantial operating cash flow, enabling Apple to invest in long-term development and to aggressively return capital to shareholders through dividends and share buybacks.
In its outlook for Q2 2026, Apple expects year-on-year total revenue growth in the 13–16% range, implying sustained demand following the record December quarter. Gross margin is forecast at 48–49%, remaining close to the upper end of Apple’s historical range. Management also specifically noted that Services revenue in Q2 2026 is expected to grow at a pace comparable to the December quarter, approximately 14% year-on-year.
On the hardware side, the forecast implies a more normalised trajectory following an exceptionally strong iPhone quarter. The company does not assume a repeat of record growth rates, but equally does not signal a sharp cooling in demand.
Overall, Apple’s Q2 2026 outlook appears well balanced, combining double-digit revenue growth, very strong gross margins, and continued expansion of the Services business.
Analysis of key valuation multiples for Apple Inc.
Below are the key valuation multiples for Apple Inc. based on Q1 2026 results, calculated using a share price of 276 USD.
| Multiple | What it indicates | Value | Commentary |
|---|---|---|---|
| P/E (TTM) | Price paid for 1 USD of earnings over the past 12 months | 35 | ⬤ For Apple, this represents a premium valuation: the market is already pricing in strong and sustainable profitability. |
| P/S (TTM) | Price paid for 1 USD of annual revenue | 9.32 | ⬤ High for a hardware + services business: the price implies that growth and margins must remain very strong. |
| EV/Sales (TTM) | Enterprise value to sales, accounting for debt | 9.4 | ⬤ Even after accounting for the capital structure, the valuation remains elevated. |
| P/FCF (TTM) | Price paid for 1 USD of free cash flow | 32.9 | ⬤ Expensive even with robust free cash flow: if FCF growth slows, the share price could correct faster than the underlying business. |
| FCF Yield (TTM) | Free cash flow yield to shareholders | 3.0% | ⬤ Moderate. Risk-free US government bonds currently yield around 4%. |
| EV/EBITDA (TTM) | Enterprise value to operating profit before depreciation and amortisation | 26.7 | ⬤ Premium valuation for a large, mature company. |
| EV/EBIT (TTM) | Enterprise value to operating profit | 28.9 | ⬤ High: the market is paying for quality and predictability, but the margin for error is limited. |
| P/B | Price to book value | 46 | ⬤ For Apple, this metric is of limited usefulness, as equity has been significantly reduced through share buybacks. |
| Net Debt/EBITDA | Debt burden relative to EBITDA | 0.15 | ⬤ A very low ratio, indicating a strong financial position and low debt burden. |
| Interest Coverage (TTM) | Ability to cover interest expenses with operating profit | n/a | ⬤ In Apple’s reporting, interest expenses are not disclosed in a format that allows for a straightforward direct calculation. |
Apple valuation multiples analysis – conclusion
Apple remains a business of exceptionally high quality, with strong operating profit, substantial free cash flow, and a low debt burden. However, based on valuation multiples, the stock is already at a premium – the market has already priced in the continuation of high margins and strong growth dynamics, which increases sensitivity to any signs of a slowdown in revenue or earnings. Even a strong report may fail to drive the share price higher if expectations exceed the actual results.
An important mitigator of this risk is Apple’s large-scale share buyback program. The company is systematically reducing its share count, which supports EPS and creates consistent market demand. Over the next year, this increases the stock’s resilience and the likelihood of a quicker recovery after corrections. However, buybacks do not negate the risk of multiple compression: if growth and margins begin to disappoint significantly, the buyback will likely cushion the decline rather than prevent it entirely.
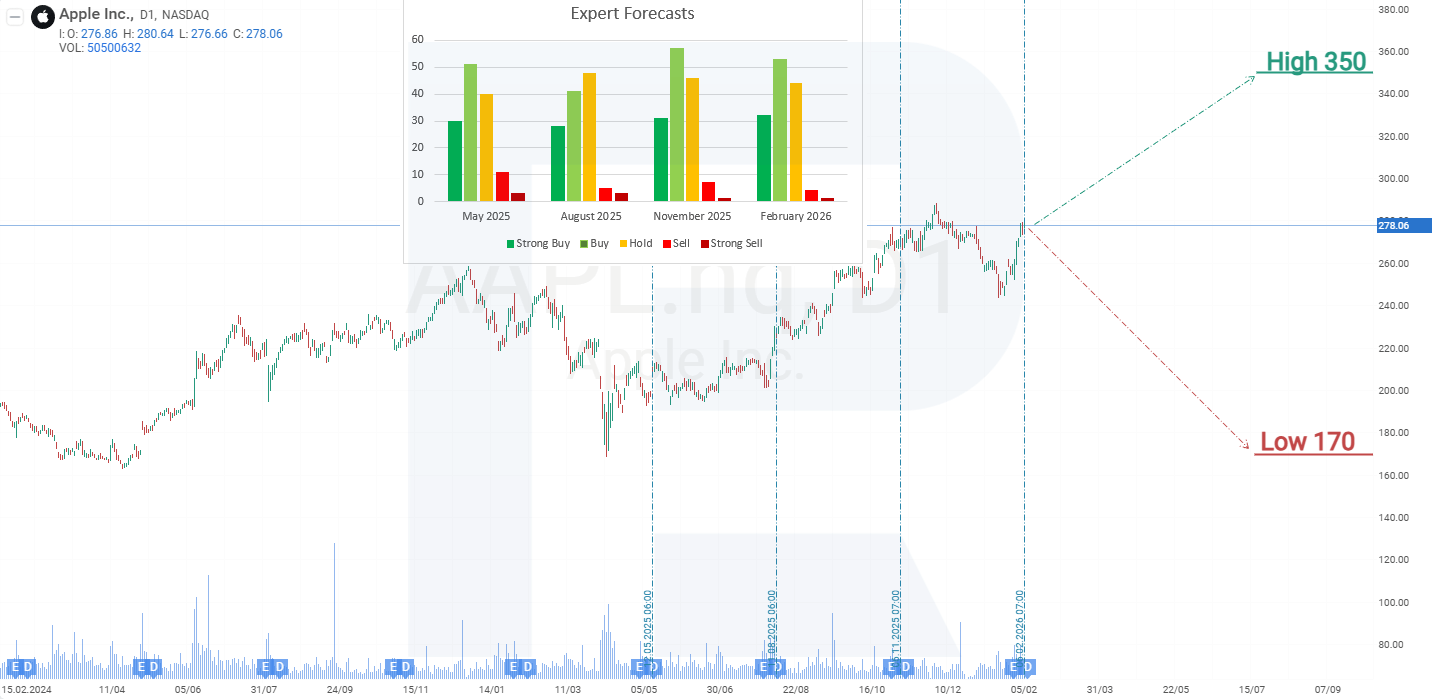
Expert forecasts for Apple Inc. shares in 2025
- Barchart: 22 out of 42 analysts rated Apple shares as Strong Buy, 3 as Moderate Buy, 16 as Hold, and 1 as Strong Sell. The upper price target is 350 USD, while the lower bound is 230 USD.
- MarketBeat: 24 out of 36 analysts assigned a Buy rating to the shares, 11 recommended Hold, and 1 recommended Sell. The upper price target is 350 USD, and the lower bound is 170 USD.
- TipRanks: 17 out of 27 analysts recommended Buy, 9 recommended Hold, and 1 recommended Sell. The upper price target is 350 USD, with the lower bound at 239 USD.
- Stock Analysis: 10 out of 29 analysts rated the shares as Strong Buy, 9 as Buy, 8 as Hold, and 2 as Sell. The upper price target is 350 USD, while the lower bound is 200 USD.
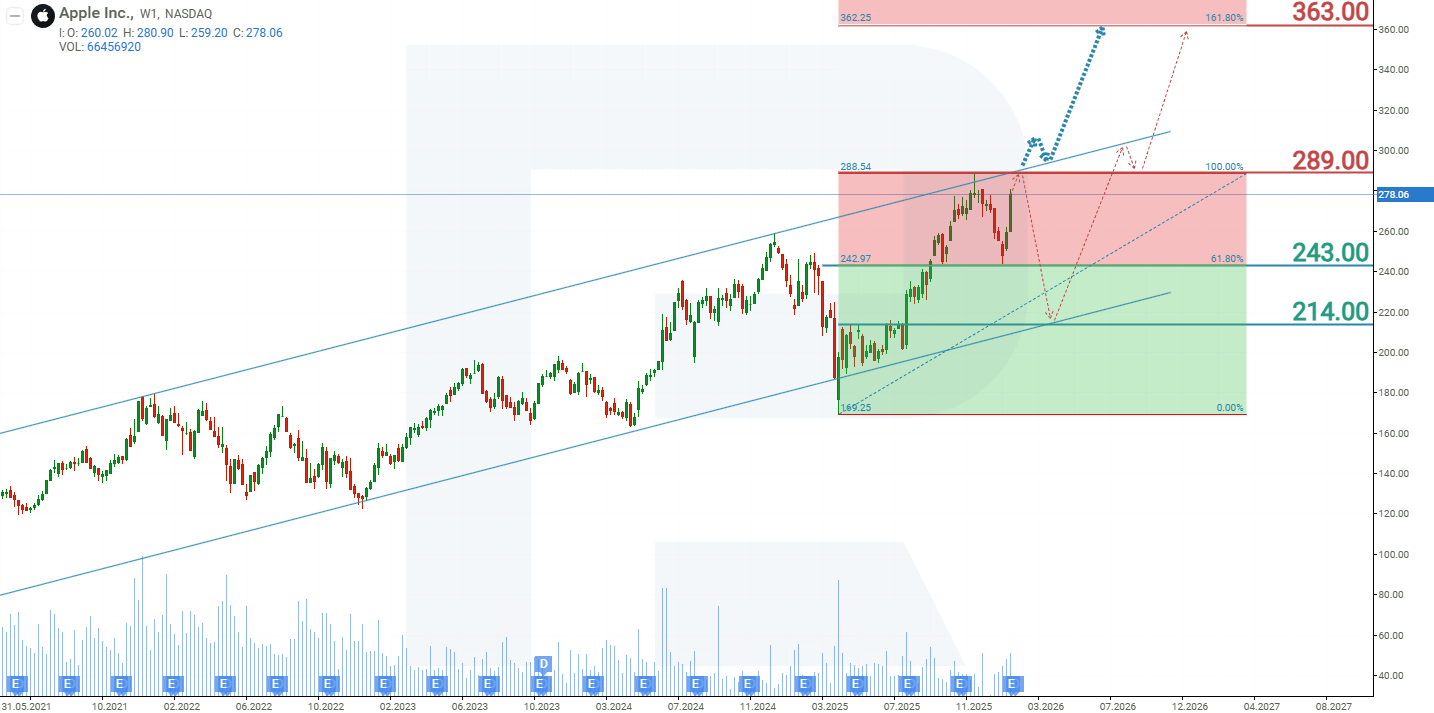
Technical analysis and 2026 forecast for Apple Inc. stock
On the weekly chart, Apple shares are trading within an ascending channel. After reaching the upper boundary of the channel, the stock moved lower, correcting to the support level at 243 USD. The publication of the quarterly report helped to complete the correction and subsequent price growth, bringing the stock price closer to its all-time high of 289 USD. Based on the current performance of Apple shares, the possible price scenarios for 2026 are as follows:
The base-case forecast for Apple shares suggests a breakout above the 289 USD resistance level. In this case, further price growth towards 363 USD is expected. This level was determined using Fibonacci retracement lines.
The alternative forecast for Apple stock suggests a rejection at the 289 USD resistance level. This may indicate weak investor interest in the company’s shares at this level, leading to a potential decline in AAPL prices towards 214 USD, from which a recovery to the historical high is expected.
Forecasts presented in this section only reflect the author’s private opinion and should not be considered as guidance for trading. RoboForex bears no responsibility for trading results based on trading recommendations described in these analytical reviews.