How Coca-Cola's stock price will change in 2026: technical and fundamental analysis
Coca-Cola retains its status as a defensive asset with a stable cash flow; however, its premium valuation limits growth potential. The technical outlook suggests a decline in share prices is likely before a new phase of the uptrend begins.
The Coca-Cola Company reported mixed results for Q4 2025. Net revenue increased by 2% to 11.82 billion USD but fell short of market expectations. However, comparable earnings per share (non-GAAP EPS) increased by 6% to 0.58 USD, exceeding forecasts. The growth was driven by a 4% increase in concentrate sales, along with a 1% rise in prices and product mix. The stock market initially reacted with a decline in share prices after the report, as the overall results did not fully align with market expectations, despite the positive EPS performance.
Non-GAAP operating margin improved to 24.4%, up from 24.0% last year, thanks to effective cost control. Free cash flow for the year amounted to 5.3 billion USD, excluding a one-off payment for the acquisition of Fairlife, the figure stood at 11.4 billion USD.
Management highlighted successful marketing campaigns and growing market share in the non-alcoholic beverage segment. For 2026, the company expects organic revenue growth of around 5%. Key risks identified include currency fluctuations and potential weakening of consumer demand amid economic uncertainty.
This article examines The Coca-Cola Company, outlines its revenue sources, provides a summary of the company’s quarterly performance, and details expectations for the 2026 financial year. Additionally, a technical analysis of KO is conducted, forming the basis for a stock forecast for The Coca-Cola Company in 2026.
About The Coca-Cola Company
The Coca-Cola Company is one of the world’s largest producers of non-alcoholic beverages. It was founded in 1886 by pharmacist John Stith Pemberton in Atlanta, Georgia. The company went public in 1919, listing on the New York Stock Exchange under the ticker KO.
Coca-Cola manufactures, markets, and sells carbonated soft drinks, juices, water, energy drinks, sports drinks, and tea-based beverages. It owns a portfolio of more than 200 brands, including Coca-Cola, Fanta, Sprite, Minute Maid, and Powerade.
Key competitors include PepsiCo, Nestlé, Keurig Dr Pepper and, in certain categories, local beverage producers.

The Coca-Cola Company’s main financial streams
The Coca-Cola Company’s business model is based on a global franchising and beverage distribution system, with revenue generated from several key sources:
- Sales of concentrates and syrups: this is the company’s primary revenue source, encompassing the sale of concentrates, syrups, and base ingredients to independent bottling partners. These partners produce, bottle, package, and distribute beverages under the Coca-Cola brand. The company earns stable income from the high-margin nature of this segment.
- Sales of finished beverages: Coca-Cola holds stakes in several bottling companies (such as Coca-Cola FEMSA and Coca-Cola HBC) and, in some regions, manages production and distribution independently. Revenue is generated across the entire value chain – from manufacturing through to the sale of finished products.
- Licensing fees and royalties: the company receives income from licences and brand usage. Bottlers pay royalties for the right to sell products under brands such as Coca-Cola, Fanta, Sprite, and others.
- Sales of other non-alcoholic beverages: beyond carbonated drinks, Coca-Cola generates revenue from juices (Minute Maid), water (Dasani, Smartwater), tea and coffee (Gold Peak, Georgia Coffee), energy drinks (Monster, BodyArmor), and sports drinks (Powerade). These brands contribute income through both concentrates and the sale of finished products.
- Advertising and marketing partnerships: indirect revenue streams include participation in joint advertising campaigns with retailers and major distributors, which help to increase sales volumes.
Thus, Coca-Cola’s business model relies on scalability, strong brands, franchising, and a broad product portfolio, enabling revenue generation from both raw materials and finished goods.
The Coca-Cola Company Q1 2025 financial report
On 29 April, The Coca-Cola Company published its Q1 FY2025 report for the period ending 28 March. Below are the key financial figures compared with the same period last year:
- Revenue: 11.13 billion USD (–2%)
- Net profit (non-GAAP): 3.13 billion USD (+0%)
- Earnings per share: 0.73 USD (+1%)
- Operating margin: 33.8% (+120 basis points)
Revenue by country:
- Europe, Middle East & Africa: 2.66 billion USD (+1%)
- Latin America: 1.48 billion USD (–3%)
- North America: 4.36 billion USD (+3%)
- Asia Pacific: 1.42 billion USD (–4%)
Coca-Cola’s Q1 2025 financial report showed resilient operating results despite revenue pressure, with total revenue down 2% to 11.13 billion USD. The decline was primarily due to adverse currency effects and the refranchising of bottling operations to partners. Operating profit increased by 10%, with the operating margin rising to 33.8% from 31.8% the previous year, reflecting effective cost management, pricing strategy and benefits from refranchising.
Earnings per share rose by 1% to 0.73 USD, despite a significant negative currency impact of 5 percentage points. Global unit case volume grew by 2%, with robust growth recorded in India, China, and Brazil. Sales of Coca-Cola Zero Sugar increased by 14% across all regions.
Free cash flow was negative at –5.51 billion USD, primarily due to a one-off payment of 6.10 billion USD related to the Fairlife transaction. Excluding this item, free cash flow was 558 million USD.
Management reaffirmed its full-year 2025 guidance, forecasting organic revenue growth of 5-6% and non-GAAP EPS growth of 2–3%. Free cash flow was projected at around 9.50 billion USD. For Q2, the company indicated expected currency headwinds of about 3% on revenue and 5–6% on earnings per share.
The Coca-Cola Company Q2 2025 financial report
On 22 July, The Coca-Cola Company released its Q2 2025 financial report for the period ended 27 June. Below are the key financial results compared with the same period last year:
- Revenue: 12.53 billion USD (+5%)
- Net profit (non-GAAP): 3.77 billion USD (+4%)
- Earnings per share: 0.87 USD (+4%)
- Operating margin: 34.7% (+190 basis points)
Revenue by region:
- Europe, Middle East & Africa: 3.21 billion USD (+6%)
- Latin America: 1.61 billion USD (–1%)
- North America: 5.04 billion USD (+3%)
- Asia Pacific: 1.59 billion USD (+5%)
In Q2 2025, Coca-Cola outperformed expectations across key metrics. Revenue grew by 5%, driven by a 6% contribution from pricing and product mix, offset by a 1% decline in volumes. Adjusted operating margin reached 34.7%, while earnings per share rose 4% to 0.87 USD, despite a 5% negative currency impact. Performance was particularly strong across international markets.
Free cash flow for the first half of the year was negative at 1.4 billion USD, reflecting a one-time payment of 6.1 billion USD related to the Fairlife transaction. Excluding this one-off payment, adjusted free cash flow was positive at 3.9 billion USD.
Coca-Cola updated its Q3 and H2 2025 outlook. The company reaffirmed its full-year guidance for organic revenue growth of 5–6% and raised its forecast for adjusted EPS growth to approximately 3%, towards the upper end of the previous 2–3% range. For Q3 2025, Coca-Cola expects currency headwinds of around 5–6 percentage points on adjusted EPS and about 1 percentage point on revenue.
The Coca-Cola Company Q3 2025 earnings results
On 21 October, The Coca-Cola Company (NYSE: KO) released its financial report for Q3 2025, which ended on 26 September. The key figures compared with those for the same period last year are as follows:
- Revenue: 12.45 billion USD (+5%)
- Net profit (non-GAAP): 3.54 billion USD (+6%)
- Earnings per share: 0.82 USD (+6%)
- Operating margin: 32.0% (+1080 basis points)
Revenue by region:
- Europe, Middle East & Africa: 2.98 billion USD (+9%)
- Latin America: 1.56 billion USD (–6%)
- North America: 5.25 billion USD (+4%)
- Asia Pacific: 1.49 billion USD (+5%)
Coca-Cola’s Q3 2025 results came in slightly ahead of analyst expectations. Revenue totalled 12.5 billion USD, up 5% year-on-year and marginally above the market forecast of 12.41 billion USD. Adjusted earnings per share rose by 6% to 0.82 USD, also exceeding expectations of around 0.78 USD. Sales growth was mainly driven by higher prices and an improved product mix, with beverage volumes increasing by 1%.
By region, the picture remained similar to Q2 2025: international markets grew more actively, while demand in the US remained stable. However, the company offset this through effective pricing strategies and packaging optimisation. Coca-Cola also announced the sale of a 75% stake in its African subsidiary, Coca-Cola Beverages Africa, to its partner Coca-Cola HBC, for 2.6 billion USD. The transaction is part of the company’s long-term strategy to transfer bottling operations to partners, reducing capital expenses and focusing on brand management and the production of beverage concentrates. It was expected that the deal would result in a slight reduction of revenue in 2025, but overall, it should make the business simpler and more profitable.
Management reaffirmed its 2025 guidance, expecting revenue growth of 5–6% and a 3% increase in adjusted EPS compared with 2024. Profitability continued to face pressure from the strengthening US dollar (around –5 percentage points) and structural changes. In Q4 2025, the company expected a modest positive currency effect on revenue, though the impact on profit remained negative. Coca-Cola has not yet disclosed its forecast for 2026, noting only that the currency environment may improve slightly.
The Coca-Cola Company Q4 2025 earnings results
On 10 February 2026, Coca-Cola Company released its Q4 2025 results for the quarter ended 31 December. Below are the key financial figures compared to the same period last year (https://investors.coca-colacompany.com/):
- Revenue: 11.82 billion USD (+2%)
- Net profit (non-GAAP): 2.52 billion USD (+12%)
- Earnings per share: 0.58 USD (+6%)
- Operating margin: 24.4% (+90 basis points)
Revenue by region:
- Europe, Middle East & Africa: 2.69 billion USD (+6%)
- Latin America: 1.68 billion USD (+10%)
- North America: 4.95 billion USD (+5%)
- Asia Pacific: 1.15 billion USD (+0%)
The Coca-Cola Company's Q4 2025 report showed mixed results compared to market expectations. Financially, adjusted earnings per share (non-GAAP) came in at 0.58 USD, exceeding the consensus forecast (~0.56 USD). However, revenue for the quarter grew to 11.8 billion USD, which was below market expectations (~12.0 billion USD).
Revenue increased by 2% year-on-year, with organic revenue growth (non-GAAP) of around 5%. Growth was primarily driven by improvements in price/mix and increased concentrate sales, along with an additional reporting day. The expansion of the product mix and effective pricing management helped sustain growth momentum amid weak consumer demand in certain markets.
For the full year 2025, Coca-Cola delivered strong operating profit and stable cash flow, with operating cash flow totalling 7.4 billion USD, and free cash flow (non-GAAP) reaching 5.3 billion USD. This confirms the company's ability to generate liquidity following CAPEX investments.
For 2026, the company forecast organic revenue growth of 4–5% and an increase in adjusted EPS of 7–8%. This reflects a moderate but steady outlook for growth, considering macroeconomic uncertainty and currency effects. Management is projecting a more moderate trajectory, which is below the growth rates seen in 2024-25 but still within mid-term target ranges.
Analysis of key valuation multiples for The Coca-Cola Company
Below are the key valuation multiples for The Coca-Cola Company based on Q4 of the 2025 financial year, calculated using a share price of 80 USD.
| Multiple | What it indicates | Value | Commentary |
|---|---|---|---|
| P/E (TTM) | The price of 1 USD of earnings over the past 12 months | 26.2 | ⬤ Below the sector average for consumer goods, reflecting solid net income growth of 23% in 2025. |
| P/S (TTM) | The price of 1 USD of annual revenue | 7.2 | ⬤ Traditionally high for Coca-Cola, driven by the premium brand and strong net margin. |
| EV/Sales (TTM) | Enterprise value to revenue, including debt | 8.1 | ⬤ A high multiple for the beverage sector, but justified by Coca-Cola’s operating margin, which is significantly higher than most competitors. |
| P/FCF (TTM) | The price of 1 USD of free cash flow | 30.1 | ⬤ Considering the free cash flow of 11.4 billion USD, the multiple reflects stable cash generation and appears balanced. |
| FCF Yield (TTM) | Free cash-flow yield for shareholders | 3.3% | ⬤ Allows the company to consistently pay dividends (yield of ~2.6%) and invest in new beverage categories. |
| EV/EBITDA (TTM) | Enterprise value to EBITDA | 24.0 | ⬤ The business’s EBITDA valuation is at the upper end of the comfortable range for defensive assets. |
| EV/EBIT (TTM) | Enterprise value to operating profit | 25.7 | ⬤ Confirms stable operational efficiency. |
| P/B | Price to book value | 10.7 | ⬤ The high multiple to book value is typical for companies with significant intangible assets (such as brand value), but it indicates the high cost of net assets. |
| Forward P/E | Forward price-to-earnings (P/E) ratio | 24.1 | ⬤ Expected profit growth in 2026 makes the current valuation more attractive for long-term investors. |
| Net Debt/EBITDA | Debt load relative to EBITDA | 2.66 | ⬤ Debt levels are manageable. For a business with predictable revenue, this is not a risk. |
| Interest Coverage (TTM) | Operating profit to interest expense ratio | 10.5 | ⬤ Operating income covers interest expenses more than ten times, supporting financial stability. |
Valuation multiples analysis for The Coca-Cola Company – conclusion
Overall, the market values Coca-Cola as a reliable and stable business, for which investors are willing to pay a premium. With a P/E of 26.2 and a forward P/E of 24.1, these multiples do not appear excessively high when considering profit growth and expectations for further EPS increases. This suggests that the share price is aligned with current and forecasted results.
The P/S of 7.2 and EV/Sales of 8.1 indicate that revenue is relatively expensive, but this is typical for a strong global brand with high margins. The EV/EBITDA of 24.0 and the EV/EBIT of 25.7 are closer to the upper end of the range for defensive companies; however, given the current profitability, this does not appear critical.
P/FCF of 30.1 and FCF Yield of 3.3% reflect stable cash flow, sufficient to cover dividends and expansion. While the yield is not high, it is predictable, which is typical for a conservative company.
In conclusion, while Coca-Cola shares are not cheap, they are of high quality. They offer a solid option for investors seeking stability and moderate growth, rather than rapid capital appreciation.
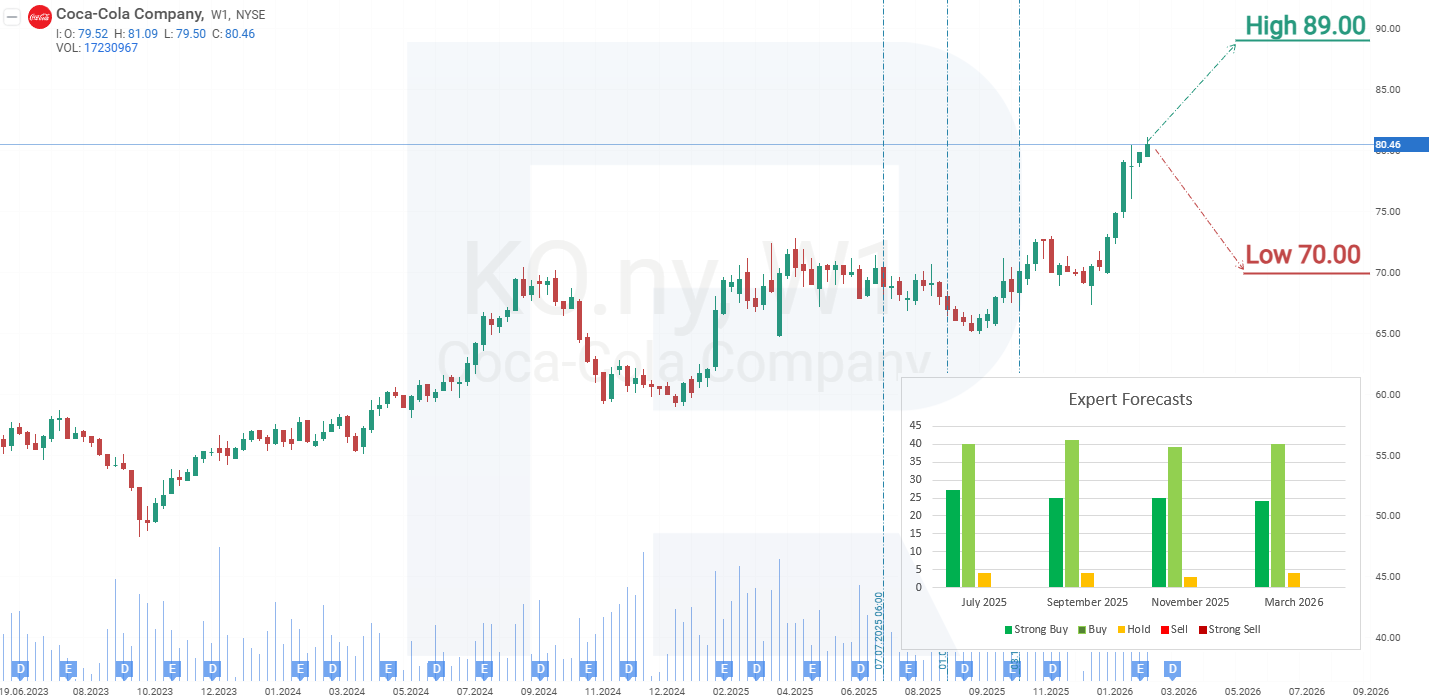
Expert forecasts for The Coca-Cola Company stock
- Barchart: 19 out of 24 analysts assigned a Strong Buy rating to Coca-Cola shares, 2 assigned a Moderate Buy rating, and 3 assigned a Hold rating. The upper price target is 89 USD, and the lower bound is 74 USD.
- MarketBeat: 16 out of 16 specialists assigned a Buy rating to the shares. The upper price target is 87 USD, and the lower bound is 80 USD.
- TipRanks: 14 out of 15 analysts assigned a Buy rating to the shares, and 1 gave a Hold recommendation. The upper price target is 88 USD, and the lower bound is 72 USD.
- Stock Analysis: 5 out of 13 experts assigned a Strong Buy rating to the shares, and 8 assigned a Buy rating. The upper price target is 87 USD, and the lower bound is 70 USD.
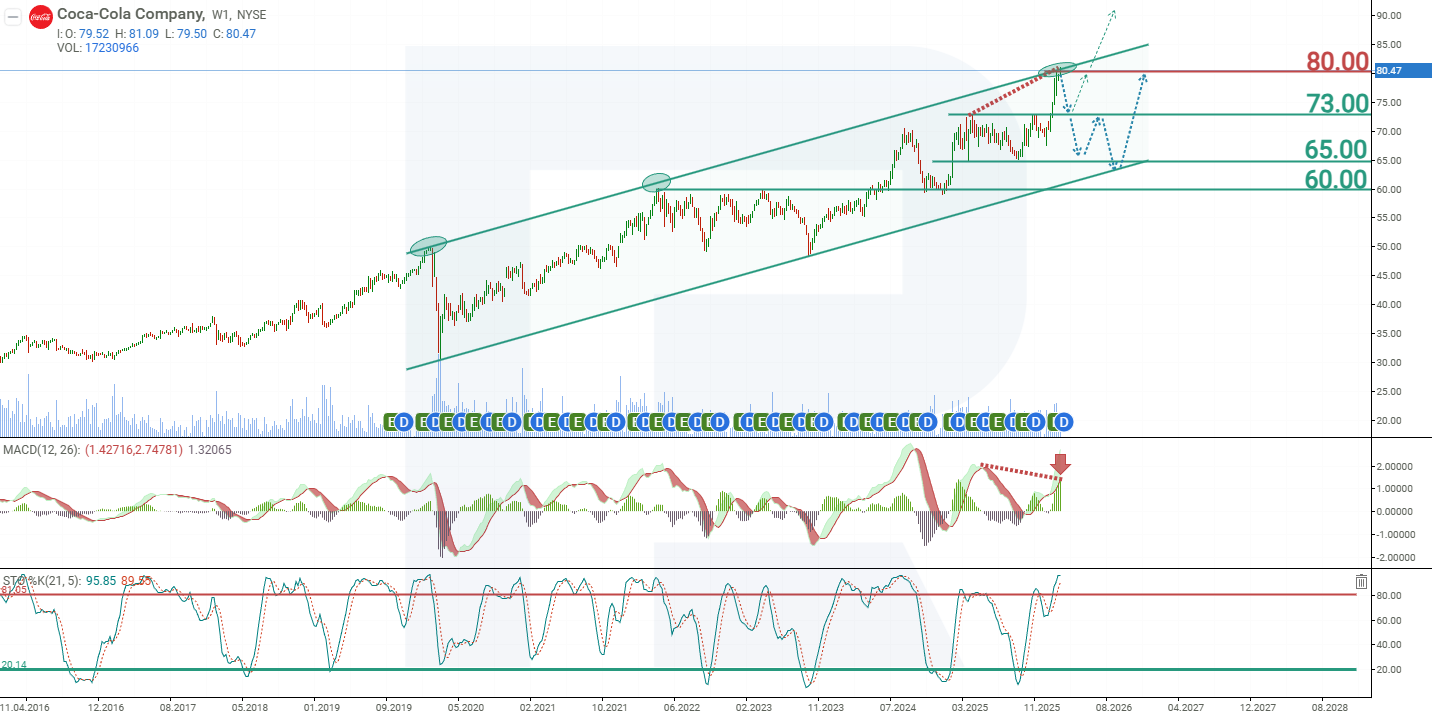
The Coca-Cola Company stock price forecast for 2026
On the weekly chart, Coca-Cola shares are trading within an ascending channel and have approached the upper boundary, which now acts as resistance. A divergence has formed on the MACD indicator, and the Stochastic is in the overbought zone (above 80), signalling a weakening of the upward momentum. Together, these indicators suggest a potential decline in the share price. Based on the current performance of The Coca-Cola Company shares, the potential movements in KO stock in 2026 are as follows:
The primary forecast for Coca-Cola shares anticipates a test of support at 73 USD, followed by a break below this level and a decline to 65 USD. At this point, a correction is expected, after which KO shares may resume their upward trend, with the next target at 80 USD.
The optimistic forecast for Coca-Cola stock suggests a test of support at 73 USD, followed by a rebound. In this scenario, KO shares may break through the 80 USD resistance and continue rising towards 100 USD per share.
Risks of investing in The Coca-Cola Company stock
Investing in Coca-Cola stock involves macroeconomic, industry-specific, and company-level risks that may negatively impact its revenue. The key risks include:
- Shifts in consumer preferences: the growing focus on healthy lifestyles and declining consumption of sugary drinks could negatively affect sales of Coca-Cola’s traditional products, including Coca-Cola and Fanta.
- Regulatory restrictions and taxation: many countries are introducing or considering regulations on advertising and labelling of high-sugar products. These measures may dampen demand and increase operational costs.
- Currency fluctuations: with over half of Coca-Cola’s revenue generated internationally, exchange rate movements – particularly a stronger US dollar– can reduce reported revenue and profit in dollar terms.
- Geopolitical and economic risks in international markets: instability in emerging economies, inflation, trade restrictions, sanctions, or local crises can lead to demand disruptions, supply chain issues, and losses in overseas markets.
- Reliance on franchised bottlers: although Coca-Cola sells concentrates, brand success heavily depends on the performance of bottling partners. Challenges related to logistics, product quality, or operational stability among these partners can negatively impact sales.
- Competition within the beverage industry: Coca-Cola faces strong competition from PepsiCo, Nestlé, Keurig Dr Pepper, and numerous local brands. Increasing competition may result in price pressure, market share losses, or the need for higher marketing expenditure.
- Legal and reputational risks: scandals involving product quality, labour conditions, or partner conduct can damage brand image and result in short-term sales declines.
These risks highlight Coca-Cola’s sensitivity to changes in global consumer trends, regulation, and its operational network, and should be considered by investors when evaluating the company’s outlook.
Forecasts presented in this section only reflect the author’s private opinion and should not be considered as guidance for trading. RoboForex bears no responsibility for trading results based on trading recommendations described in these analytical reviews.