What Is Technical Analysis? The Complete Beginner's Guide
Technical analysis is the skill of reading price charts to forecast where the market goes next. No forecasts based on opinions, no guessing — just objective signals that repeat because human psychology repeats.
This guide covers the core principles, chart types, patterns, and indicators, with a step-by-step analysis framework you can apply from your first trading session.
Key Takeaways
- Technical analysis is a method for forecasting price movements using historical data presented as price charts.
- Chart movements reflect the crowd psychology of market participants, which is cyclical and repeats over time.
- Chart analysis tells a trader when to buy or sell and where to exit a position with profit.
- Technical analysis is a chart evaluation tool. Since no method guarantees 100% accuracy, risk management is always part of the equation.
In mid-2024, the gold chart looked chaotic: for four months the price moved in a narrow range while most market participants guessed which way it would break. Traders who used technical analysis noticed an Ascending Triangle forming on the chart. When the price broke above the pattern's upper boundary, it delivered a clear buy signal. A powerful uptrend followed, pushing gold's price up more than 60%. Prepared traders captured strong gains, while those without a structured approach either booked losses or watched from the sidelines.
Chart analysis is built on reading charts correctly, identifying objective signals, and acting on what the price actually shows.
What Is Technical Analysis in Simple Terms
Technical analysis is the study of price charts to find repeating signals. At its simplest, it examines patterns in the behavior of major market participants as those patterns appear on the chart.
When investment funds, banks, and retail traders begin buying an asset aggressively, an upward move forms on the chart. When they take profits or panic, the price falls. Market participants' emotions, such as fear, greed, and hope, are converted into chart elements: bars, candles, lines, and price patterns.
Simple Analogy
A price chart is the market's Electrocardiogram. You cannot see the individual buyers and sellers, but by reading the "pulse" of the price you can understand who is currently stronger and where the market is likely to move next.
Who Is Technical Analysis For?
Short-Term Traders
Chart levels work continuously on minute and hourly timeframes. Technical analysis is the primary working tool: positions open and close within hours or days.
Medium-Term Traders
Charts help find optimal entry points, avoid buying at peak prices, and identify precise profit targets for positions held from several days to a few weeks.
Long-Term Investors
Technical analysis works as an additional filter. Even with a strong fundamental case, the chart helps time entry after a correction, reducing the purchase price risk.
What Is Technical Analysis For?
Trade Direction
The chart shows which way the market is moving right now, highlights strong price zones for entry, and helps assess the potential of a move.
Clear Rules
Technical analysis replaces guesswork with the clear, verifiable rules of a trading strategy, removing emotions from the decision-making process.
Risk Management
Analysis enables placing stop-losses and take-profits at key market levels rather than at arbitrary numbers chosen without reference to the chart.
Practice on Real Charts, Risk-Free
Open a free demo account on RoboForex and apply everything from this guide on live market data with virtual funds. No deposit required.
Principles of Technical Analysis
Modern technical analysis rests on three core postulates formulated by Charles Dow in the 19th and early 20th centuries.
I
The Market Discounts Everything
Any factor capable of influencing price, whether economic or political, is already priced in and reflected on the chart. The current price is the direct outcome of the battle between supply and demand.
II
Price Moves in Trends
Price changes in markets follow trends and are not random. Once a trend has formed, the probability of its continuation is significantly higher than the probability of a quick reversal. The trader's primary task is to identify that trend early and trade in its direction.
III
History Repeats Itself
Crowd psychology has remained constant throughout human history. People always react the same way to fear of capital loss or greed when markets rise. This is why the same price patterns appear on charts repeatedly and, in most cases, lead to the same outcomes.
On Markets and Human Nature
"Markets change minute-by-minute. Human nature barely changes millennium-by-millennium. There's your edge." — Jim O'Shaughnessy
Technical Analysis vs Fundamental Analysis
These two approaches to financial market analysis are different methods that often complement each other.
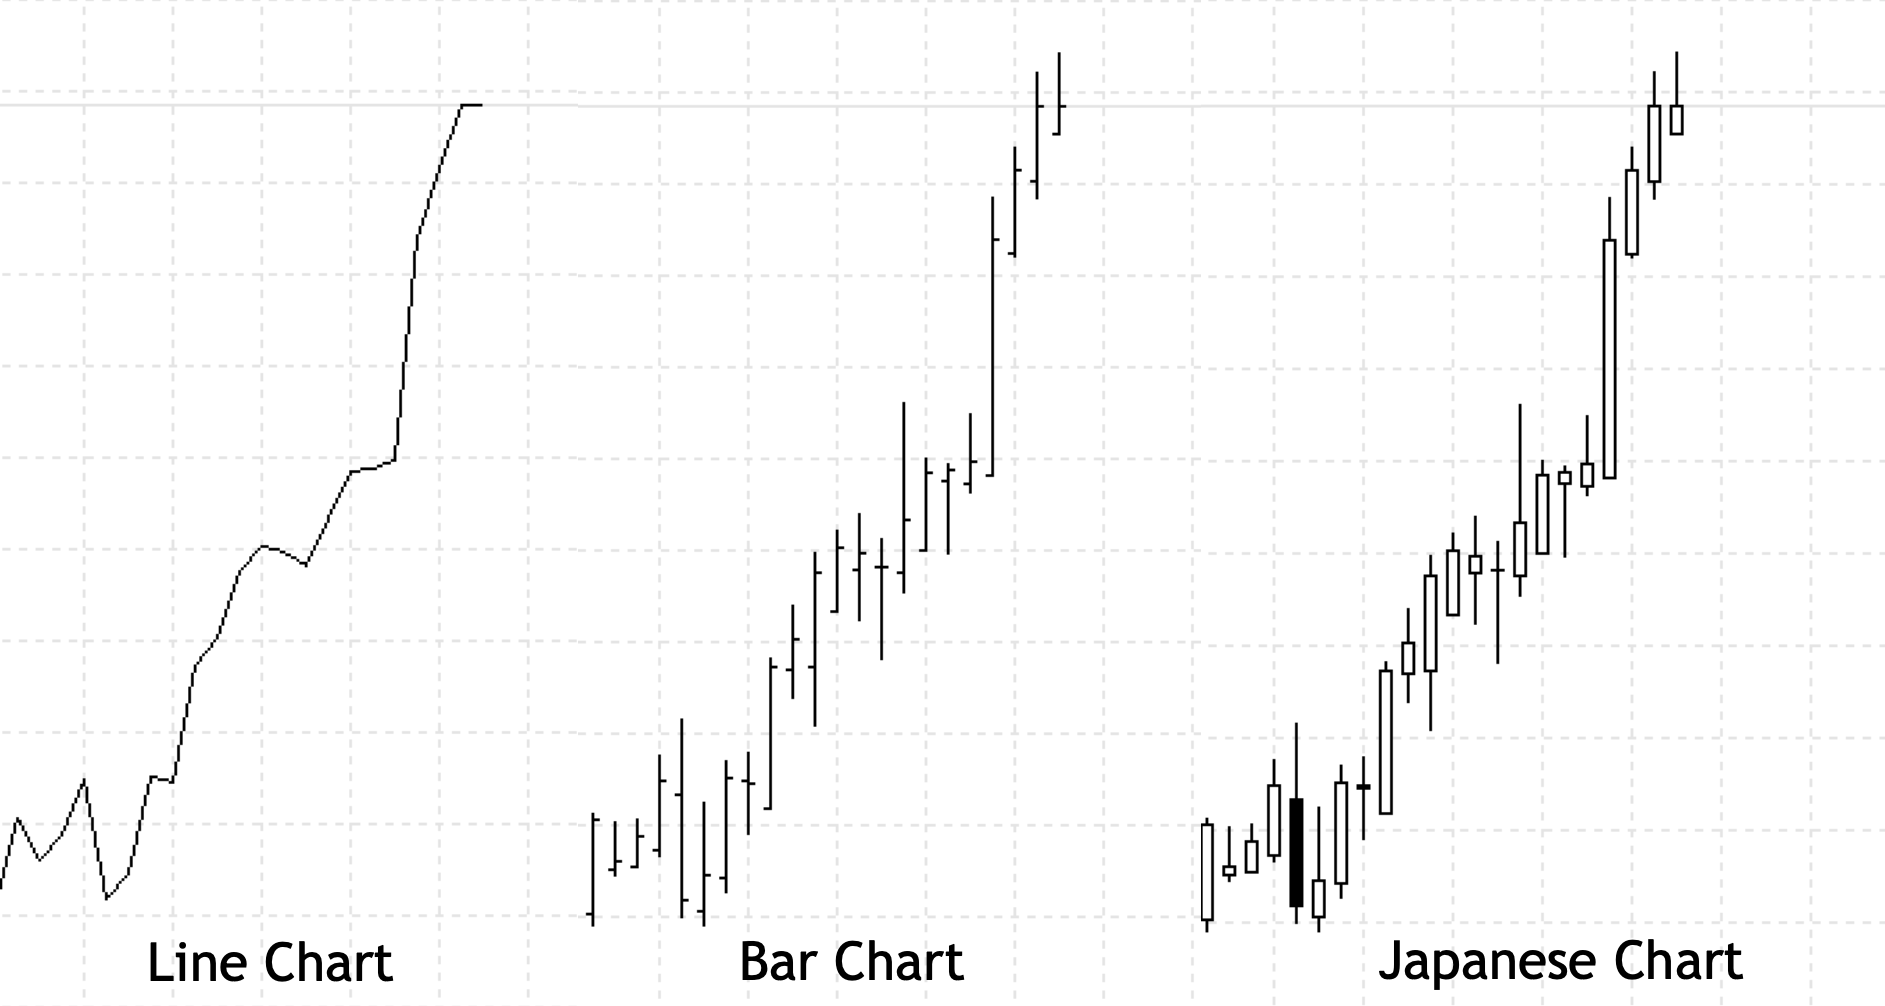
- Line chart. The simplest type of price display. It connects closing prices for each period into a continuous line. The absence of full price movement data makes it unsuitable for detailed analysis, but it excels at quickly showing long-term trends. Beginning traders often start here.
- Bar chart. A more detailed tool. Each bar is a vertical segment with small ticks on the left and right, displaying four data points for a chosen timeframe: the opening price (Open), the highest price (High), the lowest price (Low), and the closing price (Close). The left tick marks the open; the right tick marks the close.
- Japanese candlesticks. The most popular and informative chart type in financial markets. Like bars, a candlestick displays four price parameters for a given period, but the range between the opening and closing prices is shown as a colored rectangle called the "body." The lines above and below the body are called "shadows" or "wicks" and show the highest and lowest prices reached during that period.
- Uptrend. Each subsequent high and low is higher than the previous one. This signals buyer dominance in the market.
- Downtrend. Each subsequent high and low is lower than the previous one. This signals seller dominance.
- Sideways trend (range). No clear directional movement is present. Most highs and most lows sit at approximately the same level, signaling a temporary balance of power between buyers and sellers.
- Uptrend line. Drawn through two lows where the second is higher than the first, with one high between them. It acts as support. On subsequent tests, the price may bounce from this line and continue the uptrend.
- Downtrend line. Drawn through two highs where the second is lower than the first, with one low between them. It acts as resistance. On the next test, the price typically bounces downward and continues the downtrend.
- Range trading. Buy when the price bounces from the lower boundary of an ascending channel; sell when it bounces from the upper boundary of a descending channel.
- Breakout trading. When the price closes firmly above or below the trend line, it signals a weakening trend or a full trend reversal.
- Support. A horizontal level below the current market price where demand becomes strong enough to stop the asset's decline and push the price upward. Buyer pressure strengthens at this zone.
- Resistance. A horizontal level above the current market price where supply exceeds demand. Sellers open positions aggressively here, halting the price's rise and pushing it back downward.
- Moving Averages. Display the average price value over a given period, for example, the last 50 or 200 candles. They smooth price fluctuations and clearly indicate trend direction. When price is above the moving average, the trend is up. When price is below it, the trend is down.
- RSI (Relative Strength Index). A popular oscillator that moves from 0 to 100 and measures market strength. When RSI rises above 70, the asset is considered overbought and a pullback is more likely. When RSI falls below 30, the asset is oversold and a bounce upward is more likely.
- Bollinger Bands. An indicator that builds a dynamic price corridor around a moving average. Price spends approximately 85 to 90 percent of the time inside the Bollinger Bands. A move outside the bands signals an extreme deviation, after which a return toward the midline typically follows. In an uptrend, traders aim to buy when price tests the lower band; in a downtrend, they aim to sell from the upper band.
- Price above the moving average: prioritize buy signals.
- Price below the moving average: prioritize sell signals.
- Daily uptrend: look for Inverse Head and Shoulders, Double Bottom, Bull Flag, Ascending Triangle.
- Daily downtrend: look for Head and Shoulders, Double Top, Bear Flag, Descending Triangle.
- Entry point: for example, at candle close or on a break above the upper boundary of an Ascending Triangle.
- Stop-loss: placed beyond the level or pattern boundary whose breach would invalidate the trading scenario.
- Take-profit: set in front of the nearest strong resistance level or measured by the pattern's rules. For an Ascending Triangle breakout, the target is measured from the breakout point by the height of the triangle.
Examines companies' financial health, central bank interest rates, macroeconomic indicators, and geopolitics. The goal is to find an asset's fair value. This approach requires significant time studying reports and news. Long-term investors use it most.
Technical Analysis
Focuses exclusively on the chart and trading volume. Captures real market participant behavior in the present moment, helping identify the precise timing for a trade. Traders can work on any timeframe from minutes to weeks and see results promptly.
Comparison: Technical Analysis vs Fundamental Analysis
| Criteria | Technical Analysis | Fundamental Analysis |
|---|---|---|
| Object of study | Price charts and technical indicators | Financial reports, interest rates, macroeconomics |
| Main question | When to open a position and close a trade? | What to buy or sell? |
| Investment horizon | From seconds to weeks | From months to years |
| Main tool | Trading terminals (MT4, MT5) | Economic calendars, corporate reports, news |
| Target audience | Traders, active managers | Long-term investors, large funds |
Types of Price Charts
Three main chart types are used to display price changes, each serving its own purpose.
Why Are Japanese Candlesticks the Most Popular Chart Type?
Candlesticks use intuitive color coding that bars do not provide. Most traders color the body green or white when the price rises (bullish candle) and red or black when it falls (bearish candle). This allows instant assessment of market momentum. Candlestick combinations also produce standalone entry and exit signals. A classic example is the Hammer pattern: a candle with a short body and a long lower shadow that signals an upcoming reversal upward.
Trends and Their Types
A trend is the direction in which prices are moving. Prices never move in a straight line; they oscillate continuously, forming local highs and lows. Comparing the positions of these extremes allows a trader to identify the current market trend.
Three trend types are defined by direction:
Market theorist Bill Williams built his famous Alligator indicator on a key observation: assets spend up to 70% of their time in sideways ranges, while strong directional trends account for only around 30% of trading time. This insight shaped trend-following strategies across the industry.
How Markets Spend Their Time
Sideways / Range Wait for a setup; protect capital
Trending Active trend phases
Industry estimate; actual ratios vary by market and timeframe
Trend Lines and Channels
Trend lines are simple yet effective technical analysis tools that act as dynamic levels from which prices bounce after testing.
Construction Rules
A price channel forms when a line parallel to the trend line is added on the opposite side of the chart. The price may move within such a channel for a period of time.
How to Use Trend Lines in Trading
Support and Resistance Levels
Support and resistance levels are key horizontal zones on the chart where the balance of power between buyers and sellers shifts sharply. These are the points where price most often pauses or reverses.
How to Find Levels on the Chart
Look for zones on the chart where the price has bounced sharply at least twice in the past, reversing direction each time. The older the timeframe (for example, the daily or 4H chart) and the more times the price tested the level without breaking it, the stronger and more reliable that level is. For a detailed guide on working with these zones, read How to Trade Support and Resistance Levels.
Popular Chart Patterns
Chart patterns are repeating formations that appear on price charts due to recurring market participant behavior. They fall into two categories: trend continuation patterns and reversal patterns. The three patterns below are the right starting point for any beginner.
Full catalog with entry rules: 14 Most Popular Trading Chart Patterns.
Apply These Patterns on a Real Chart
MetaTrader 5 via RoboForex lets you draw trend lines, mark levels, identify patterns, and set price alerts on live market data.
Technical Indicators for Beginners
Technical indicators are the result of mathematical processing of price over a given period. An important point: in most cases, indicators follow price rather than lead it, helping smooth the chart or reveal hidden market parameters by filtering out price noise.
Three indicators to start with:
Moving Average EMA 200: Two Market States
UPTREND
Price EMA 200
↑ Look for buy signals
DOWNTREND
Price EMA 200
↓ Look for sell signals
EMA 200 = 200-period exponential moving average. Widely used by professional traders to define the global trend direction.
Indicator Reference Table
| Indicator | What It Shows | How to Read the Signal |
|---|---|---|
| EMA 200 | The asset's global trend | Price above the line: look for buys only. Price below the line: look for sells only. |
| RSI (14) | Overbought and oversold zones | RSI above 70: expect a price decline, avoid buys. RSI below 30: expect a price rise. |
| Bollinger Bands | Dynamic support and resistance levels | In an uptrend, a drop to the lower band signals a buy. In a downtrend, a rise to the upper band signals a sell. |
Tip for Beginners
Avoid adding every available indicator to the chart at once. Start with a combination of two tools: a moving average to identify the trend and RSI to assess entry points near overbought and oversold levels.
RSI: Overbought and Oversold Zones
0 30 70 100
RSI < 30 Bounce likely ↑
RSI 30–70 No clear signal
RSI > 70 Pullback likely ↓
Default RSI period: 14. Always confirm with trend direction (EMA 200) before acting on signals.
A full overview of tools is available in Top 10 Forex Indicators That Every Trader Needs.
Step-by-Step Chart Analysis Plan
To eliminate guesswork from trading decisions, use a standardized chart evaluation approach. Professional traders move from higher timeframes to lower ones. The six steps below turn chaotic market prices into a clear trading plan.
1
Assess the Current Trend
Start on the daily chart (D1). Signals from higher timeframes carry far greater weight than those from minute or hourly timeframes. Add a 200-period moving average to the chart.
2
Mark Key Levels
Identify strong horizontal support and resistance levels on the chart. Look for zones where the price has previously made sharp reversals at least twice. The more times a level has been tested without being broken, the more reliable it is considered.
3
Switch to a Lower Timeframe
Move to your trading timeframe (H1 or M15). Add trend lines or price channels to the chart and determine the current market phase.
Key rule: if the daily chart shows an uptrend but the hourly chart shows falling prices, a local correction is underway. Wait for it to end before entering buys in the direction of the primary trend.
4
Look for Chart Patterns
Identify formations that signal a reversal or trend continuation and offer a low-risk entry.
5
Analyze Indicators
Use technical indicators to confirm what chart analysis has already identified.
Example: price has reached a strong daily support level, a Double Bottom has formed on H1, and RSI has dropped below 30. This combination of factors produces a strong buy signal.
6
Plan the Trade and Manage Risk
Before opening any position, define three parameters clearly.
Core Risk Management Rule
Potential profit should always be a multiple of potential loss. Experienced traders aim for a minimum risk-to-reward ratio of 1:2. If this condition is not met, it is better to skip the trade.
Risk / Reward Calculator
Enter your trade parameters to see the risk-to-reward ratio before opening a position.
Direction —
Risk —
Reward —
R:R Ratio —
Technical Analysis for Forex, Gold, and Cryptocurrencies
The principles of technical analysis are universal because they reflect human psychology. The method works across all markets, but each asset class has its own characteristics to account for.
Currency Pairs
CharacterExtended sideways consolidations; price anchors firmly to strong horizontal support and resistance levels
Best approachRange trading within price channels; breakouts from established patterns at key levels
Mark levels on H4 or D1 first, then switch to H1 for precise entry timing
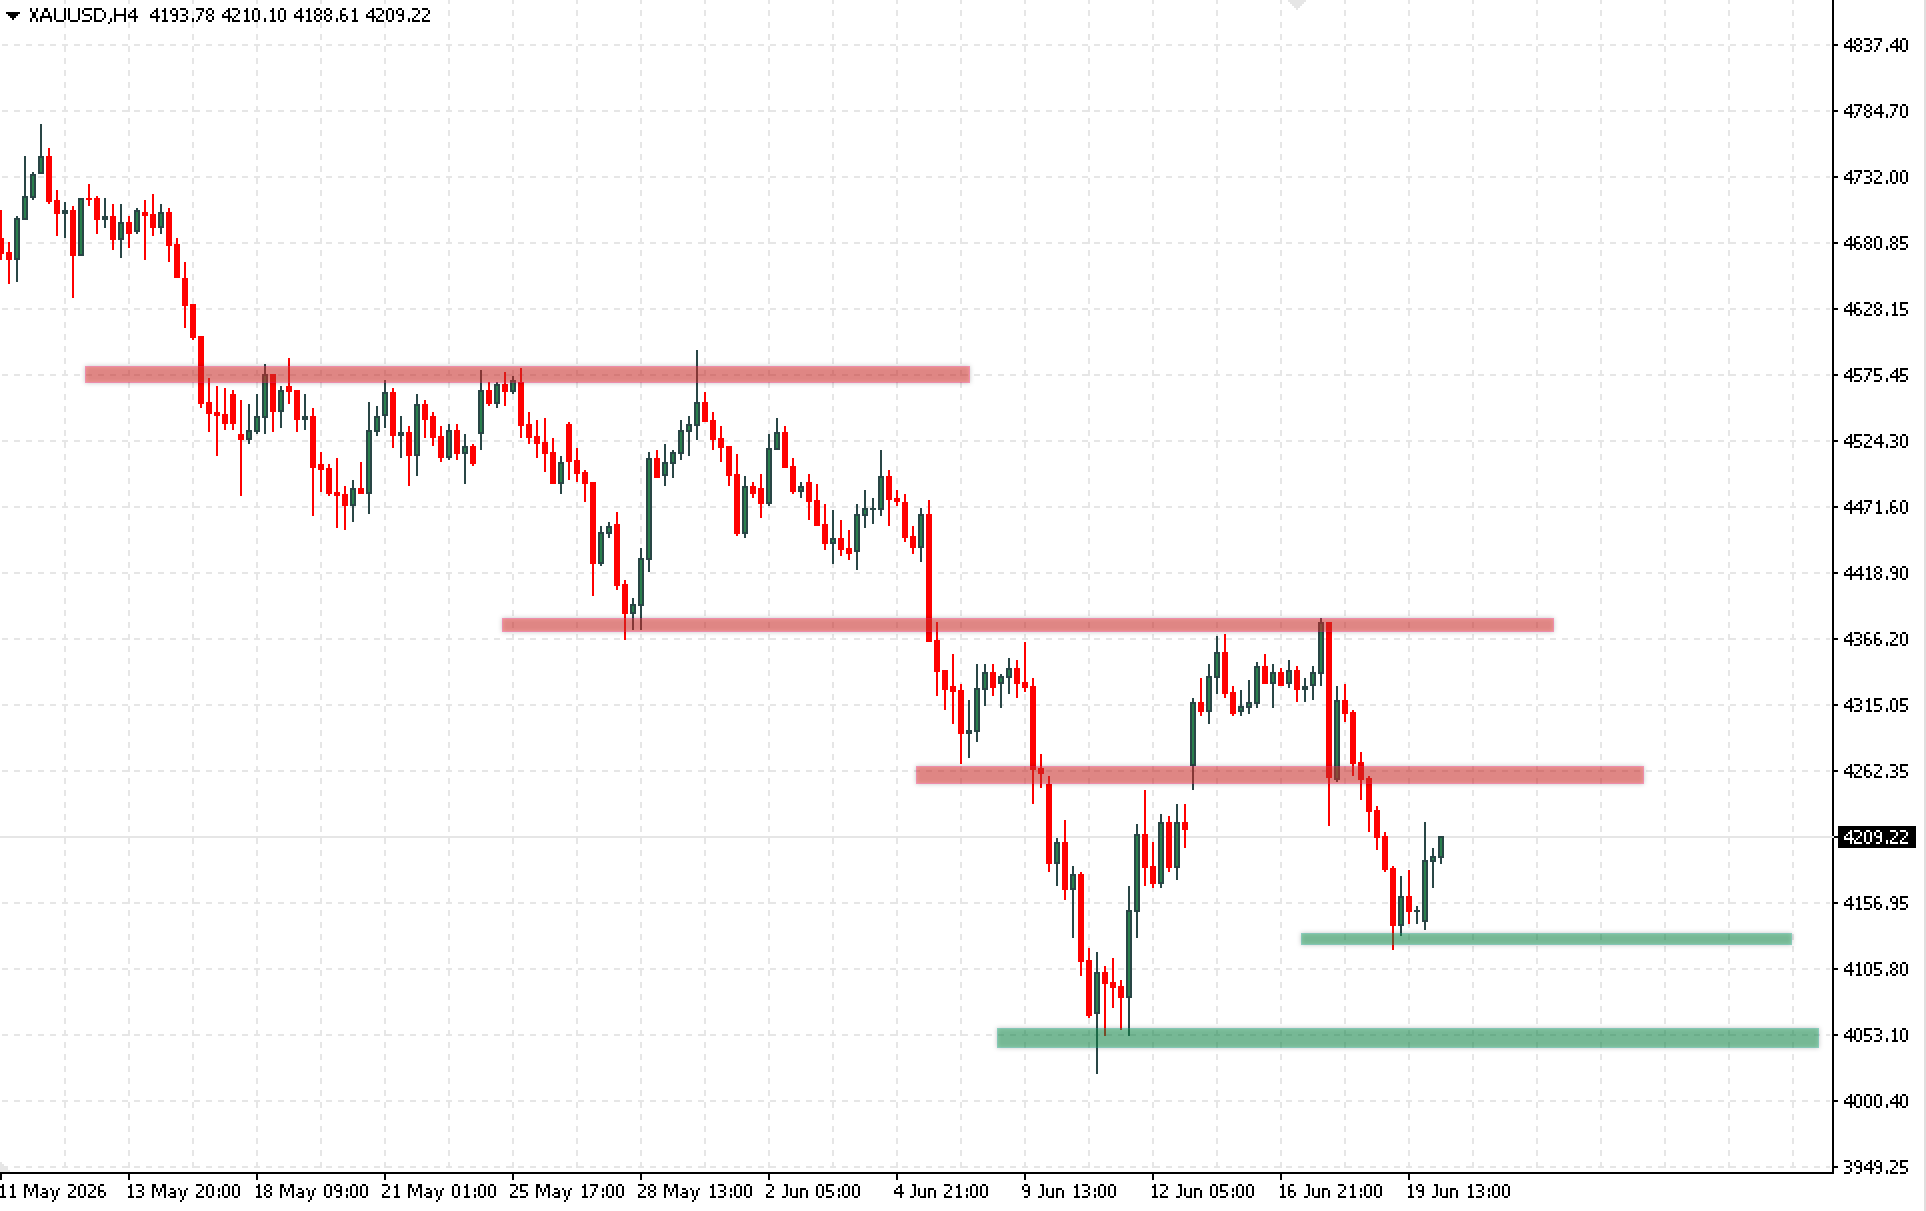
Gold · XAUUSD
CharacterHigh volatility; sharp news-driven impulses; frequent false breakouts on lower timeframes
Best approachMark levels on D1 or H4; allow wider stop-loss buffers to filter intraday noise
Confirm breakouts with candle closes rather than wicks: intraday spikes are common
Cryptocurrencies
CharacterStrong extended trends; RSI can stay in overbought territory for weeks during bull cycles
Best approachTrend continuation patterns (Flag, Triangle); moving averages as dynamic support levels
In a bull cycle, a high RSI reading alone is not sufficient reason to sell: confirm with price action first
Common Beginner Mistakes
Technical analysis is a chart reading tool. Beginning traders most often lose capital due to the following systematic mistakes.
No Risk Management
Trading without a stop-loss or with an excessive position size means a single wrong forecast can destroy a large portion of the deposit.
Entering Without Confirmation
Opening a position before a candle has closed or a level has been breached. Trying to anticipate a move before a clear signal forms turns trading into a gamble.
Indicator Overload
Adding five or more indicators simultaneously produces conflicting signals that leave the trader unable to act decisively.
Searching for the "Holy Grail"
Endlessly switching trading strategies after the first few losing trades. A system with 100% winning entries does not exist.
Pre-Trade Checklist
Save this list and review it every time before opening a position. It prevents impulsive decisions.
0 of 8 checked
Conclusion
When golfer Gary Player was asked about the secret of his success, he replied that he had noticed a remarkable pattern: the more he practiced, the luckier he got.
The same principle applies to financial markets. Technical analysis is a skill that can be learned and that transforms seemingly chaotic price swings into a readable structure. The method gives traders a statistical edge over time by improving the probability of successful trades. Consistent results come from consistent practice.
Traders who read charts regularly, apply a step-by-step approach from higher to lower timeframes, and maintain proper risk management build the conditions for steady profit even in the most volatile market environments.
Frequently Asked Questions
What is the difference between technical analysis and fundamental analysis?
Technical analysis studies the price chart and answers the question "when to enter a trade." Fundamental analysis studies the causes of price movement, including financial reports, interest rates, and macroeconomics, and answers the question "what to buy." Many traders use both approaches together.
Does technical analysis work on cryptocurrencies?
Yes. The analytical principles are universal across all markets because they reflect participant psychology. On cryptocurrencies, trend continuation patterns and moving averages tend to be most effective, though due to high volatility, RSI overbought zones may be ignored for weeks at a time.
Which indicator is best for beginners?
Start with a moving average to identify the trend and RSI to assess entry points. Adding more than two or three tools to the chart at once leads to conflicting signals and makes decisions harder.
Is it possible to trade using only technical analysis?
Yes, many short-term traders work exclusively from the chart. Technical analysis raises the probability of a successful trade. Since no method is 100% accurate, sound risk management remains the key condition for profitable trading.
How long does it take to learn technical analysis?
The basic concepts (charts, trends, and levels) can be grasped within a few weeks. A reliable chart-reading skill develops over months of regular practice on a demo account, so moving to real money is worth doing only after building genuine confidence.
Past results do not guarantee future performance. Trading financial instruments involves significant risk and may not be suitable for all investors.