14 Most Popular Trading Chart Patterns
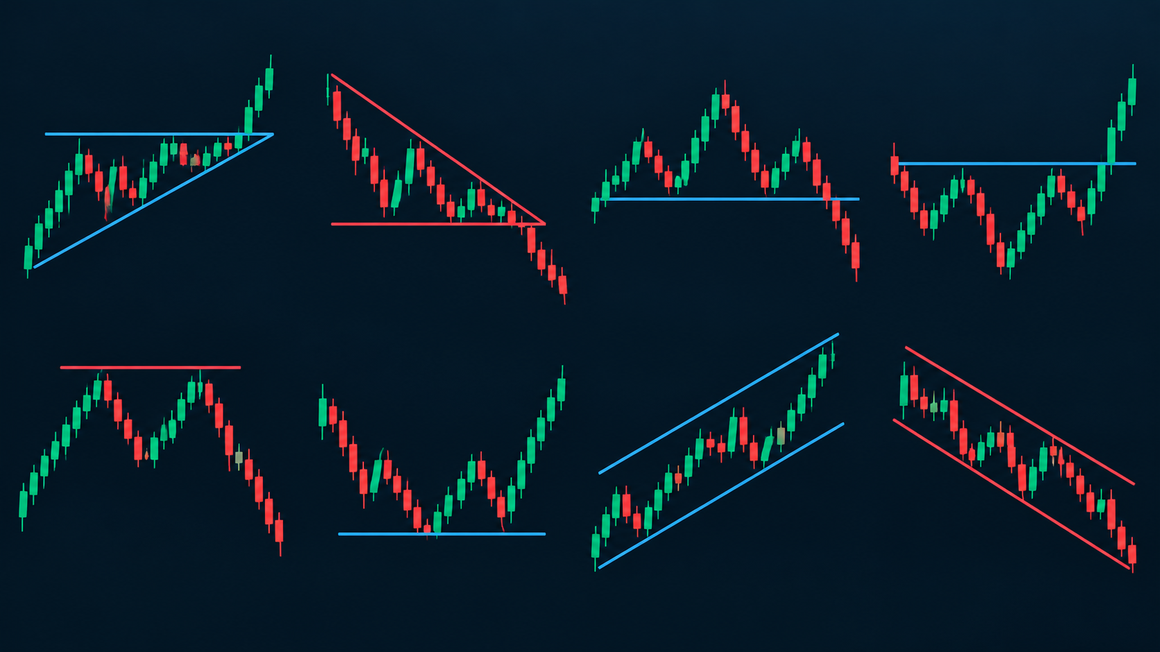
Chart patterns are repeated shapes that price draws on a chart, and traders use them to spot likely reversals and continuations of a trend. Reversal patterns such as Head and Shoulders, Double Top and Triple Bottom form at the end of a move. The Flag and the Pennant form inside a trend and point to its continuation. Most patterns give a signal only after the price breaks a key line, such as the neckline.
TL;DR
- Identify the type: reversal patterns form at the end of a move, continuation patterns inside a trend.
- Enter only after the price closes beyond the neckline or the border of the pattern.
- Place the stop loss behind the opposite side and measure the target by the pattern height.
The summary table below lists all 14 patterns with their type, signal and confirmation.
Chart Patterns in Trading
Trading in financial markets is a popular way to invest and grow one's wealth. However, trading can be a complicated process that requires a deep understanding of various factors that affect the market. One important aspect of trading is the ability to analyze charts and identify patterns that indicate the direction of the market. In this article, we will discuss chart patterns in trading and how they can be used to make informed trading decisions.
Chart patterns are visual representations of historical price movements in financial markets. These patterns can help traders identify trends, reversals, and other trading opportunities. Chart patterns are created by plotting price movements over time, typically using candlestick charts or line charts.
What Is a Chart Pattern in Tech Analysis?
Trading chart patterns are specific and repeated areas on the price charts and sometimes they are called price patterns or formations.
Over the years of monitoring financial markets, it was noticed that from time to time the price charts showed trading patterns (or price patterns), which might be used to predict further movements. There are patterns that indicate the reverse of tendencies and there are formations that show their continuation. Keep in mind that a pattern on the chart shows a probability of the predicted move, and that probability is what helps in trading. There are several common chart patterns that traders use to identify potential trading opportunities.
The table sums up all 14 chart patterns covered below: what each one signals, where it forms, what confirms it and where traders usually place the stop loss and the target.
| Pattern | Type | Signal | Where it forms | Entry after | Stop loss | Target |
|---|---|---|---|---|---|---|
| Head and Shoulders | Reversal | Bearish | At a high in an uptrend | A close below the neckline | Above the right shoulder | Pattern height, measured from the neckline |
| Inverted Head and Shoulders | Reversal | Bullish | At a low in a downtrend | A close above the neckline | Below the right shoulder | Pattern height, measured from the neckline |
| Double Top | Reversal | Bearish | At a high in an uptrend | A close below the low between the two tops | Above the second top | Pattern height |
| Double Bottom | Reversal | Bullish | At a low in a downtrend | A close above the high between the two bottoms | Below the second bottom | Pattern height |
| Triple Top | Reversal | Bearish | At a high in an uptrend | A close below the line through the two lows | Above the third top | Pattern height |
| Triple Bottom | Reversal | Bullish | At a low in a downtrend | A close above the line through the two highs | Below the third bottom | Pattern height |
| Wedge | Reversal | Against the slope: a rising wedge is bearish, a falling wedge bullish | At a high or a low of a trend | A close outside the wedge, against its slope | Beyond the last swing inside the wedge | Height of the wedge base |
| Diamond | Reversal | Against the previous trend | At a high or a low of a trend | A close below support at a high, above resistance at a low | Beyond the last swing inside the diamond | Pattern height |
| Rectangle | Reversal or continuation | In the direction of the breakout | A sideways range inside a trend | A close outside the range | Back inside the range, around its middle | Rectangle height |
| Flag | Continuation | In the direction of the flagpole | After a sharp move | A close outside the flag, in the flagpole direction | Beyond the far side of the flag | Flagpole height |
| Pennant | Continuation | In the direction of the pole | After a sharp move | A close outside the pennant, in the pole direction | Beyond the far side of the pennant | Pole height |
| Symmetrical Triangle | Reversal or continuation | In the direction of the breakout | Anywhere in a trend | A close outside one of the two lines | Beyond the last swing inside the triangle | Height of the triangle base |
| Ascending Triangle | Continuation | Bullish | In an uptrend | A close above the horizontal resistance | Below the rising support line | Height of the triangle base |
| Descending Triangle | Continuation | Bearish | In a downtrend | A close below the horizontal support | Above the falling resistance line | Height of the triangle base |
Chart patterns form on every liquid market, from currency pairs and gold to stocks and indices. To practise spotting them, open the EUR/USD chart on H4, where most of the examples below come from, or run the same search in MetaTrader 4 on any of the currency pairs you trade.
Trade on the Go With RoboForex MobileTrader
A portable trading workstation on your phone, on Android and iOS.
Head and Shoulders and Inverted Head and Shoulders Chart Patterns
These are reversal patterns, which are usually formed at local lows and highs of the price chart within either ascending or descending trend. The patterns indicate that the current tendency is getting weaker and the price is expected to either start a correction or reverse the tendency to the opposite side.
Head and Shoulders
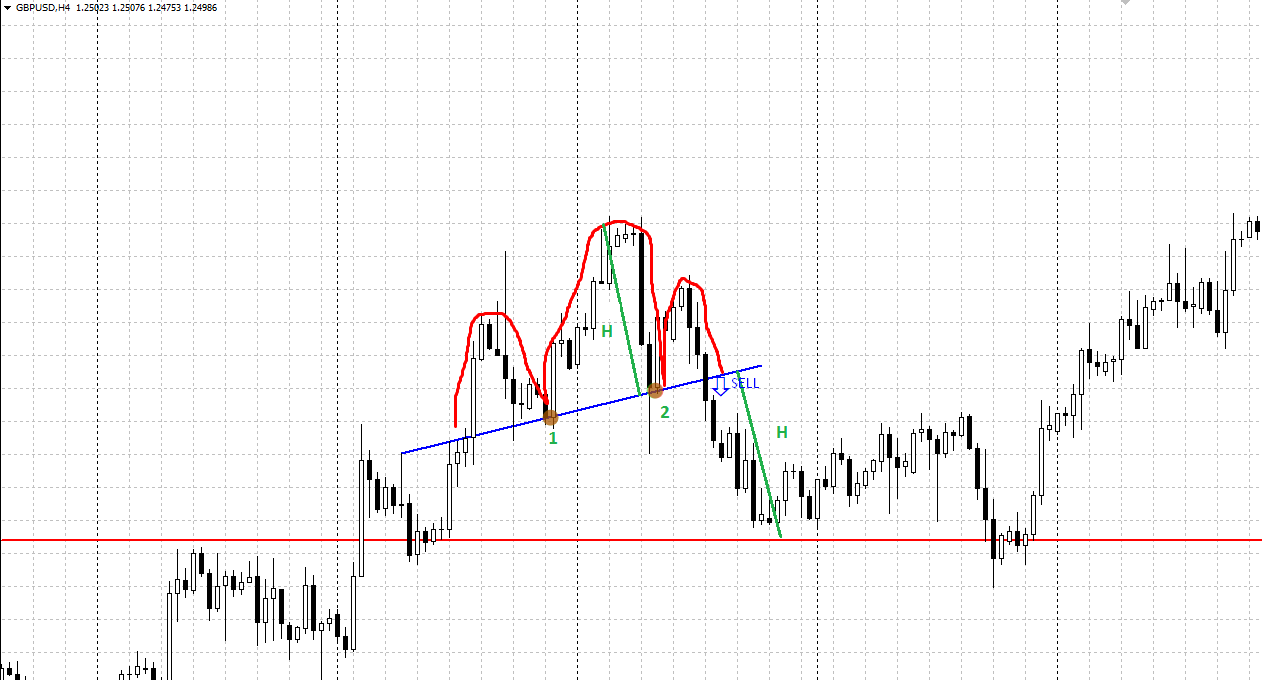
Head and Shoulders chart pattern is formed at highs within an ascending tendency. A bottom line is drawn through 1 and 2 (neckline). The trading pattern is considered completely formed only after the price fixes below the bottom line. After that, the price is expected to fall by the distance equal to, at least, the pattern height, which is measured in pips from the pattern’s high to the neckline. One is recommended to sell right when the price breaks the bottom line or wait until it returns to the line after breaking it.
Inverted Head and Shoulders
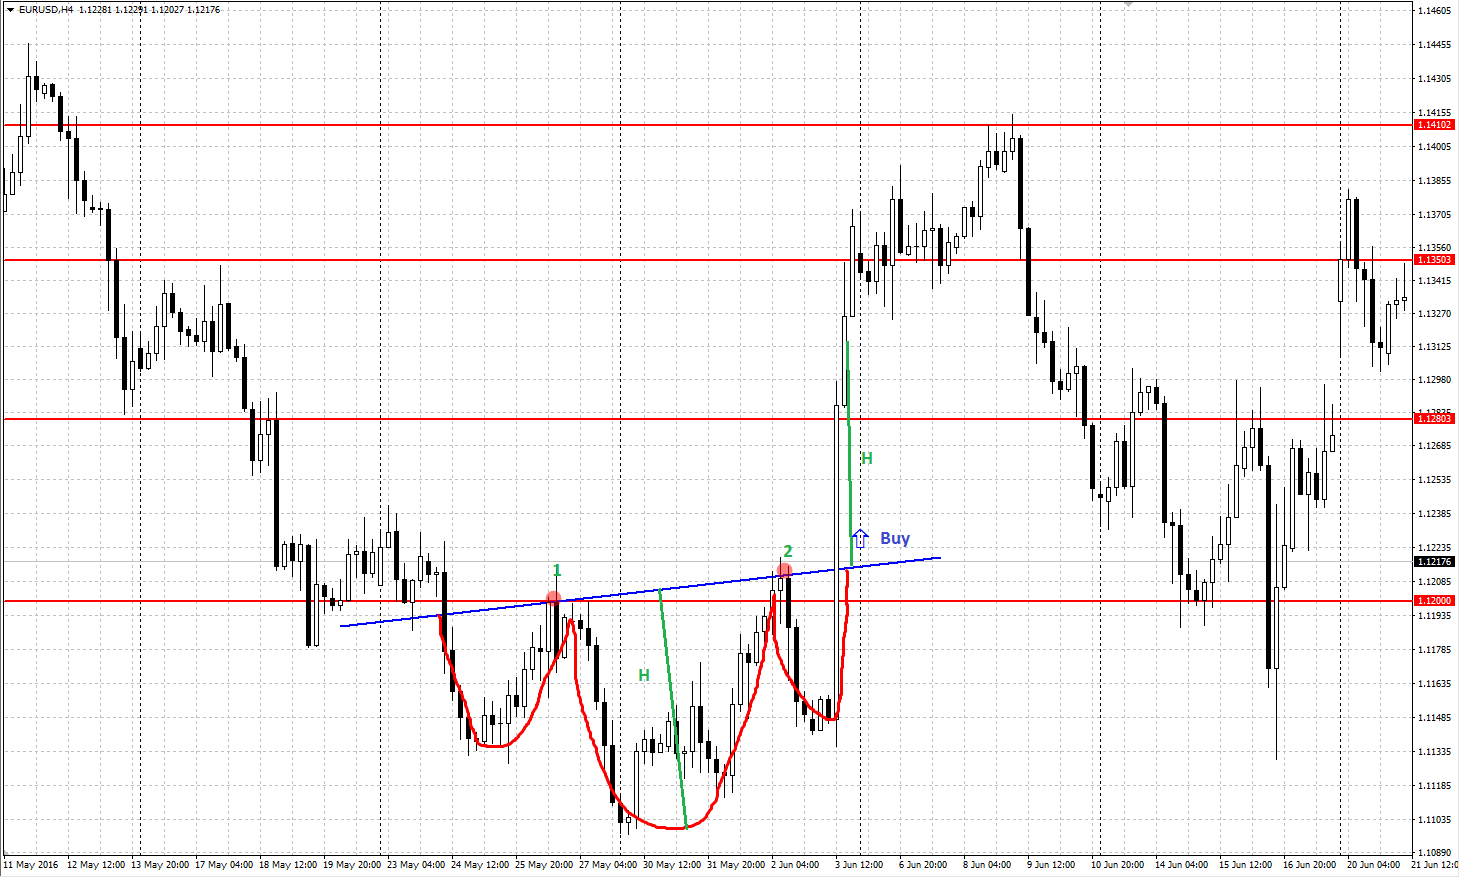
Inverted Head and Shoulders chart pattern is formed at lows within a descending tendency. A bottom line is drawn through 1 and 2 (neckline). The trading pattern is considered completely formed only after the price fixes above the bottom line. After that, the price is expected to grow by the distance equal to, at least, the formation height, which is measured in pips from the pattern’s low to the neckline. One is recommended to buy right when the price breaks the bottom line or wait until it returns to the line after breaking it.
Double Top and Double Bottom Chart Patterns
These are reversal trading patterns, which are usually formed at local lows and highs of the price chart within either ascending or descending trend. The patterns indicate that the current tendency is getting weaker and the price is expected to either start a correction or reverse the tendency to the opposite side.
Double Top
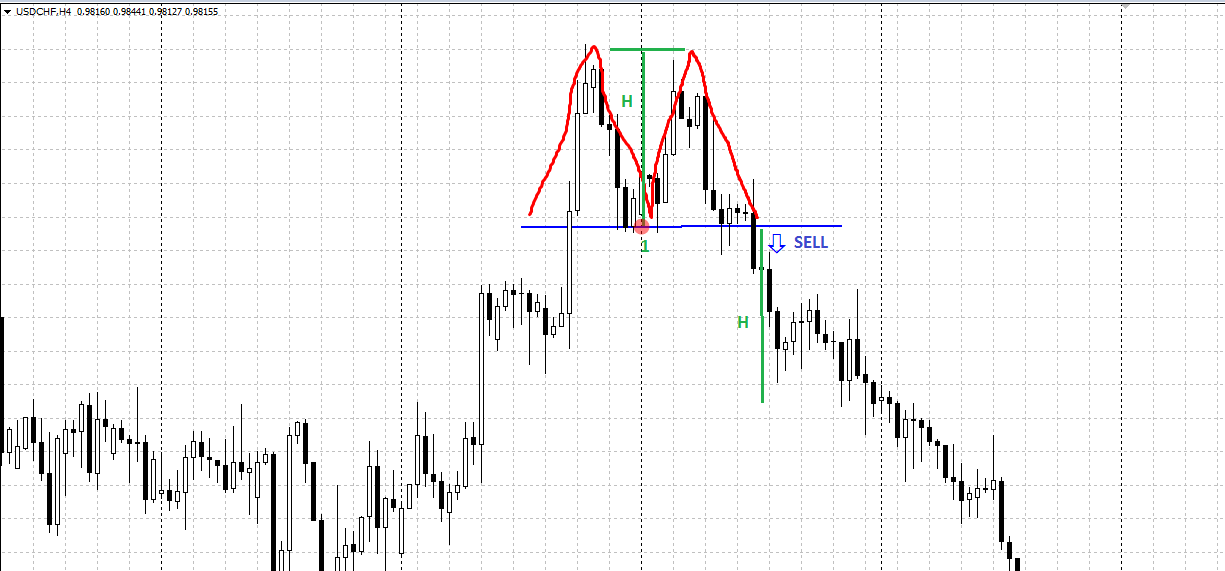
Double Top chart pattern is formed at highs within an ascending tendency. A horizontal bottom line is drawn through 1. The trading pattern is considered completely formed only after the price fixes below the bottom line. After that, the price is expected to fall by the distance equal to, at least, the pattern height, which is measured in pips from the pattern’s highs to the bottom line. One is recommended to sell right when the price breaks the bottom line or wait until it returns to the line after breaking it.
Double Bottom
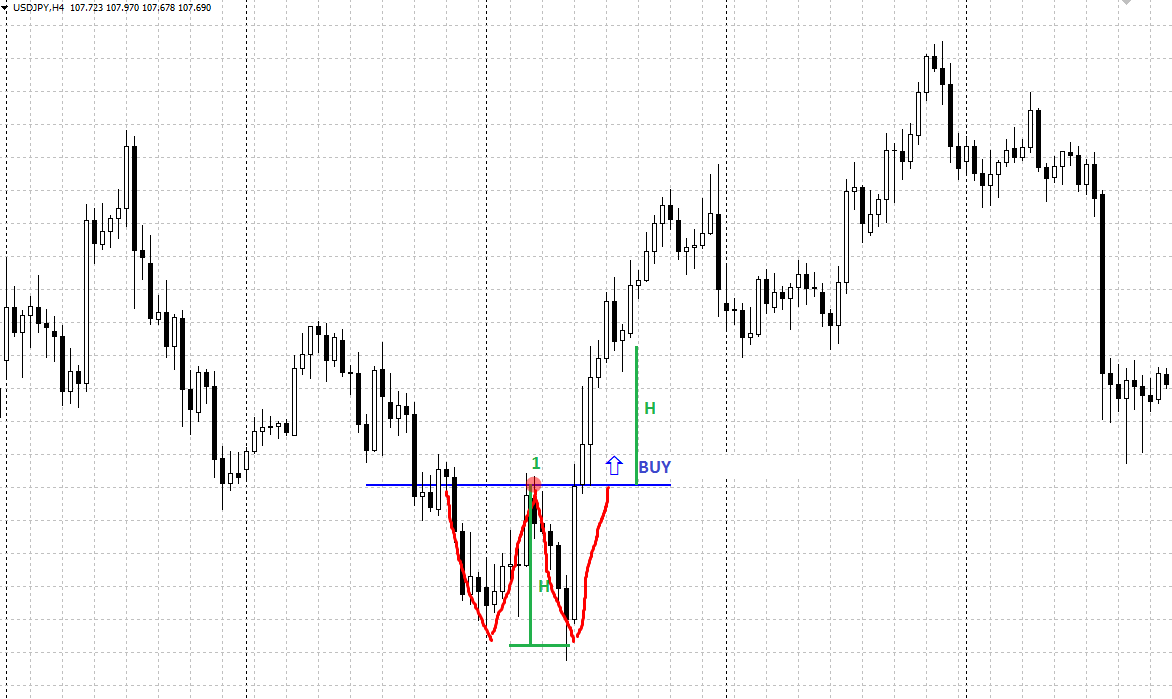
Double Bottom chart pattern is formed at lows within a descending tendency. A horizontal bottom line is drawn through 1. The trading pattern is considered completely formed only after the price fixes above the bottom line. After that, the price is expected to grow by the distance equal to, at least, the figure height, which is measured in pips from the pattern’s lows to the bottom line. One is recommended to buy right when the price breaks the bottom line or wait until it returns to the line after breaking it.
Triple Top and Triple Bottom Chart Patterns
These are reversal chart patterns, which are usually formed at local lows and highs of the price chart within either ascending or descending trend. The patterns indicate that the current tendency is getting weaker and the price is expected to either start a correction or reverse the tendency to the opposite side.
Triple Top
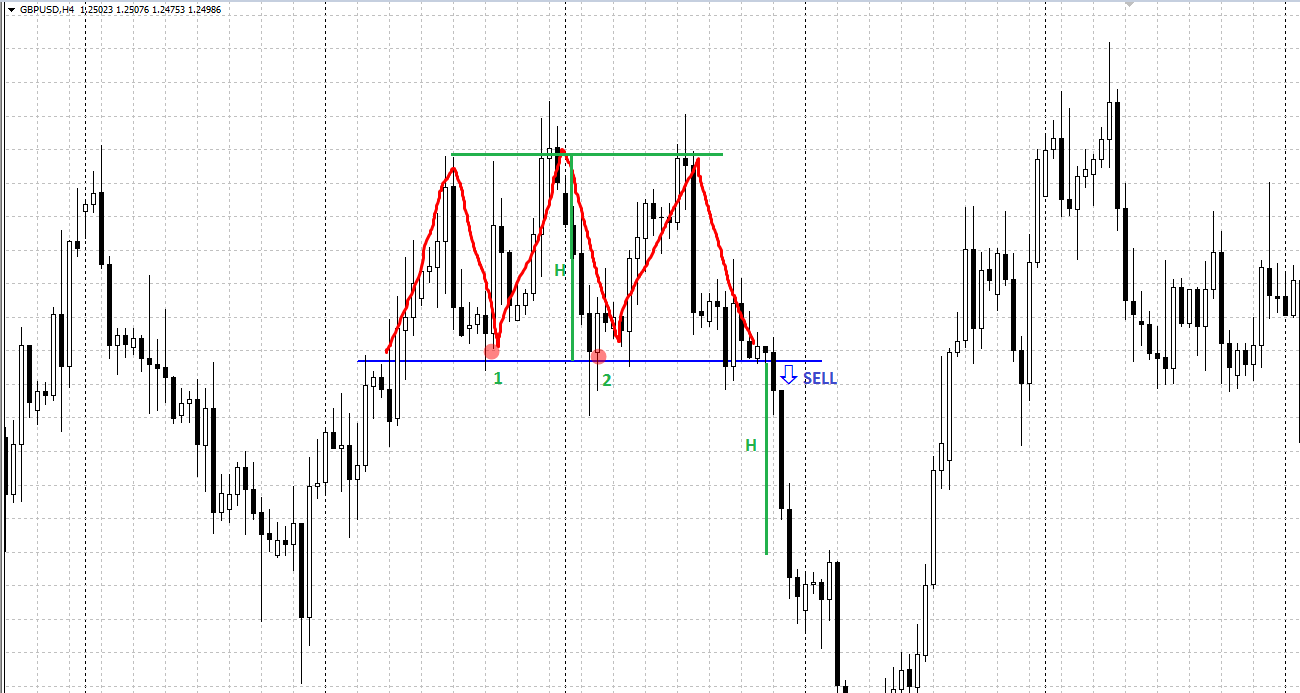
Triple Top chart pattern is formed at highs within an ascending tendency. A bottom line is drawn through 1 and 2. The trading pattern is considered completely formed only after the price fixes below the bottom line. After that, the price is expected to fall by the distance equal to, at least, the formation height, which is measured in pips from the pattern’s highs to the bottom line. One is recommended to sell right when the price breaks the bottom line or wait until it returns to the line after breaking it.
Triple Bottom
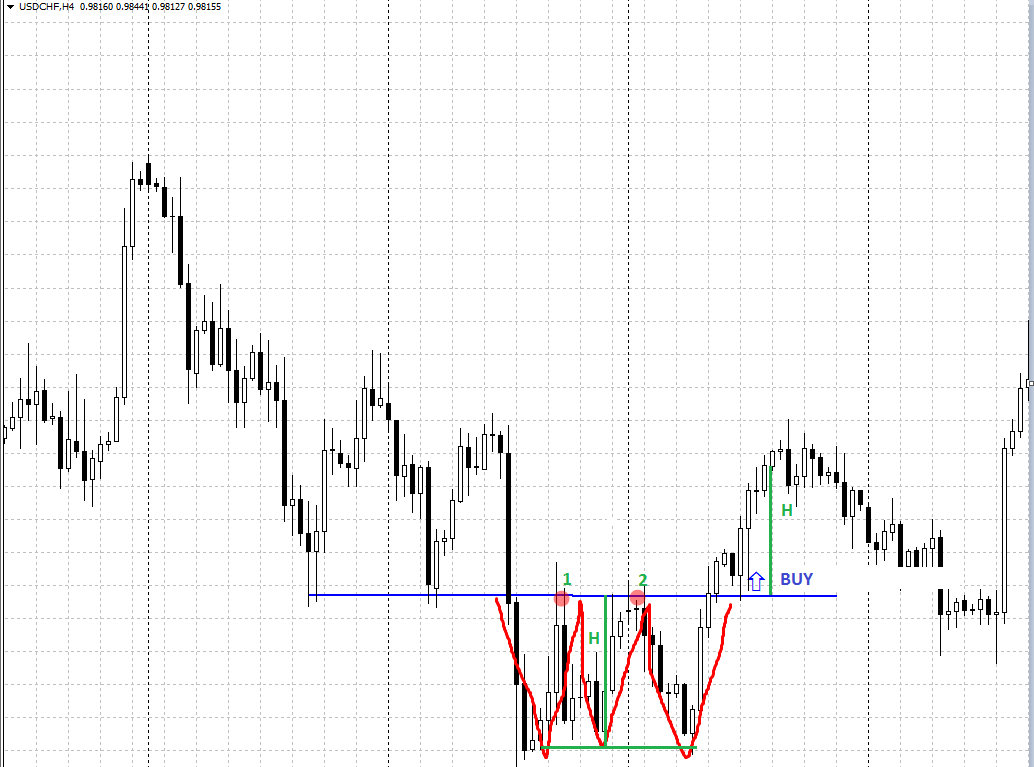
Triple Bottom chart pattern is formed at lows within a descending tendency. A bottom line is drawn through 1 and 2. The trading pattern is considered completely formed only after the price fixes above the bottom line. After that, the price is expected to grow by the distance equal to, at least, the formation height, which is measured in pips from the pattern’s lows to the bottom line. One is recommended to buy right when the price breaks the bottom line or wait until it returns to the line after breaking it.
Wedge Chart Pattern
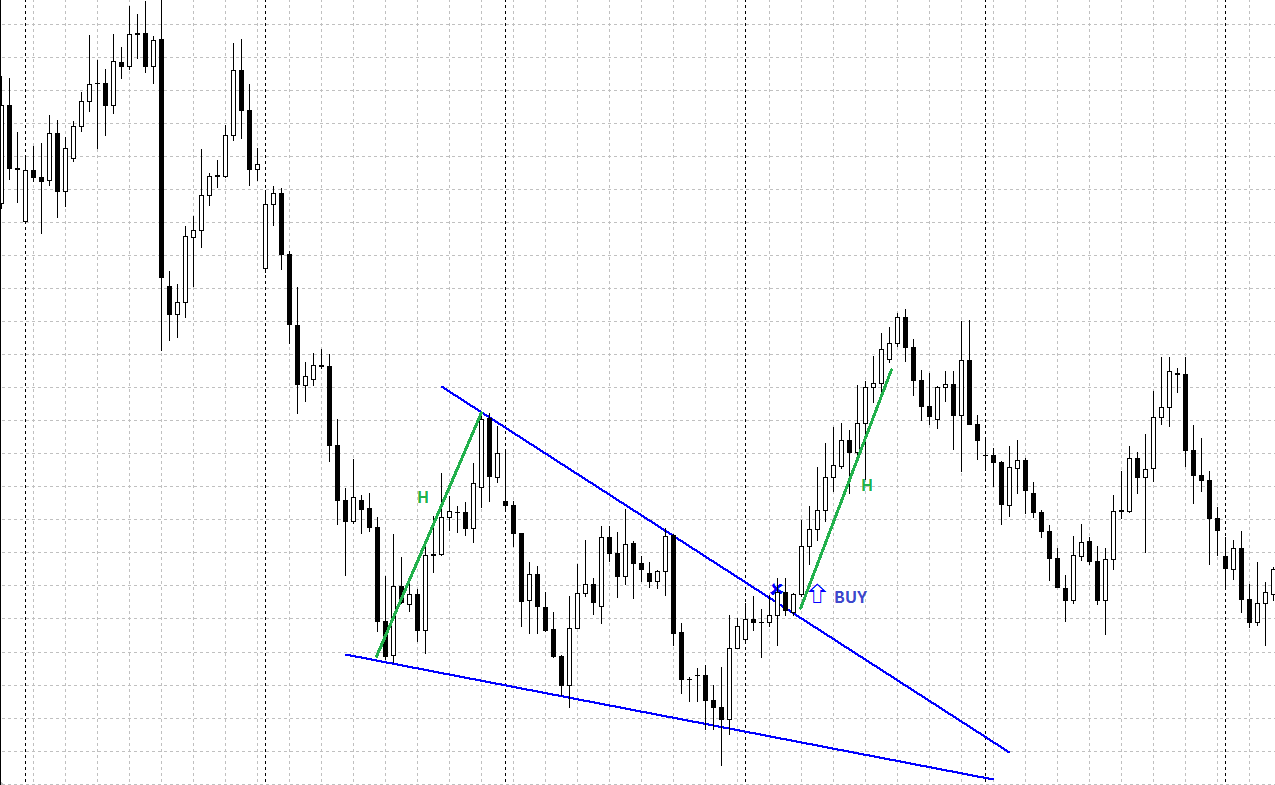
Wedge chart pattern is a reversal trading pattern, which is formed at highs and lows between two convergent lines, support and resistance. The chart pattern has some similar features of Triangle with the key distinction being skew angle (of both lines forming it) in the same direction. Wedge is considered broken when the price leaves the chart pattern in the direction that is opposite to the skew. If Wedge is formed at highs within an ascending tendency, one is recommended to sell after the price fixes below the support line; the target of the figure is the value of the chart pattern’s base (H) in pips. If Wedge is formed at lows within a descending tendency, one is recommended to buy after the price fixes above the resistance line; the target of the formation is the value of the chart pattern’s base (H) in pips.
Diamond Chart Pattern
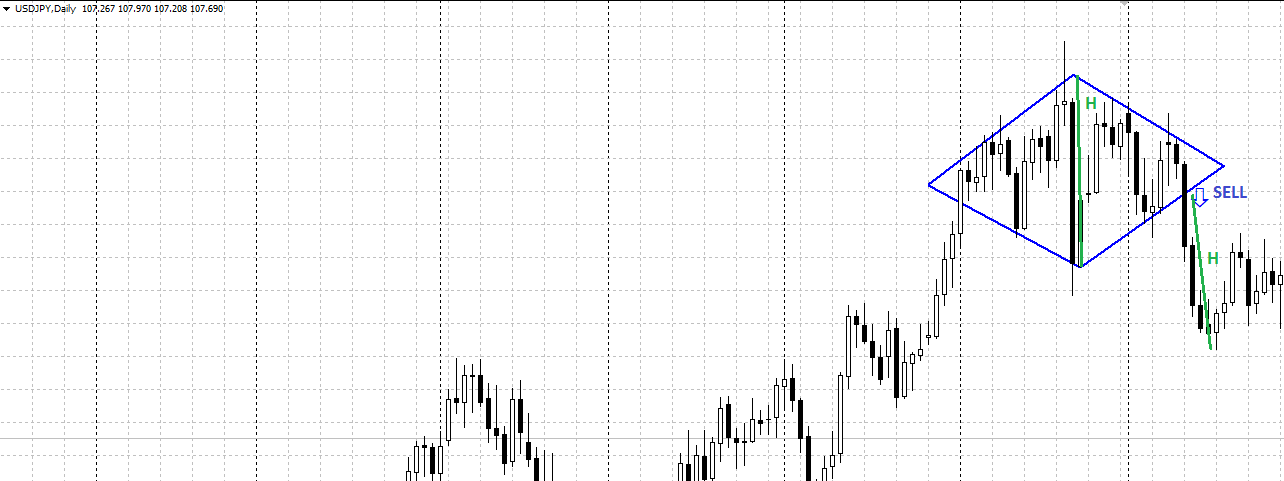
Diamond trading chart pattern is formed at local highs and lows of the price chart within either ascending or descending trend. The trading patterns indicate that the current tendency is getting weaker and the price is expected to either start a correction or reverse the tendency to the opposite side. If Diamond is formed at highs within an ascending tendency, one is recommended to sell after the price fixes below the support line; the target of the formation is the chart pattern’s height (H) in pips. If Diamond is formed at lows within a descending tendency, one is recommended to buy after the price fixes above the resistance line; the target of the figure is the chart pattern’s height (H) in pips.
Start Trading Now
Forex, stocks, indices and gold on MetaTrader 4 and MetaTrader 5, from a free demo account to a live one.
Rectangle Trading Chart Pattern
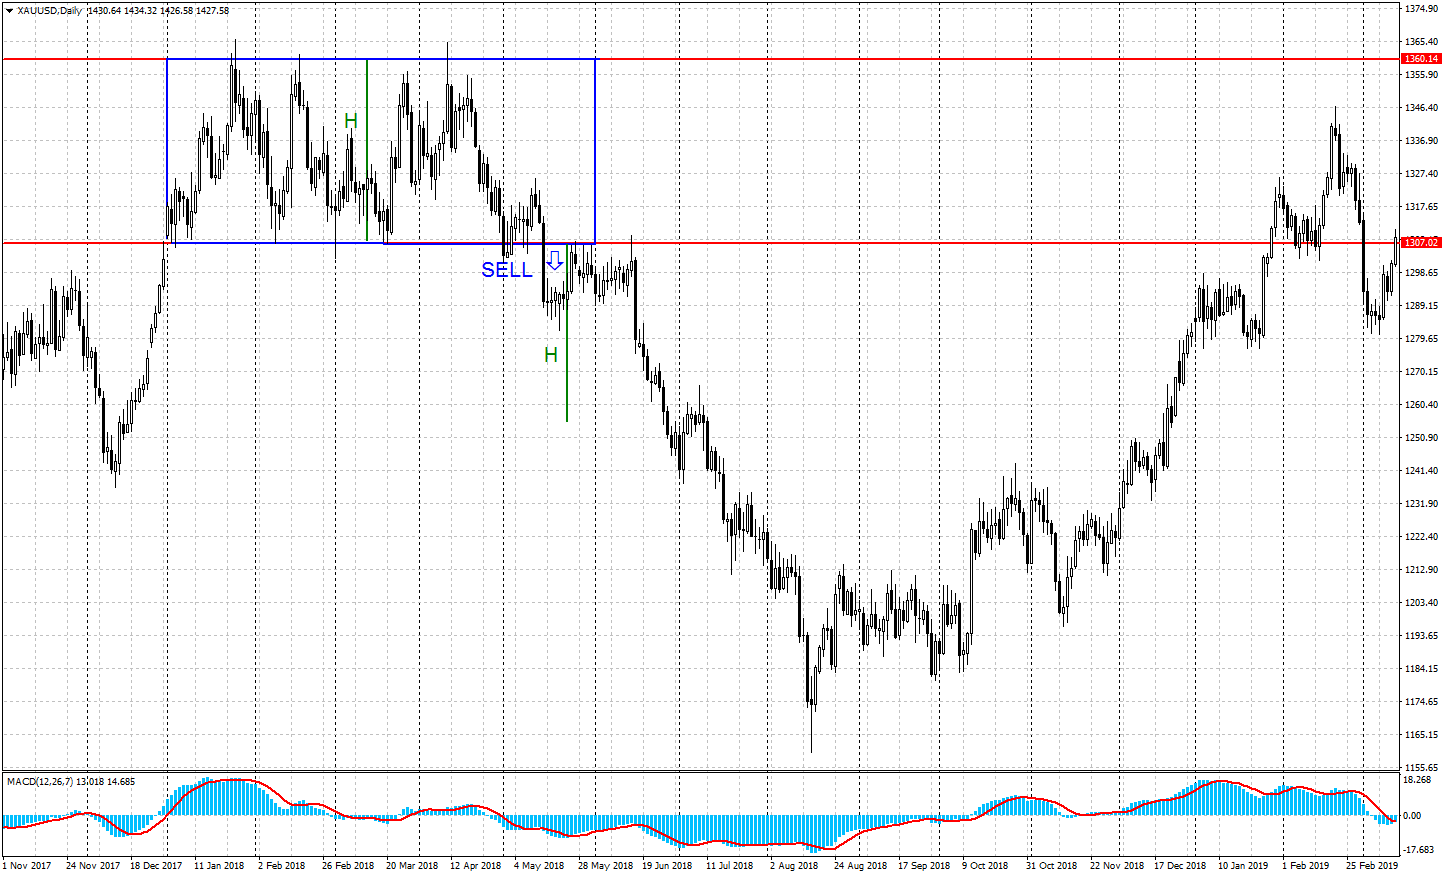
Rectangle trading chart pattern is a universal trading pattern that may predict both a reverse and a continuation of an actual tendency. It looks like a sideways channel formed by horizontal support and resistance level, where the price is consolidating. It is recommended to trade in the direction the formation is broken: if the price fixes above the resistance line, buy; if it fixes below the support line, sell. The target of the figure is the chart pattern’s height (H) in pips.
Flag Chart Pattern
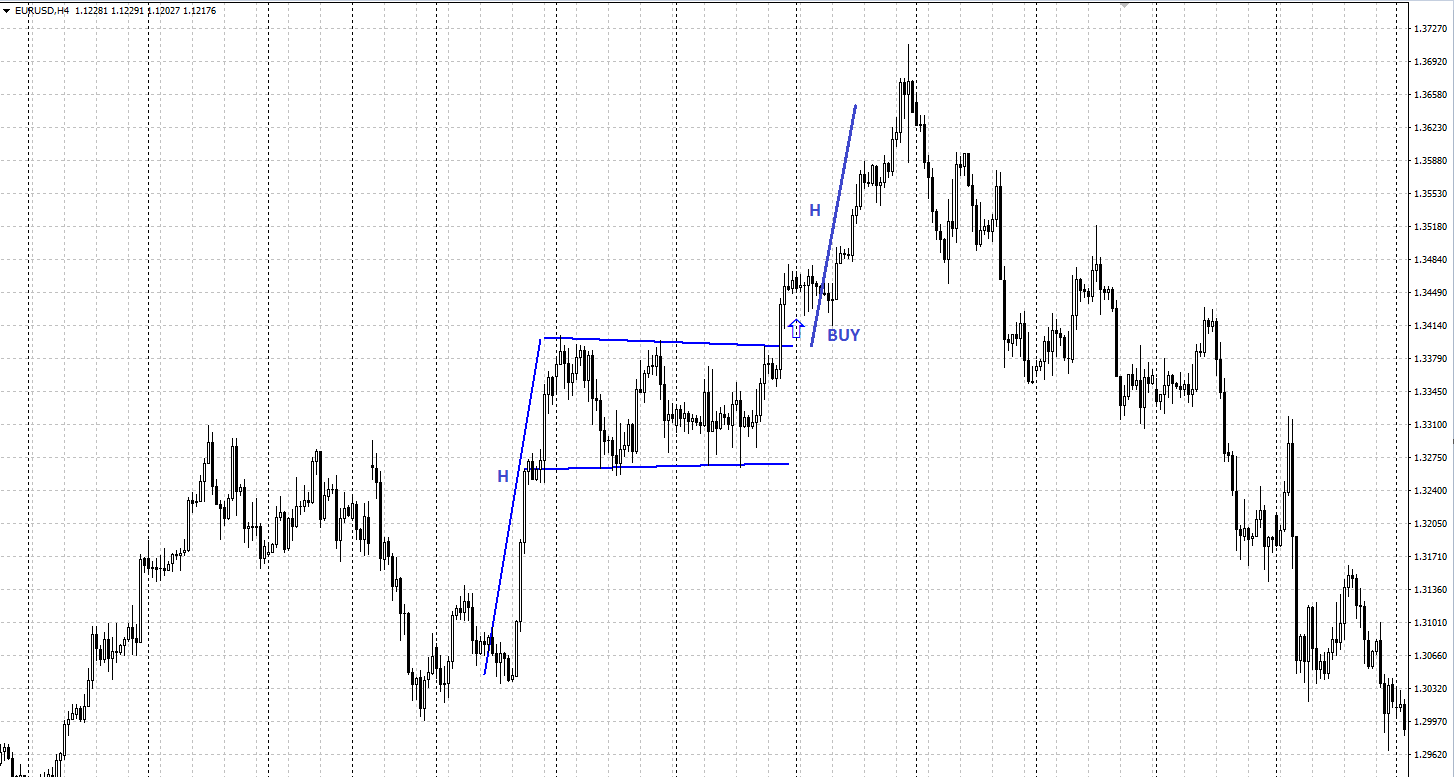
A flag pattern is a continuation trading pattern of an actual tendency. It looks like a flag: after a strong price movement (Flagpole), the price is forming a correctional area (Cloth), which is either horizontal or sloping towards the Flagpole. The Cloth may take the form of Rectangle, Triangle, or Wedge. After the price completes the correction and fixes above the resistance line of the Cloth, one is recommended to buy. The target of the chart pattern is the Flagpole’s height.
Pennant Pattern
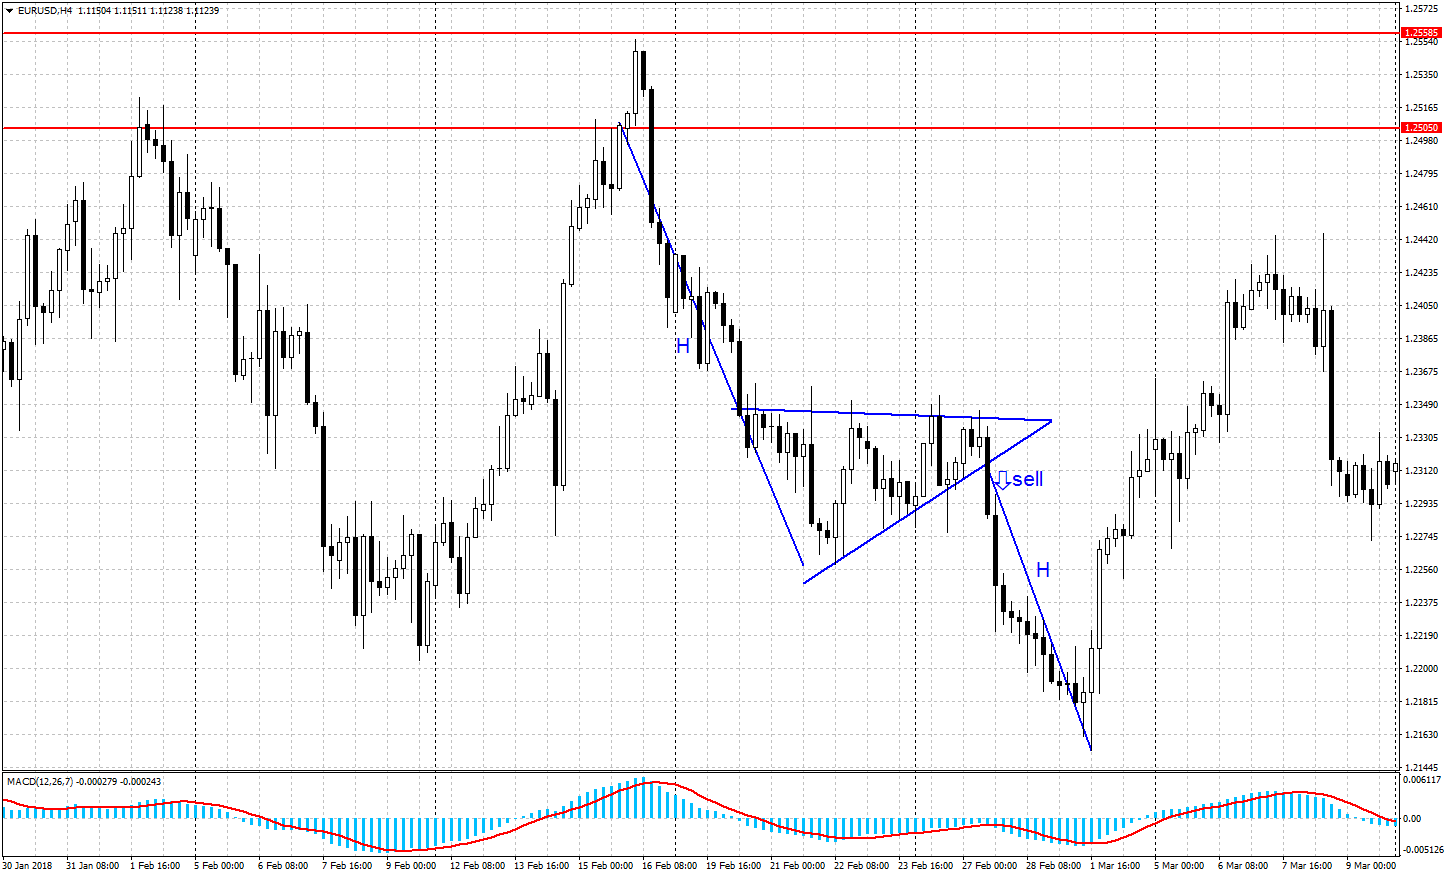
Same as the Flag, the pattern emerges after a strong price impulse, which is called pole. Then, the correction area forms, looking like a small converging Triangle or a Wedge (in more detail these patterns are described in the article “Triangle And Wedge Patterns in Technical Analysis”. An important detail again: if the Pennant is formed by a converging Triangle, it may be of any kind (symmetrical, ascending, descending), while if it is formed by a Wedge, it must be inclined against the impulse (the pole).
How to Trade the Pennant
Trade the Pennant in the direction of the pole. In the example above, EUR/USD falls sharply on H4, then pauses in a small converging triangle. The sell signal comes when a candle closes below the lower line of the pennant. Place the stop loss above the upper line, beyond the last high inside the pennant. Measure the height of the pole and project it down from the breakout point: that distance is the target. In an uptrend the rules mirror: buy on a close above the upper line, stop below the lower line.
Triangle Trading Chart Patterns
There are three key types of Triangle chart patterns:
Symmetrical Triangle
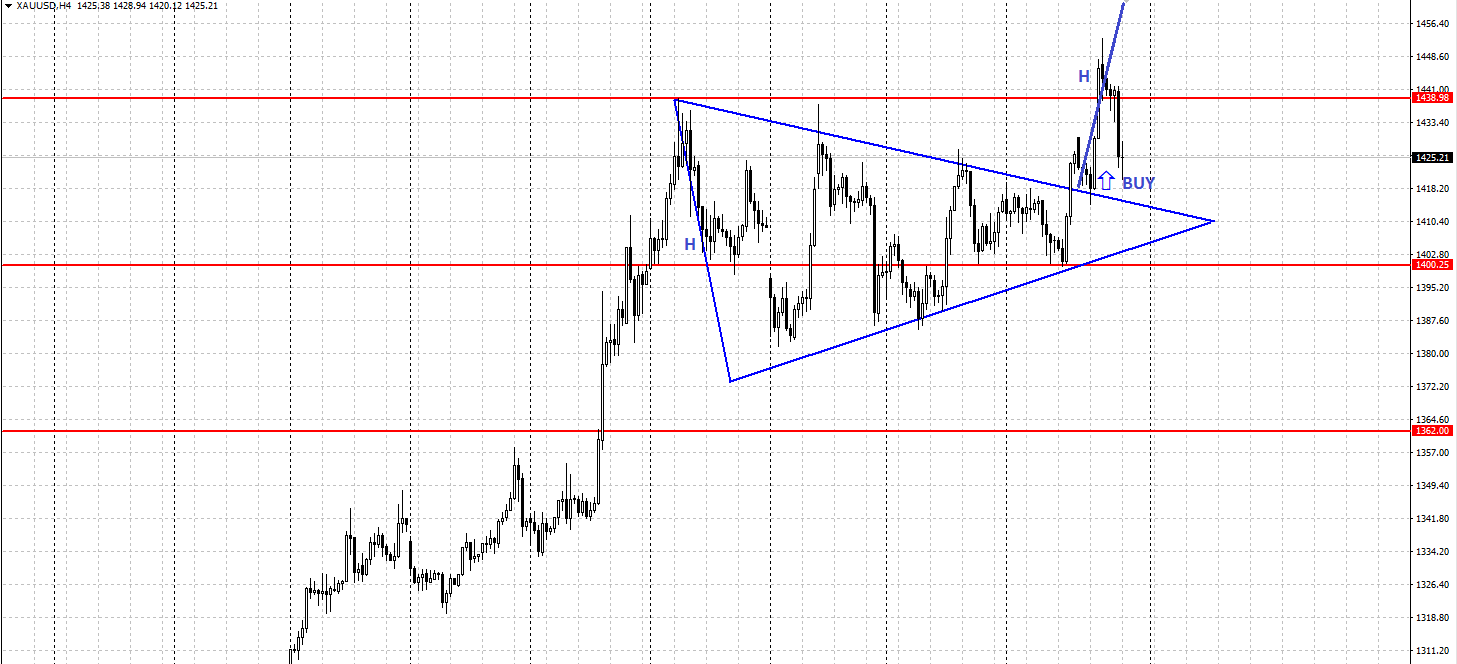
Symmetrical Triangle is a universal trading pattern that may predict both a reverse and a continuation of an actual tendency. It is formed between two convergent lines, support and resistance. It is recommended to trade in the direction the figure is broken: if the price fixes above the resistance line, buy; if it fixes below the support line, sell. The target of the figure is the value of the pattern’s base (H) in pips.
Ascending Triangle
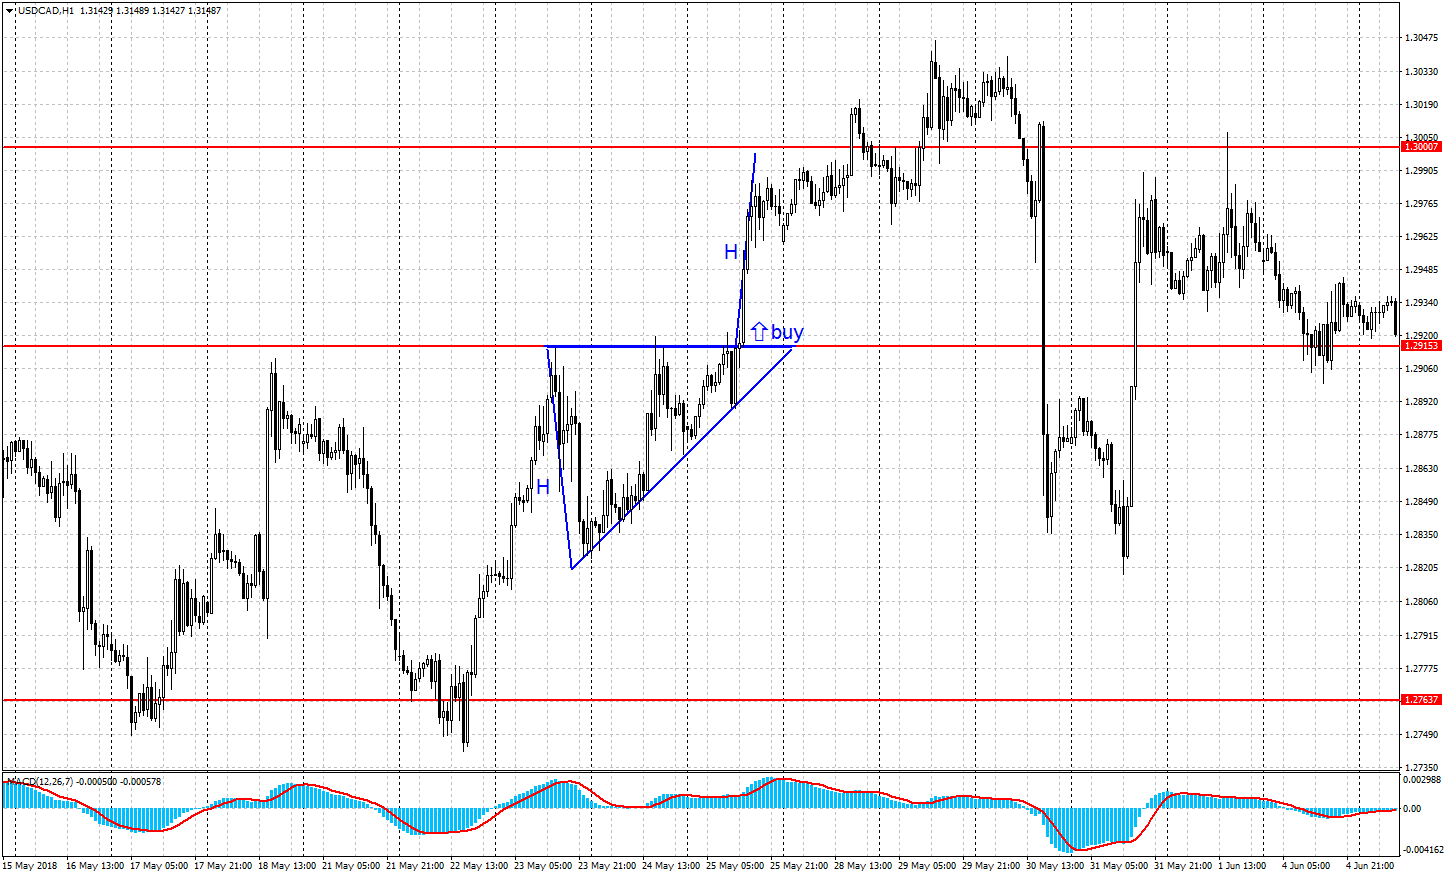
Ascending Triangle is an upside continuation trading pattern, which is formed between a horizontal resistance line and an ascending support line. After the price fixes above the resistance line, one is recommended to buy; the target of the figure is the value of the chart pattern’s base (H) in pips.
Descending Triangle
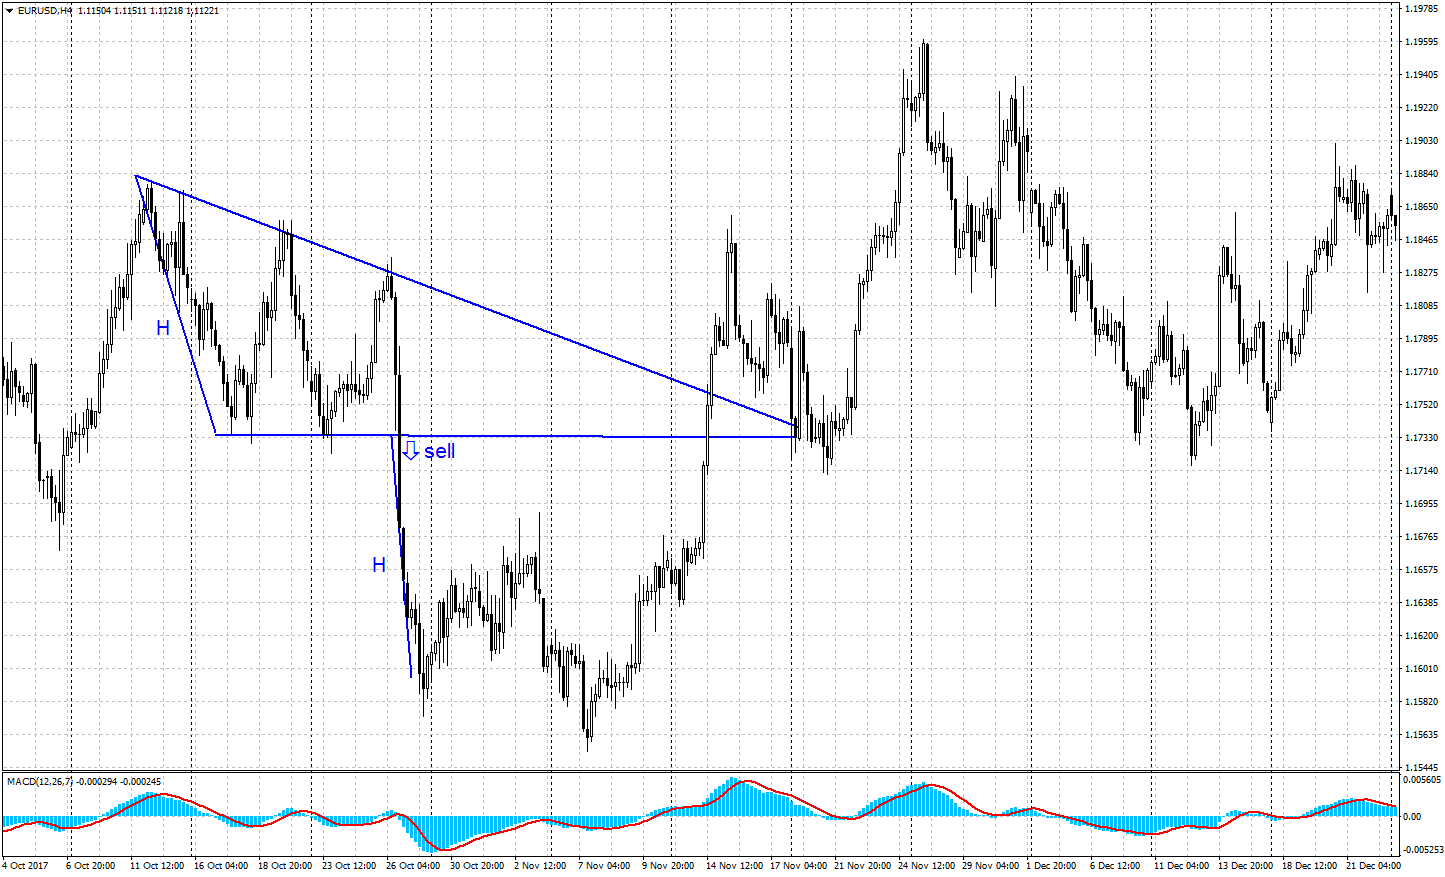
Descending Triangle is a downside continuation trading pattern, which is formed between a horizontal support line and a descending resistance line. After the price fixes below the support line, one is recommended to sell; the target of the formation is the value of the chart pattern’s base (H) in pips.
Trade Real Stocks in R StocksTrader
Real stocks, advanced charts and a free trading strategy builder in one terminal.
Bullish and Bearish Trading Chart Patterns
Bullish and bearish chart patterns are two types of patterns that traders use to analyze financial markets and make informed trading decisions. These patterns are based on the concept that past price movements can indicate future price movements.
Bullish Chart Patterns
Bullish chart patterns are patterns that indicate that the price of an asset is likely to increase. These patterns typically occur during uptrends or after a downtrend has ended. Some common bullish chart patterns include:
- Cup and Handle: A bullish continuation pattern that looks like a "U" shape, followed by a small dip and then a slightly upward-sloping handle. This pattern indicates that the price of the asset is likely to continue its uptrend.
- Ascending Triangle: A bullish continuation pattern that is characterized by a flat top and an upward-sloping bottom. This pattern indicates that the price of the asset is likely to continue its uptrend.
- Bullish Flag: A bullish continuation pattern that is characterized by a sharp price move followed by a brief period of consolidation. This pattern indicates that the price of the asset is likely to continue its uptrend.
Bearish Chart Patterns
Bearish chart patterns are patterns that indicate that the price of an asset is likely to decrease. These patterns typically occur during downtrends or after an uptrend has ended. Some common bearish chart patterns include:
- Double Top: A bearish reversal pattern that occurs when the price of an asset reaches a high point, drops, rises again to the same high point, and then drops again. This pattern indicates that the price of the asset is likely to reverse its uptrend and start a downtrend.
- Descending Triangle: A bearish continuation pattern that is characterized by a flat bottom and a downward-sloping top. This pattern indicates that the price of the asset is likely to continue its downtrend.
- Head and Shoulders: A bearish reversal pattern that consists of three peaks, with the middle peak (the head) being the highest. This pattern indicates that the price of the asset is likely to reverse its uptrend and start a downtrend.
Conclusion
In conclusion, chart patterns are an important tool that traders use to identify potential trading opportunities. By understanding these patterns, traders can make informed decisions about when to enter and exit markets. However, it is important to note that chart patterns are not foolproof and should be used in conjunction with other indicators and analysis tools. As with any type of trading, risk management is key, and traders should always use stop-loss orders and other risk management techniques to protect their capital.
FAQ
What is the most reliable chart pattern?
No pattern works every time. Head and Shoulders and the Double Top and Double Bottom are among the most widely followed, because the neckline gives a clear entry, a clear stop loss and a measurable target. Any pattern becomes more dependable on higher timeframes and when the breakout candle closes firmly beyond the line.
Do chart patterns work on crypto?
Yes. Chart patterns reflect how buyers and sellers behave, so they appear on any liquid market: currency pairs, gold, stocks, indices and cryptocurrencies. Crypto moves faster and further than most currency pairs, so traders there usually allow a wider stop loss and open a smaller position.
Which timeframe is best for chart patterns?
H4 and the daily chart give the clearest patterns and the fewest false signals, which is why most examples in this article use them. Patterns on M5 and M15 form more often and break more often. A practical start is to find the pattern on H4 and time the entry on H1.
What is the difference between continuation and reversal patterns?
Reversal patterns, such as Head and Shoulders, the Double and Triple Top and Bottom, the Wedge and the Diamond, signal that a trend is ending. Continuation patterns, such as the Flag, the Pennant and the Ascending and Descending Triangle, signal a pause before the trend resumes. The Rectangle and the Symmetrical Triangle can be either: the direction of the breakout decides. The Signal column in the summary table shows which are bullish chart patterns and which are bearish chart patterns.
How can you tell a false breakout from a real one?
Wait for a candle to close beyond the line before entering, and watch whether the price holds there or retests the line from the other side. A real breakout usually comes with a strong candle and moves away from the pattern. If the price slips back inside the pattern soon after, treat the breakout as false and let the stop loss close the trade.
Any information provided in articles on this website is based solely on the personal opinions of the authors. These articles should not be construed as trading recommendations or a call to action. The authors and RoboForex accept no responsibility for the results of any trades made on the basis of these recommendations and reviews. Past performance is not indicative of future results. Trading stocks and CFDs involves a high risk of capital loss.