How to Choose a Timeframe for Trading
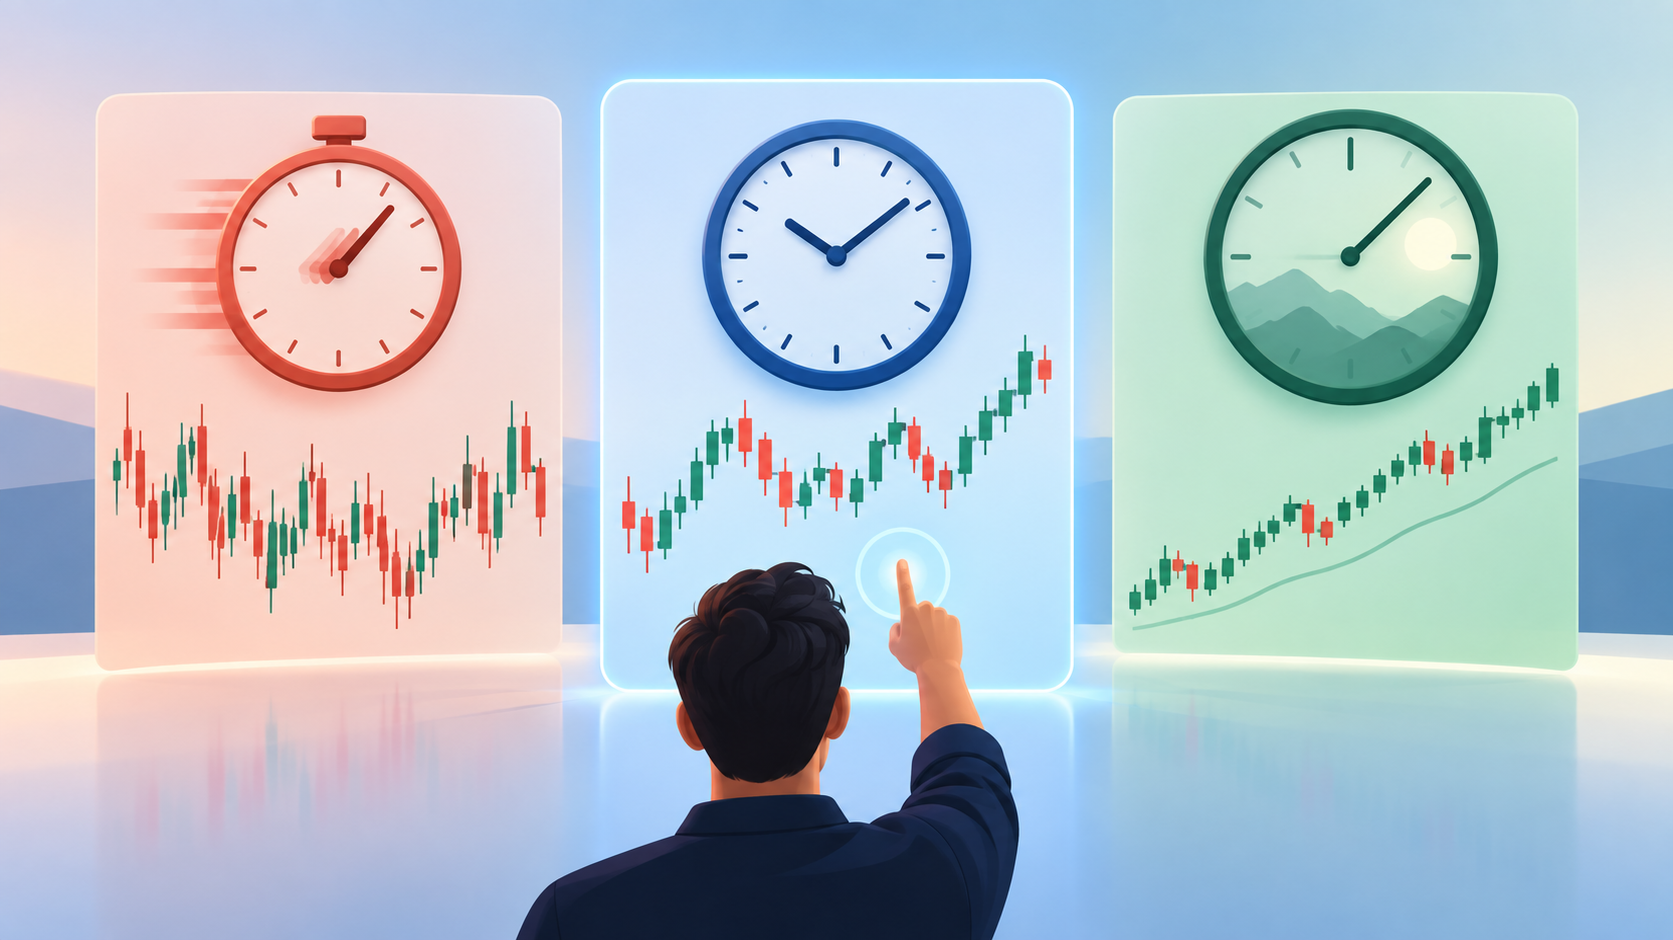
How to choose a timeframe for trading depends on two things: how much time you can give the market and the size of your deposit. Scalping uses M1 to M5, day trading M15 to H1, swing trading H1 to D1, and long-term trading W1 and MN. Most strategies read the trend on a larger timeframe and enter on a smaller one.
TL;DR
- Decide how many hours a day you can trade and pick the style that fits: scalping, day, swing or long-term trading.
- Choose a main timeframe for the trend and a smaller one for entries, as the table below shows.
- Start with H1 to H4 on a demo account and move to faster charts only once your results are steady.
In this review, we will speak about choosing a timeframe for trading. This is an important part of your trading strategy.
What Is a Timeframe?
A timeframe is a time interval for representing the quotations on the chart. As a rule, price movement is represented on the chart as candlesticks (or bars) with the same period, corresponding to the chosen timeframe. The larger the timeframe, the bigger "volume" of the price movement is shown by each candlestick on the chart.
You may set up any timeframe for the price chart but normally traders use basic conventional timeframes:
- MN is a monthly timeframe, each candlestick shows the price movement during a month.
- W1 is a weekly timeframe, each candlestick shows the price movement during a week.
- D1 is a daily timeframe, each candlestick shows the price movement during a day.
- H4 is a four-hour timeframe, each candlestick shows the price movement during four hours.
- H1 is an hourly timeframe, each candlestick shows the price movement during an hour.
- M30 is a 30-minute timeframe, each candlestick shows the price movement during 30 minutes.
- M15 is a 15-minute timeframe, each candlestick shows the price movement during 15 minutes.
- M5 is a 5-minute timeframe, each candlestick shows the price movement during 5 minutes.
- M1 is a minute timeframe, each candlestick shows the price movement during a minute.
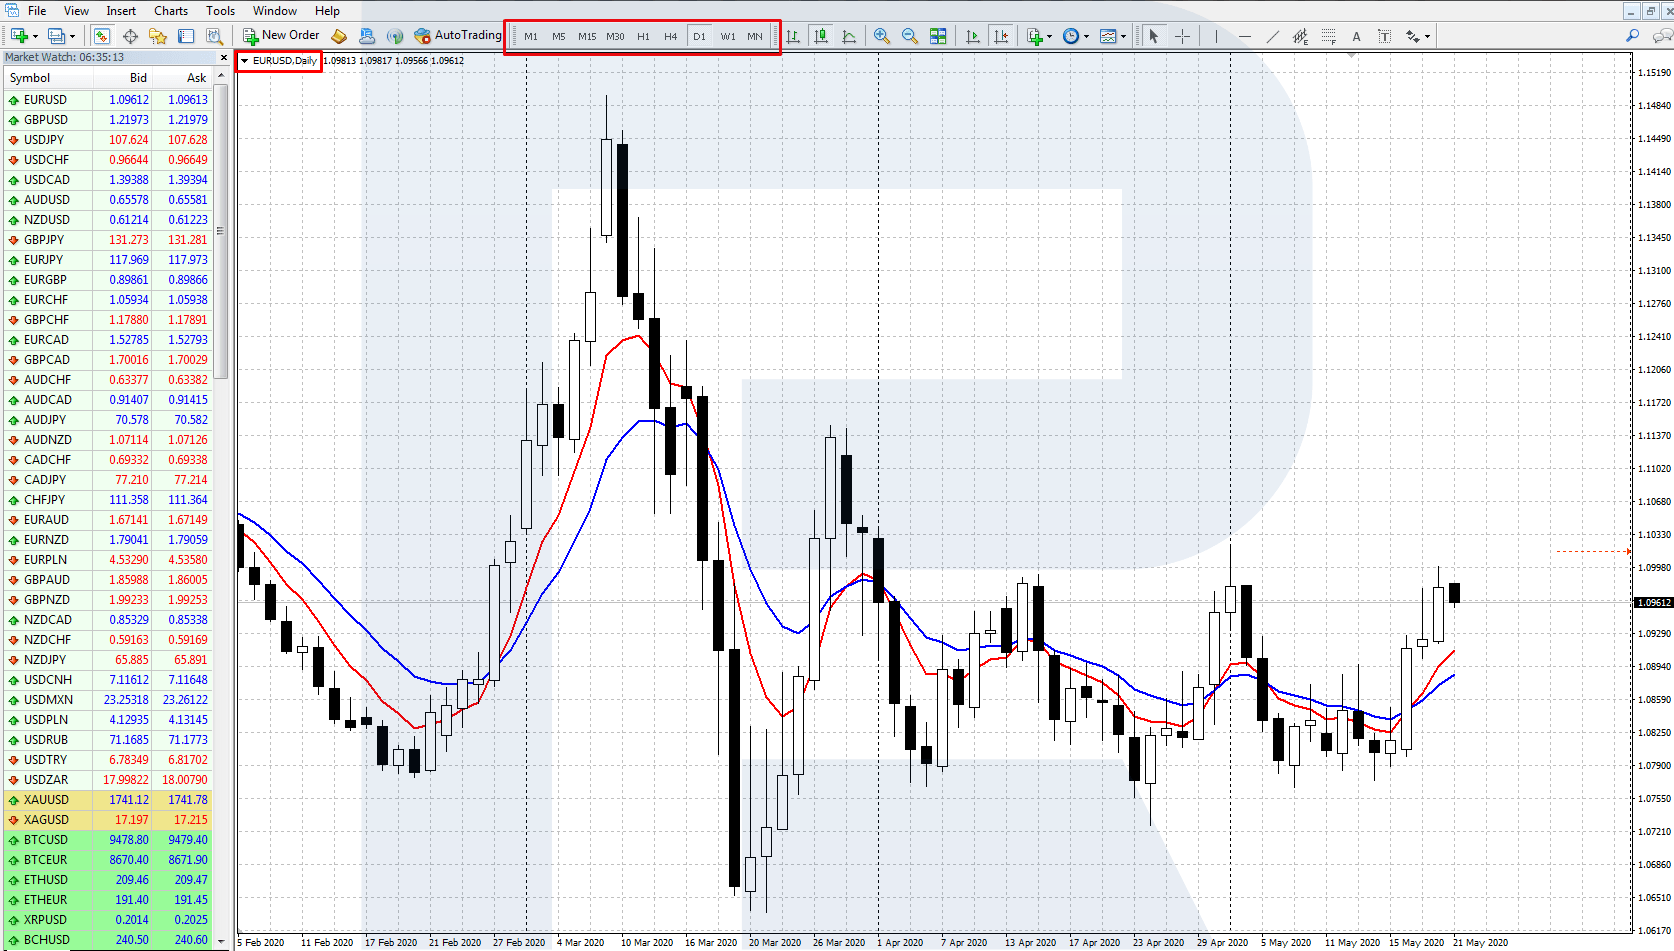
The timeframe is chosen in the trading terminal. In such popular terminals as MetaTrader 4 and MetaTrader 5, there is a table of active buttons for the main timeframes on the Instrument board. Left-clicking the buttons, you can quickly switch from one timeframe to another.
Trade on the Go With RoboForex MobileTrader
A portable trading workstation on your phone, on Android and iOS.
How to Choose a Timeframe?
To analyze the price chart, we normally use not one but several timeframes. Analyzing the price movements on several timeframes, the trader receives a vaster picture of the dynamics of the financial instrument. This helps to forecast price movements for different intervals depending on your trading strategy.
While for the general analysis of your financial instrument you may use all timeframes at once, for making trades you need a "narrower horizon". In many trend strategies based on the main rules of tech analysis, we usually choose two timeframes:
- The main timeframe is a longer one, on which we use fundamental and/or technical analysis to assess the current state and perspective of the financial instrument. On this timeframe, we define the actual trend and the direction for trading.
- An additional timeframe is a smaller timeframe that gives signals to enter (and sometimes exit) the market in the direction chosen on the larger timeframe. A trade may be opened based on the signals from indicators, levels, tech analysis or Price Action patterns, etc.
To make up your mind about the timeframes for trading, you must decide upon your trading style. Pay attention to two important criteria:
- The amount of time you can devote to trading
- The sum you can deposit on your account
These two criteria taken together will show which trading style is preferable for you: long-term, medium-term, or short-term trading. In a rare case when you have a lot of free time and a substantial deposit, you may choose any trading style that seems comfortable and/or profitable to you.
The table sums up how the timeframe links to the trading style, the holding time and the cost of the spread.
| Timeframe | Trading style | Holding time | Trades per day | Effect of the spread | Who it suits |
|---|---|---|---|---|---|
| M1 to M5 | Scalping | Minutes | Many, often 10 or more | High: the spread is a large part of a small target | Traders who can watch the screen all session |
| M15 to M30 | Day trading | Minutes to hours, closed the same day | A few | Noticeable | Traders with several free hours a day |
| H1 to H4 | Swing and day trading | Hours to two or three days | One or two | Moderate | Most beginners and part-time traders |
| D1 | Swing and medium-term trading | Days to weeks | A few a week | Low | Traders who check the market once a day |
| W1 to MN | Long-term trading | Weeks to months | A few a month | Very low | Traders with little time and a large deposit |
Timeframes for Long-Term Trading (D1, W1, MN)
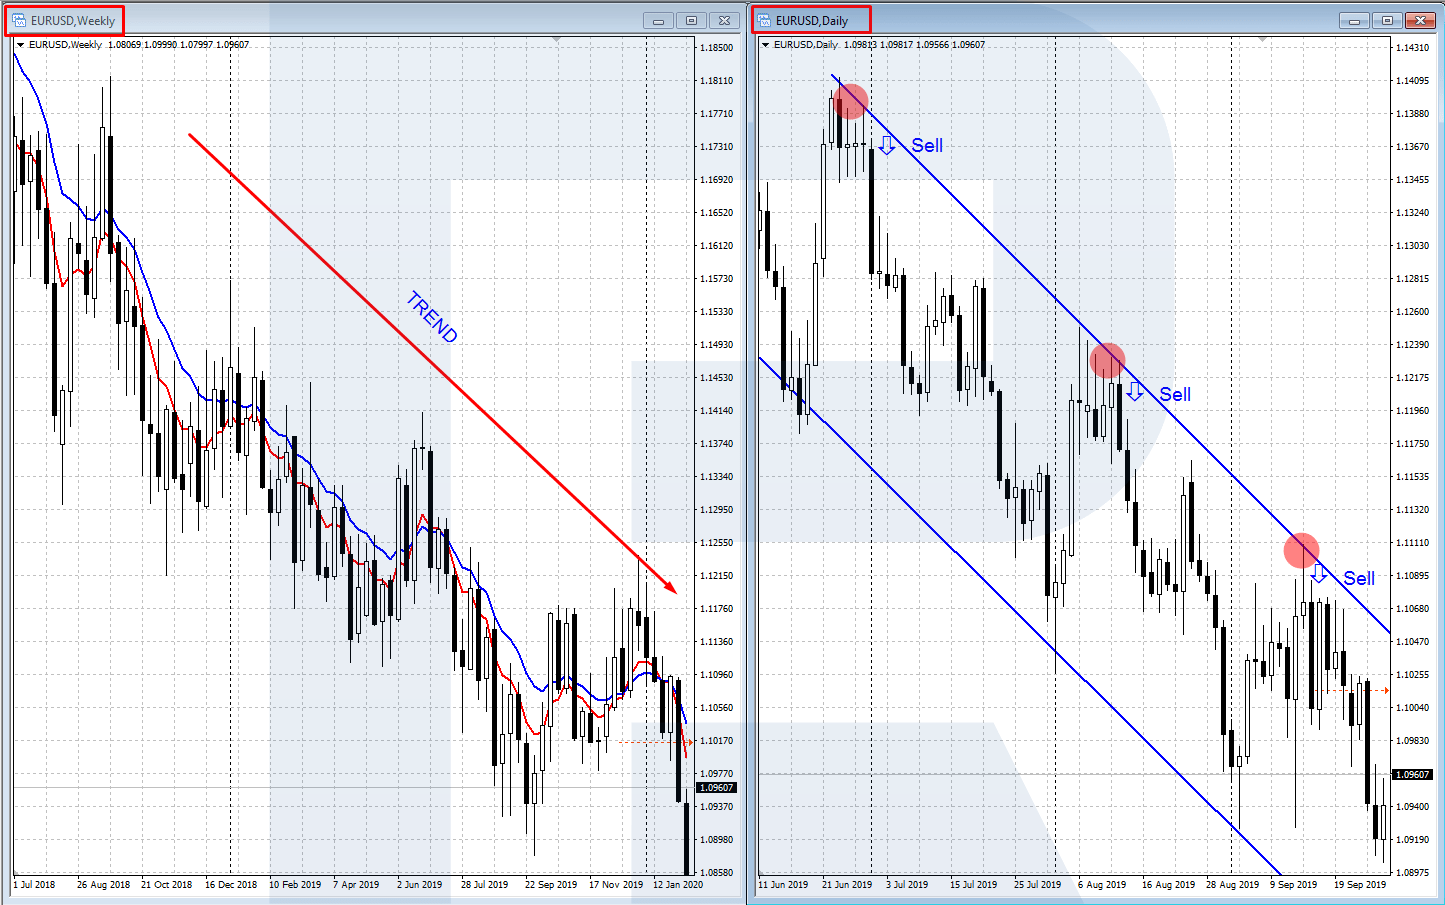
Long-term trading normally means a relatively small number of trades that remain in the market for a long time, from several weeks to several months. This trading style is similar to investing: you choose an instrument that promises a substantial movement and make decision mostly based on fundamental analysis.
Criteria for long-term trading:
- Little time for trading: you spend less than 1/5 of your worktime on it.
- The deposit is large, you may enter the market with a large position for a long term, place big Stop Losses, and withstand deep drawdowns (from 50,000 USD).
As the main timeframe for long-term trading, on which you will define the main trend and its aim, the MN (monthly) and W1 (weekly) timeframes will be the best. As an additional timeframe for finding entry points, use D1. In the picture, you can see these timeframes in use:
Timeframes for Medium-Term Trading (H1, H4, D1)
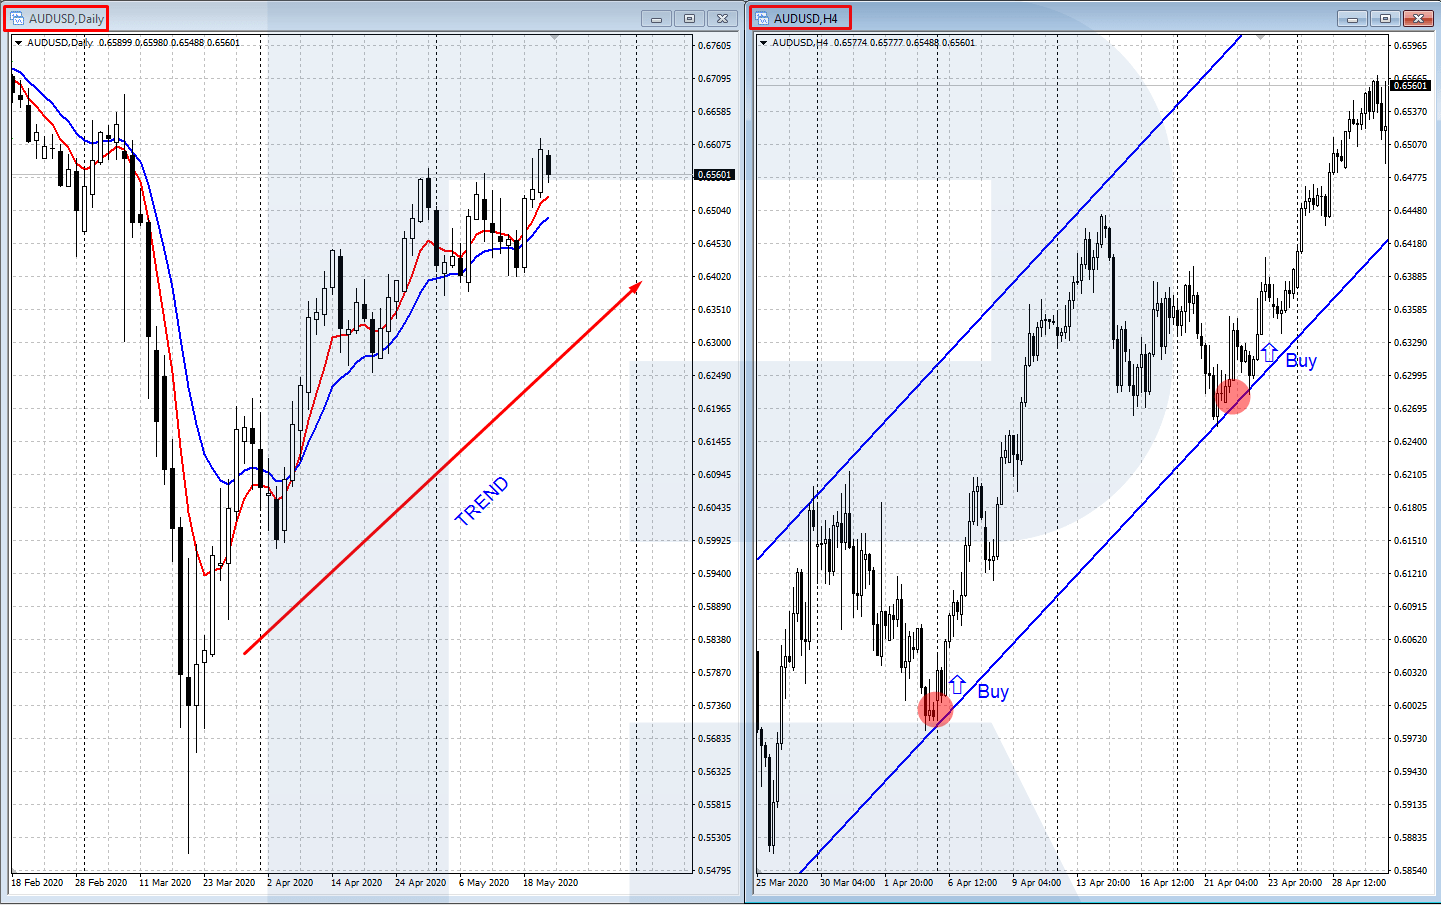
The planning horizon for medium-term trading is one day to one month. There are more trades compared to long-term trading, and the trades become less lengthy. The idea of medium-term trading is to catch a good daily impulse of price movement, collect the profit, and wait for the next impulse.
The criteria for medium-term trading are as follows:
- You have a moderate amount of time for trading, roughly 1/5 to 1/2 of your work time.
- Your deposit is also moderate, allowing you to open weighty trades planned for several days (10,000 to 50,000 USD).
As the main timeframe for defining the actual trend and its aims, you may use D1 or H4. As the smaller additional timeframe giving you entry points, use H4 or H1. An example of these timeframes in use is below:
Start Trading Now
Forex, stocks, indices and gold on MetaTrader 4 and MetaTrader 5, from a free demo account to a live one.
Timeframes for Scalping, Day and Swing Trading (M1 to D1)
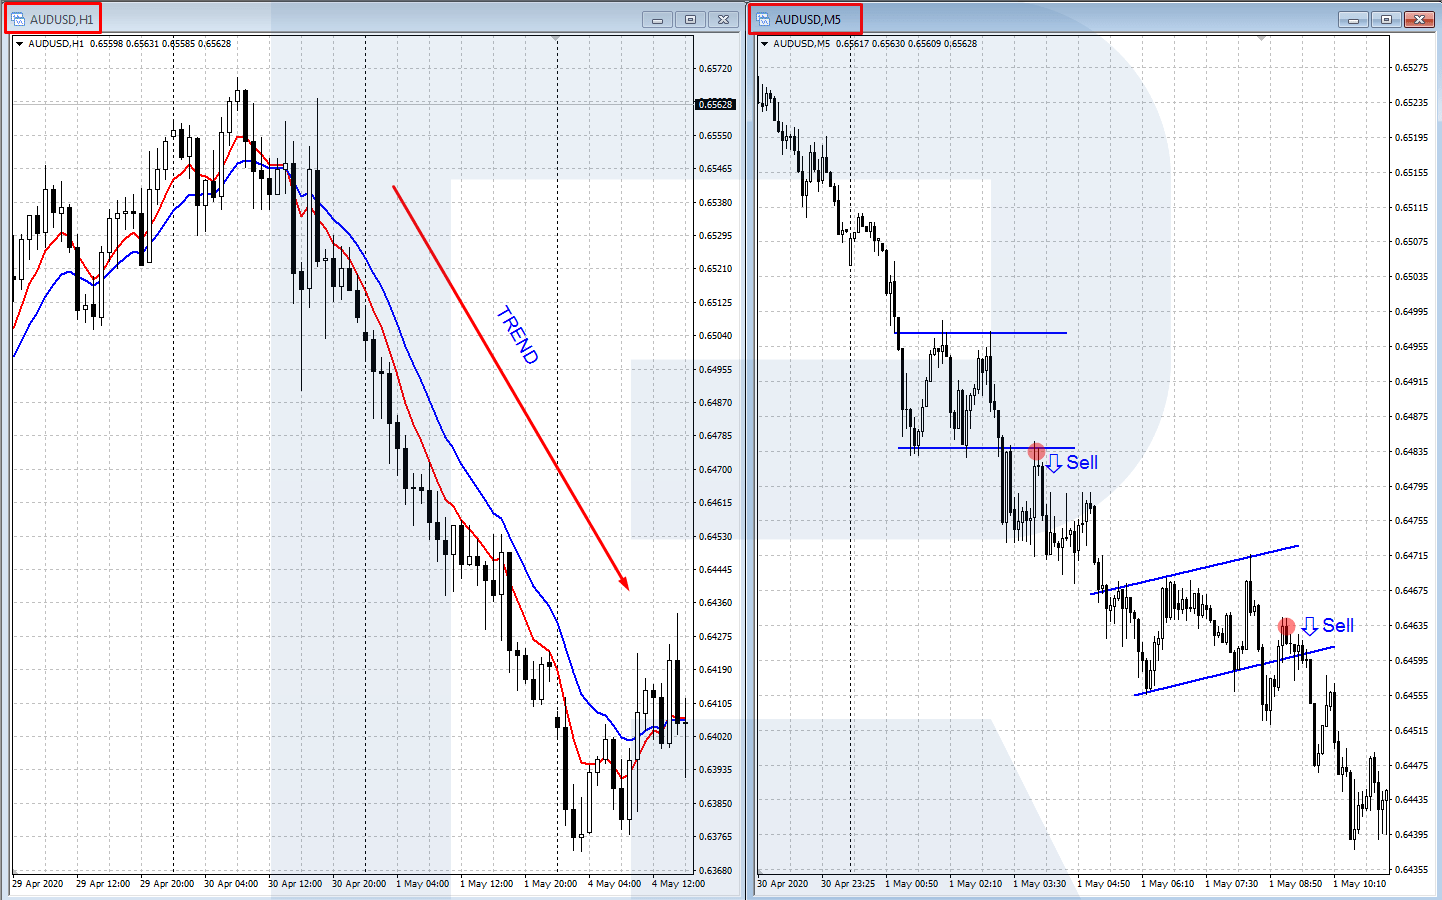
Short-term trading must be the most widespread type of trading. It is more available because you can trade even with a small deposit, however, it requires more time and iron-cast discipline. Short-term trading includes such types as:
- Swing trading: trades last from several hours to two-three days.
- Daytrading: trading intraday, without transferring your position to the next day.
- Scalping presumes a lot of short-term trades intraday with a profit of several points.
Criteria for short-term trading are as follows:
- A lot of time for trading: from 1/2 of your work time to full employment.
- A small or moderate deposit which allows you trades with small Stop Losses and short-term aims (up to 10,000 USD).
For short-term trading, there are more timeframe options. As the main one, you may choose M30, H1, H4, or D1. As an additional timeframe, choose out of M1, M5, M15, M30, and H1. You may see an example of short-term trading with these timeframes below:
Multi-Timeframe Analysis
Multi-timeframe analysis means reading the same instrument on three timeframes, from the largest to the smallest, and trading only when they agree. It puts into practice the idea of a main and an additional timeframe described above. A common set for day trading is D1, H1 and M15. Here is how it works on EUR/USD:
- D1, the trend. Open the EUR/USD chart on the daily timeframe. If the pair makes higher highs and higher lows, the trend is up, and you look only for buys.
- H1, the setup. Switch to the hourly chart and wait for a pullback against the daily trend, for example a fall to a support level or a rising trend line.
- M15, the entry. On the 15-minute chart, wait for the pullback to end: a bullish reversal candle or a break of the small downtrend line. Enter there, with the stop loss below the pullback low.
The larger timeframe keeps you on the side of the main trend, and the smaller one gives a precise entry with a short stop loss. If the three timeframes disagree, skip the trade. The same logic works with other sets, such as W1, D1 and H4 for swing trading or H1, M15 and M1 for scalping.
Best Timeframe for Beginners
The best timeframe for beginners is H1 to H4 for the entry, with D1 for the trend. On these charts a candle takes long enough to form that you have time to think, the spread is a small part of each move, and false signals are rarer than on minute charts. You can check the market a few times a day and still keep a job or study.
Scalping on M1 and M5 looks attractive because it produces many trades, but it demands quick decisions, a tight spread and full attention for hours. Start with the higher timeframes, build a record of trades on a demo account in MetaTrader 5, and move to faster charts only once your results are steady.
Bottom Line
The choice of your timeframe is a key part of your trading strategy. For the general market analysis, you can use all timeframes but for opening trades, choose those that suit your trading style. Most often, trading strategies use two timeframes: the main and additional ones.
As an example of the use of two timeframes, you may get acquainted with the Triple Screen trading system by a successful trader and popular author Alexander Elder.
FAQ
What do M1, M5, H1, H4 and D1 mean in trading?
They are timeframes, the period one candle covers on the chart. M1 is one minute, M5 five minutes, M15 fifteen minutes, H1 one hour, H4 four hours, D1 one day, W1 one week and MN one month.
What is the best timeframe for beginners?
H1 to H4 for entries, with D1 for the trend. Candles form slowly enough to leave time for decisions, the spread is small relative to each move, and there are fewer false signals than on minute charts.
Which timeframe is best for scalping?
M1 to M5 for entries, often with M15 or H1 to read the short-term trend. Scalping needs a tight spread and full attention, because targets are only a few points.
Which timeframe is best for swing trading?
H4 and D1. Swing trades last from several hours to a few days, so the four-hour and daily charts show the swings clearly without the noise of minute charts.
Should I use more than one timeframe?
Yes. Most strategies use two or three: a larger one for the trend and a smaller one for the entry. Trade only when they point the same way.
Any information provided in articles on this website is based solely on the personal opinions of the authors. These articles should not be construed as trading recommendations or a call to action. The authors and RoboForex accept no responsibility for the results of any trades made on the basis of these recommendations and reviews. Past performance is not indicative of future results. Trading stocks and CFDs involves a high risk of capital loss.