Trading Like Sperandeo: 1-2-3 Reversal and 2B Pattern

The 2B pattern is a false breakout reversal setup by Victor Sperandeo: the price makes a new high or low beyond the previous one, fails to hold it and closes back, which signals a reversal. Traders enter on that close, with the stop behind the new extreme. Sperandeo's 1-2-3 reversal confirms the same turn more slowly: the trendline breaks, the price fails to renew the extreme, and then it breaks the last swing low or high.
TL;DR
- Trade the 2B when the price closes back beyond a broken high or low, with the stop behind the new extreme and a target up to 5 times the stop.
- Draw the trendline by Sperandeo's rules and watch for its break, the first sign of a reversal.
- Enter the 1-2-3 trade when the price breaks point 2, with the stop loss behind point 3.
In this article, we will discuss the trading methods of a famous Wall Street trader Victor Sperandeo. A long-time experience of trading on exchanges and managing investments as well as several books on trading have brought Sperandeo the popularity he deserves.
2B Pattern
2B pattern or 2B indicator, as Sperandeo calls it in his book, is a reversal formation consisting of two adjacent market highs/lows. On the price chart, the 2B pattern looks like the Double Top formation (or Double Bottom in a downtrend), and the trading principle resembles the Turtle Soup by Linda Raschke.
The idea behind it is that a failed breakout is a strong signal. When the price breaks a previous high, traders who trade breakouts buy and sellers place their stops above that high. If the move cannot hold and the price closes back below the old high, the breakout buyers are trapped, and their exits add to the fall. That is why a 2B often marks the very top or bottom of a move and can come before a full 1-2-3 reversal, covered below: the failed high of a 2B is often point 3. The entry comes early, close to the extreme, so the stop loss behind the new high or low is short and the target can be several times larger.
The 2B Pattern in an Uptrend
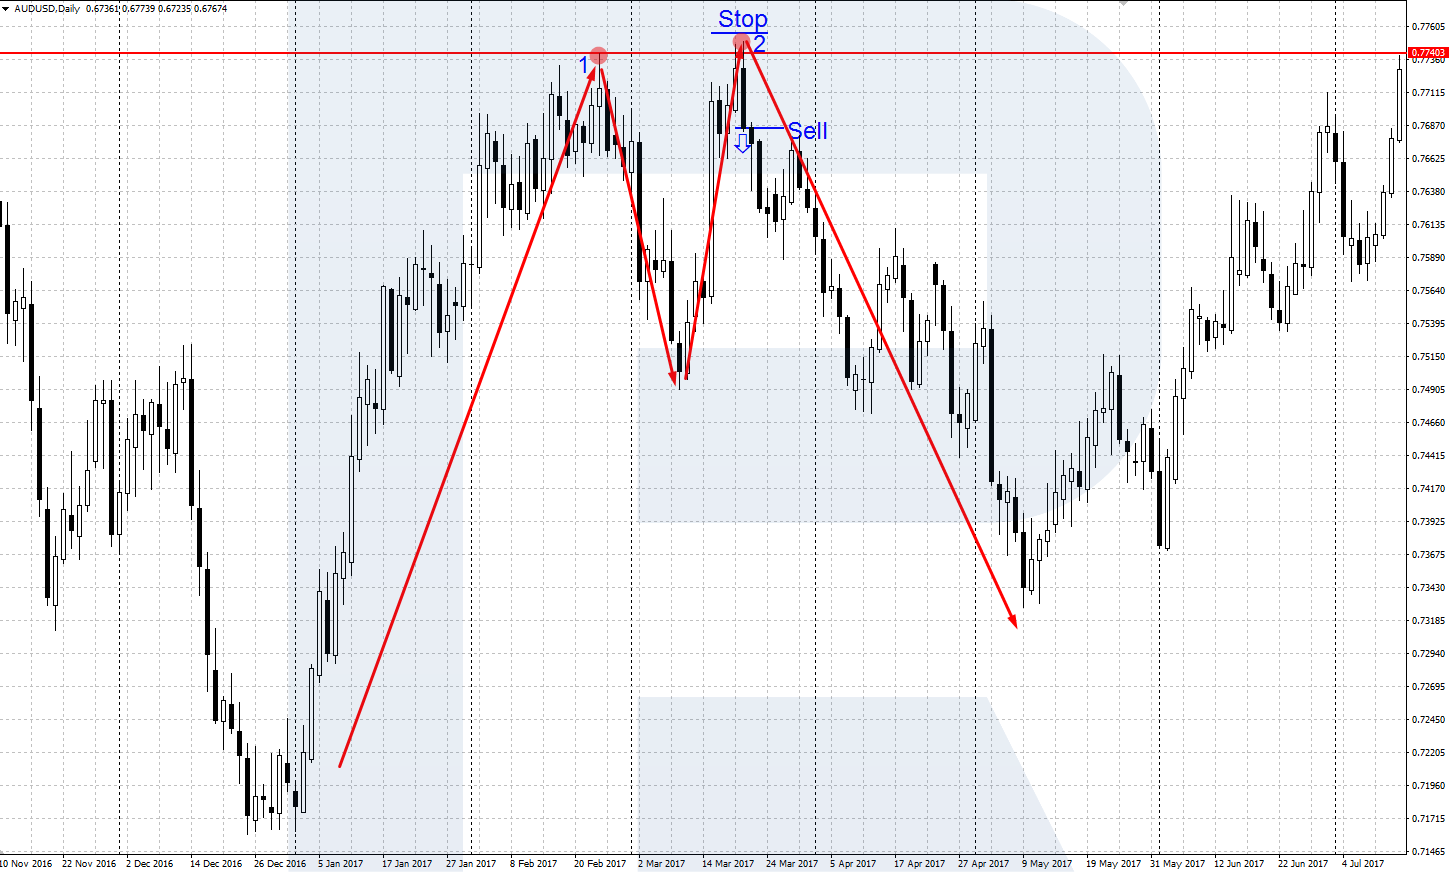
In an uptrend, two close-by tops are formed on the price chart. The price of the last high is a bit higher than the first top but it cannot remain at this level for long and starts going down, i.e. forms a false breakout of the first high.
After the price closes below the level of the first high again, we open a selling position with an SL behind the high of the second top. As for the TP, in mid-term trading, Sperandeo recommends making it 5 times larger than the SL. Thanks to such a ratio, one profitable trade covers up for 2-3 losing ones easily.
The 2B Pattern in a Downtrend
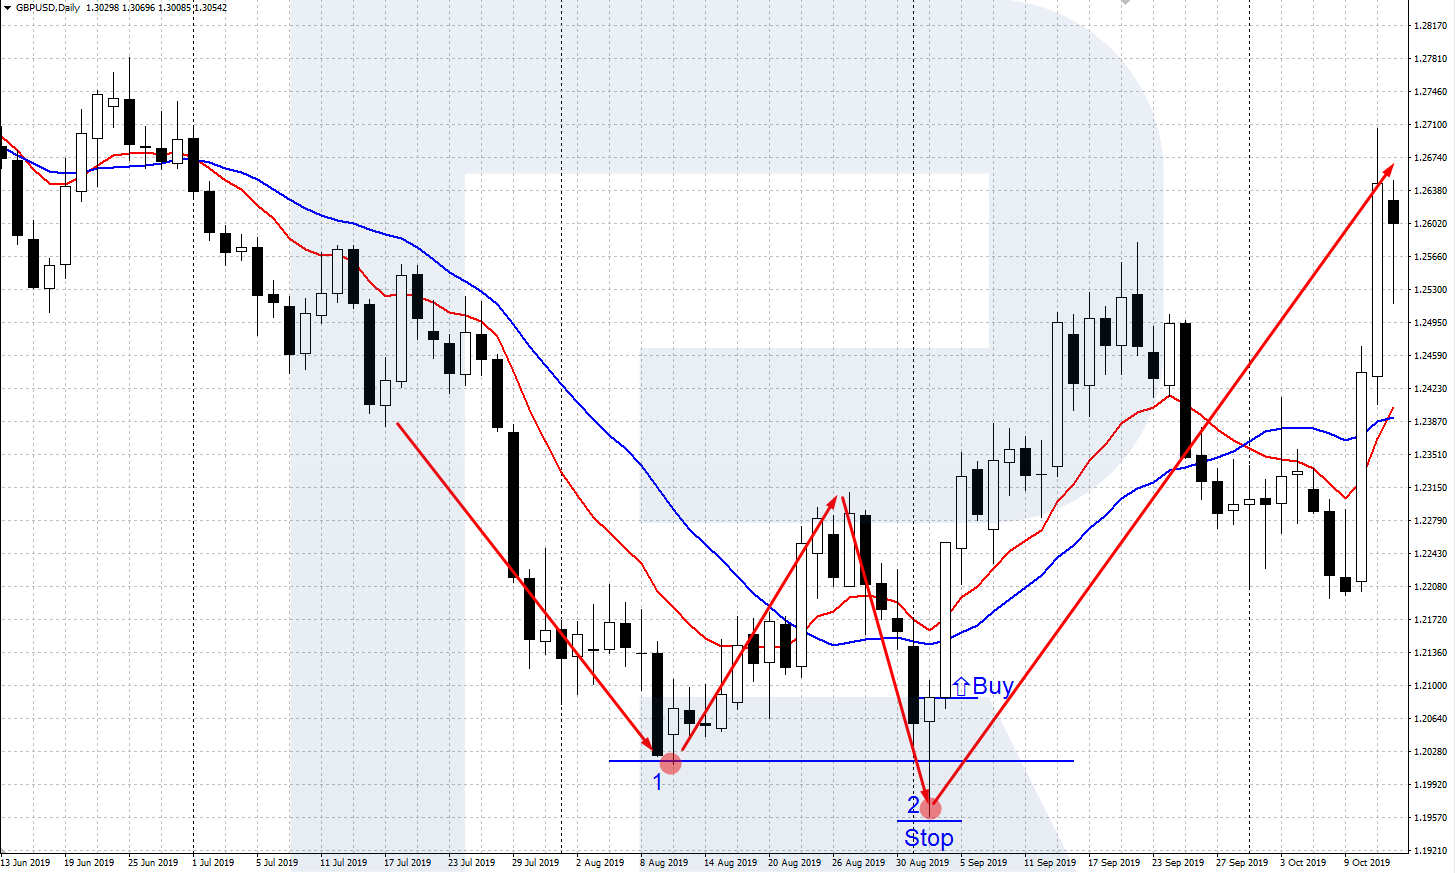
- On the price chart, two subsequent bottoms form in a downtrend.
- The price on the second bottom goes lower than the price of the low of the first one but cannot remain there for long and starts going up.
- After the renewal of the first low, a subsequent return and closing of the price above it, we open a buying position. The SL is below the last bottom, the TP is 5 times larger than the SL.
Trade on the Go With RoboForex MobileTrader
A portable trading workstation on your phone, on Android and iOS.
How to Draw a Trend Line?
According to the definition from tech analysis, a trend is a period when the price is moving mostly in one direction, either growing or declining. In other words, a trend is a price movement in one direction. A trend can be explained by economic, political factors or force majeure events.
Sperandeo singles out three types of a trend in terms of its length; they can be active simultaneously and move in opposite directions:
- Short-term trend lasts from several days to several weeks, 14 work days on average
- Mid-term trend lasts from several weeks to several months
- Long-term trend lasts from several months to several years.
Any of these trends can be traded; traders usually aim at short- and mid-term trends while investors aim at mid- and long-term ones. To trade reversal patterns, we need the market to move in an up- or downtrend.
- An uptrend is a price move in which each next high is higher than the previous one and each next low is also higher than the previous one.
- A downtrend is characterized by each next high and low being lower than the previous one.
An important aspect of trend analysis is drawing the trendline. When the price breaks out the trendline, it signals the beginning of a correction or a trend reversal. For drawing the trendline, the following rules are used:
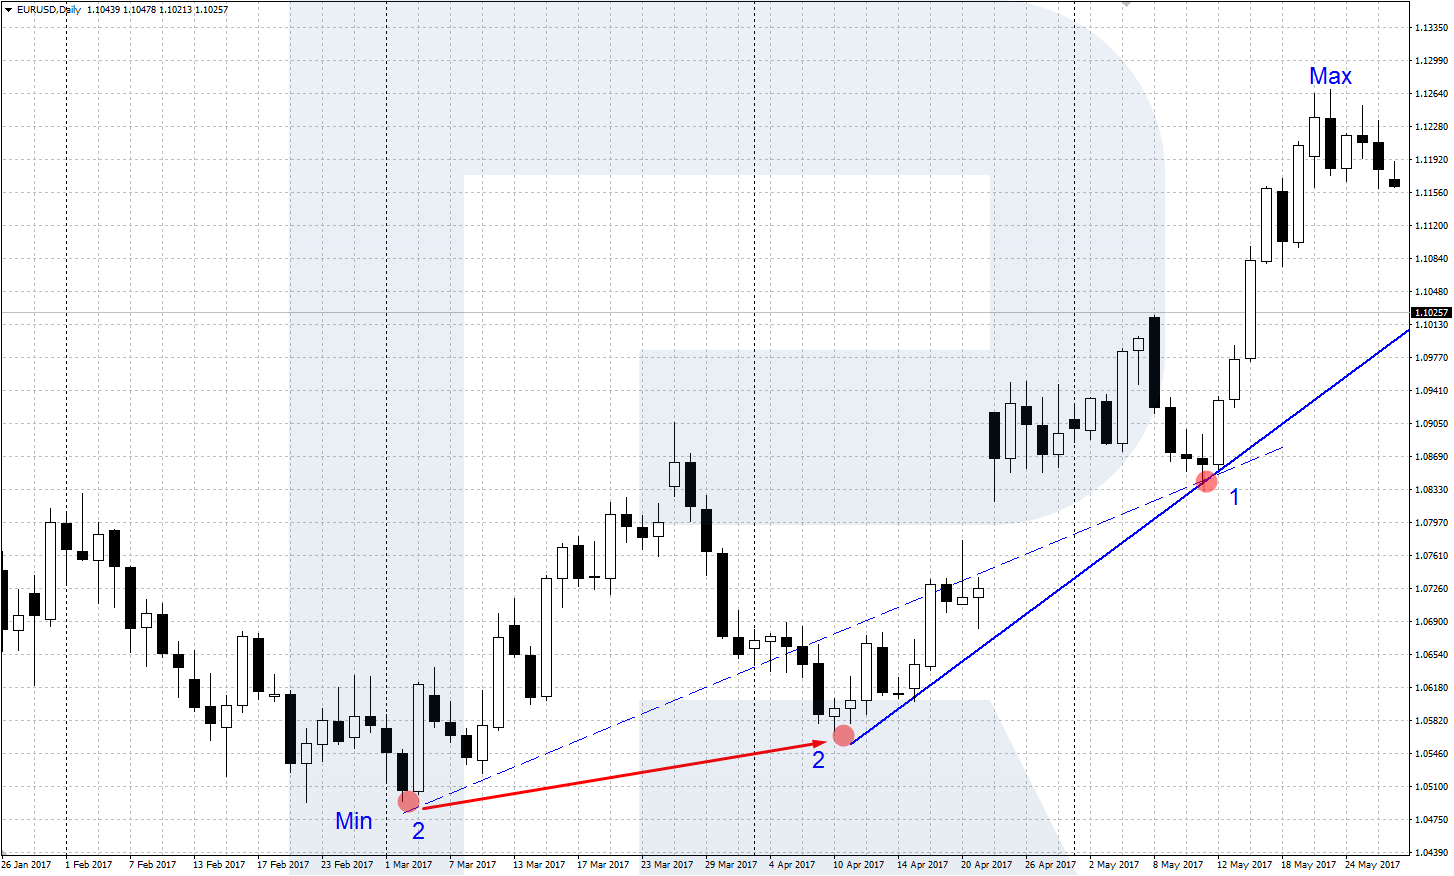
- The trendline in an uptrend is drawn on the chart through 2 points: the first point is the low preceding the absolute high of the trend; the second point is the first low the uptrend has started from. If the trendline crosses the chart, the second point (the farthest low) is transferred to the next closer low for the trendline not to cross the price chart.
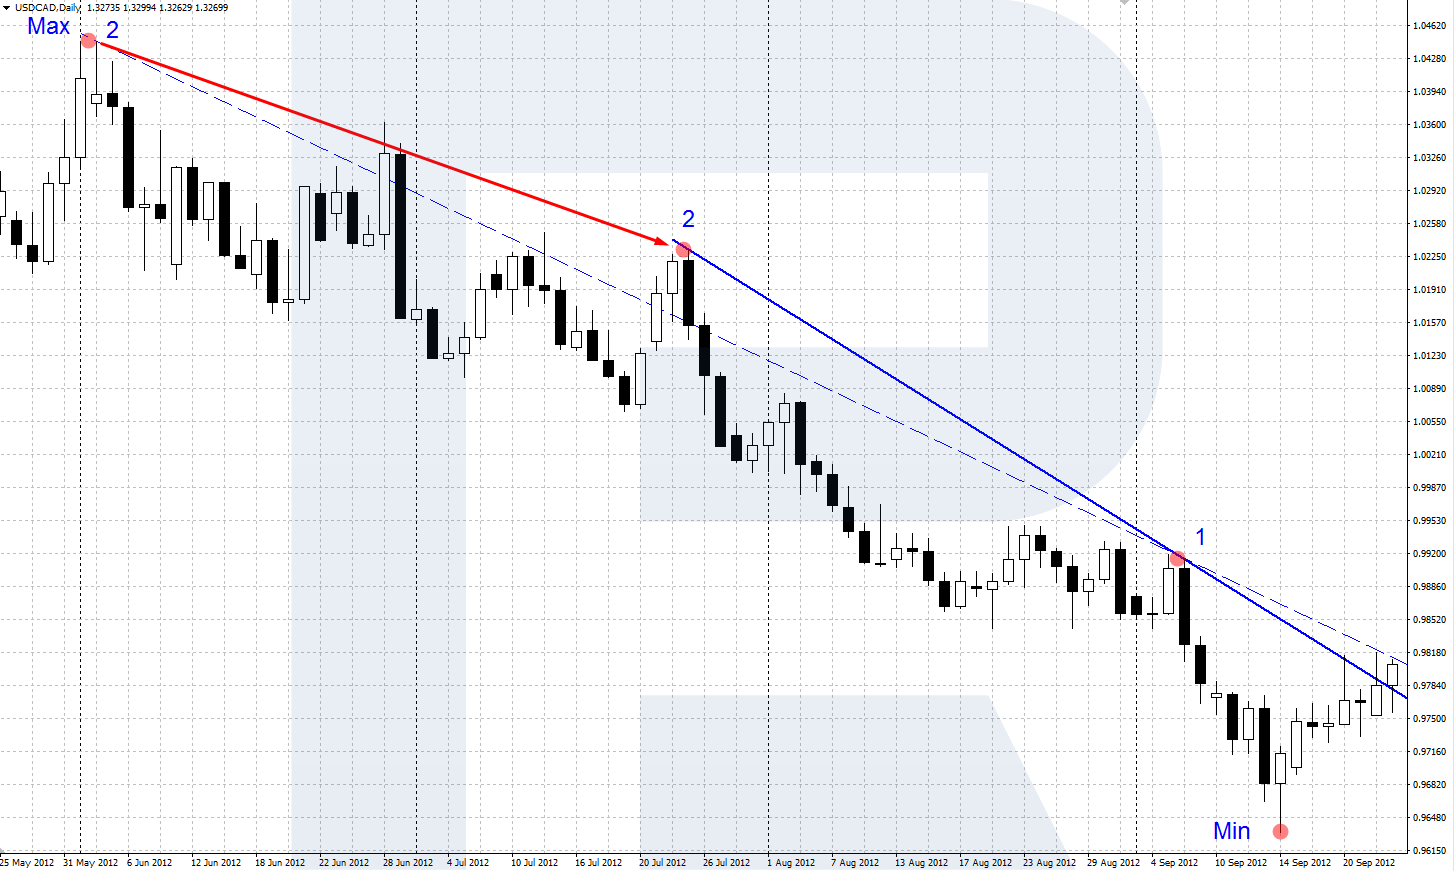
- The trendline in a downtrend is drawn on the chart through 2 points: the first point is the high preceding the absolute low of the trend; the second point is the first high the downtrend has started from. If the trendline crosses the chart, the second point (the farthest high) is transferred to the next closer high for the trendline not to cross the price chart.
Trend Reversal 1-2-3
The rule of Sperandeo trend reversal 1-2-3 comes into force when the price chart breaks out the trendline. This is the first signal of a possible trend reversal, which may precede a 1-2-3 reversal. Below, we will discuss in detail the rules of formation of this reversal and trading it in an up- and downtrend.
This pattern turns Dow's definition of a trend into three checks. A trend lasts while each new swing renews the extreme; it ends when three things happen in turn. First, the trendline breaks. Second, the price tries to return to the extreme and fails, or renews it only briefly. Third, it breaks the swing that formed after the trendline break. Only the third step confirms the new trend, so the conservative entry comes late, but with the old trend clearly over. The stop loss behind point 3 is logical: a move past it would mean the old trend has resumed. The ZigZag indicator helps mark points 1, 2 and 3 on the chart.
A 1-2-3 Reversal in an Uptrend
- Find an actual uptrend on the price chart and draw a trendline.
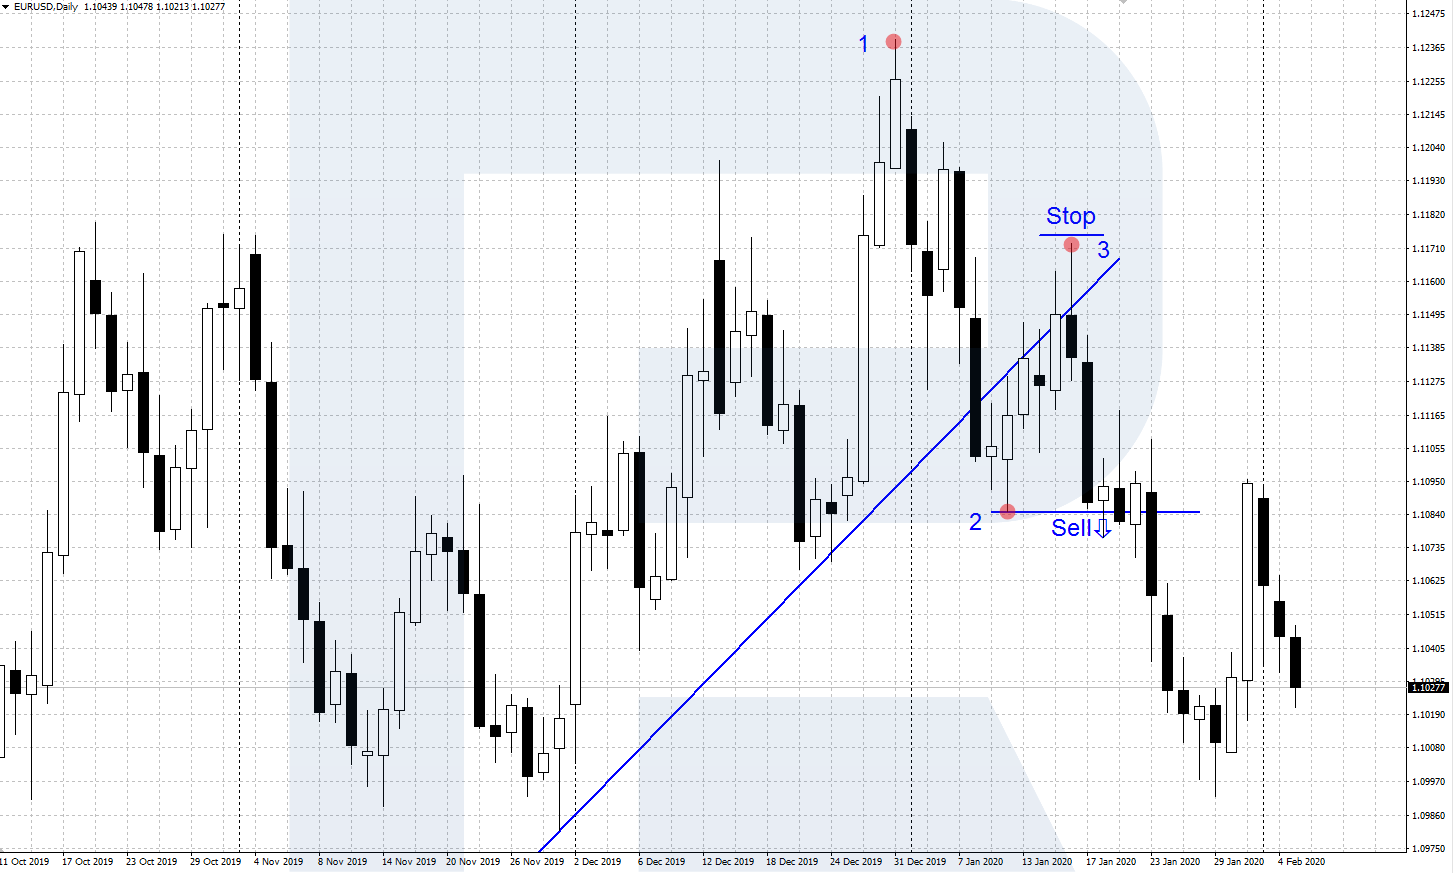
- After the trendline is broken out, name the high preceding the breakout as point 1 and the low formed after the breakout point 2.
- After point 2 is formed, a new ascending impulse in the direction of the trend forms. A short-term exceeding of point 1 is possible (it is called a false breakout), but it must be followed by a strong pullback down. The new high is named point 3.
- The 1-2-3 reversal comes into force if the price goes further down renewing the low in the point 2. Open a selling position, putting an SL above point 3.
A 1-2-3 Reversal in a Downtrend
- Find an actual downtrend on the price chart and draw a trendline.
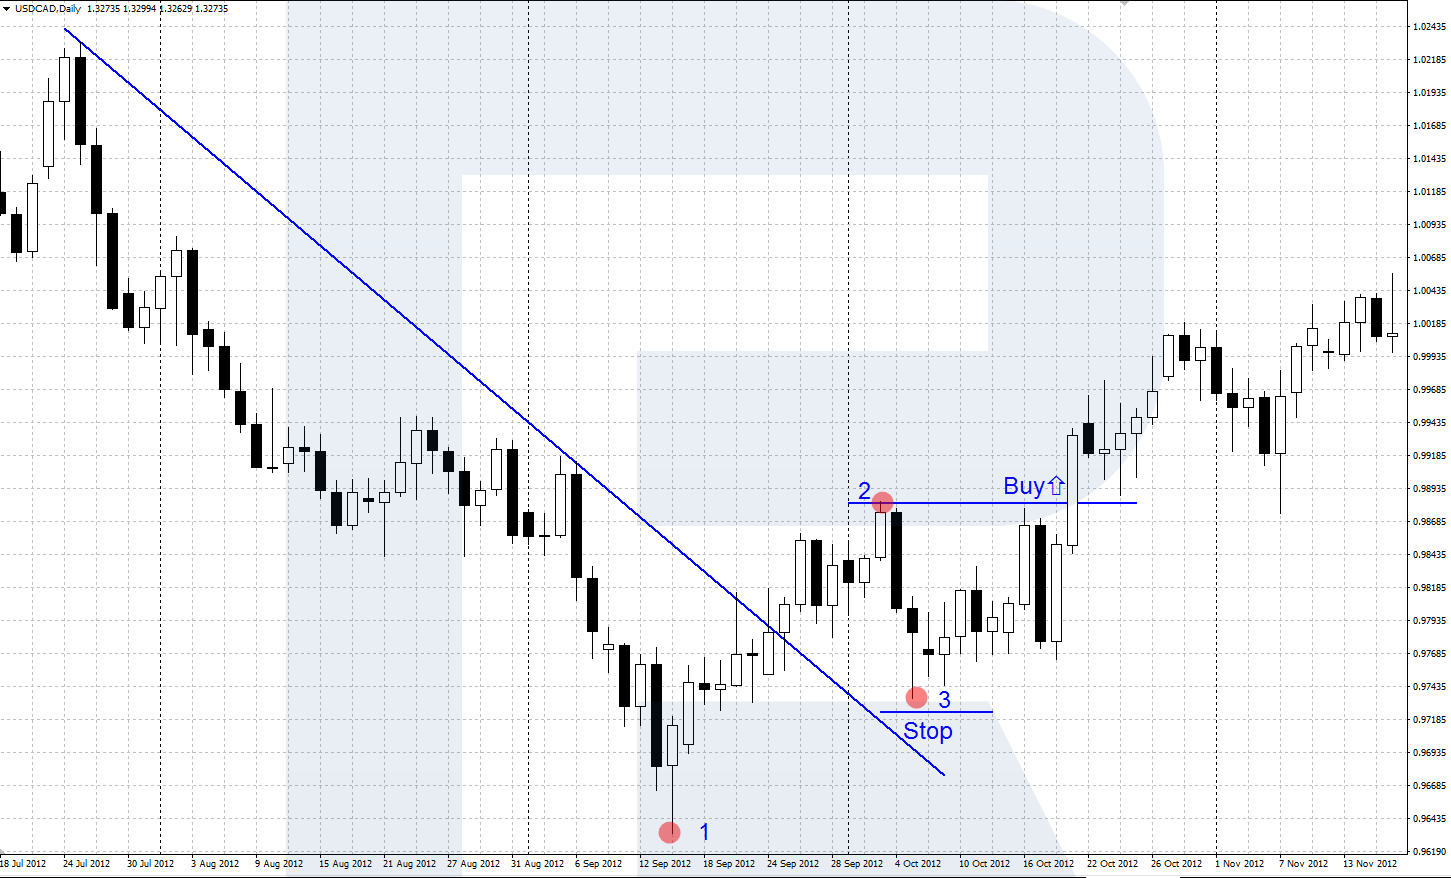
- After the trendline is crossed by the chart upwards, name the low preceding the crossing as point 1 and the high formed after the breakout point 2.
- Then, a new impulse downwards follows from point 2, remaining higher than point 1. A short-term renewal of the low in point 1 is possible (called a “trial” of the low) but it must be followed by a strong pullback upwards. The new low is point 3.
- The 1-2-3 reversal is considered fully formed only after the price goes further upwards, exceeding the high in the point 2. Open a buying position with an SL below point 3.
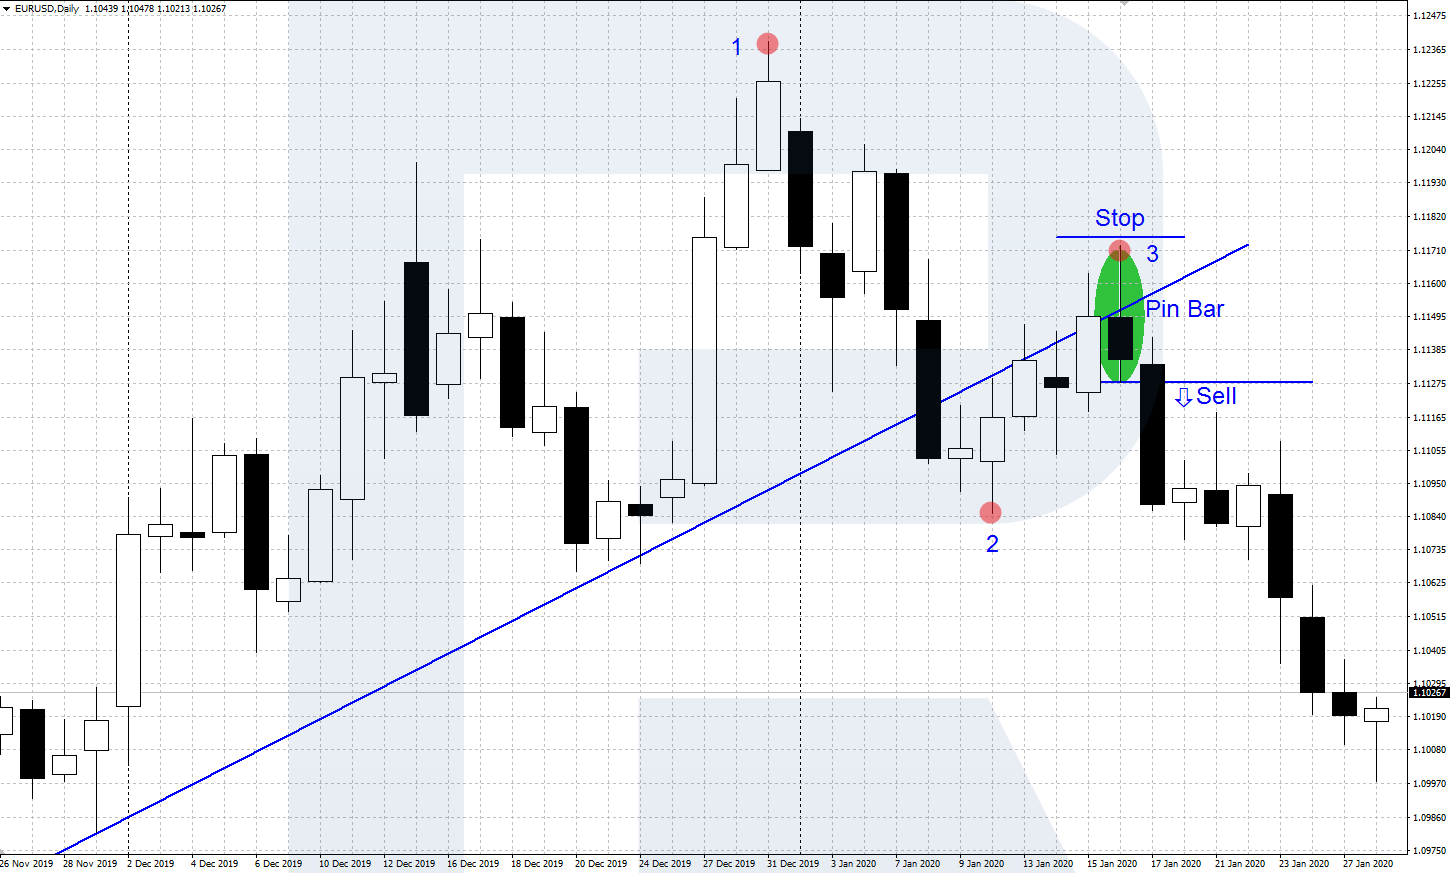
We have described an original conservative way of trading a 1-2-3 reversal by Victor Sperandeo. Sometimes, I use a more aggressive way of trading: I trade right after point 3 is formed. The signal might be a false breakaway or some Price Action reversal pattern. This is less trustworthy because the reversal has not been confirmed yet (point 2 has not been broken out) but this method allows to enter the market with a smaller SL and a more profitable profit to loss ratio.
The table compares the two patterns as described above.
| Pattern | Type | Where it forms | Entry | Stop loss | Target |
|---|---|---|---|---|---|
| 1-2-3 reversal | Trend reversal, confirmed | After a break of the Sperandeo trendline | On the break of point 2; aggressive entry at point 3 | Behind point 3 | No fixed ratio; hold while the new trend lasts |
| 2B pattern | Reversal on a false breakout | At a new high in an uptrend or a new low in a downtrend | When the price closes back beyond the first high or low | Behind the second top or bottom | Up to 5 times the stop loss in mid-term trading |
Both entries can be placed in advance with pending orders: a Sell Stop just below point 2 for a 1-2-3 top, or a Buy Stop just above it for a 1-2-3 bottom.
Start Trading Now
Forex, stocks, indices and gold on MetaTrader 4 and MetaTrader 5, from a free demo account to a live one.
Closing Thoughts
Due to Sperandeo’s long-time experience of trading on exchange markets, his methods have become popular among traders. The ways of trading described in his books still work well, bringing profit to those who have mastered all the details of his approach and their application on practice.
In this article, we have discussed how to trade the 2B pattern, how to draw a trendline by Sperandeo and how to trade a 1-2-3 reversal. For a fuller and more detailed understanding of the author’s strategy and approach, I recommend two of his books: “TRADER VIC: Methods of a Wall Street Master” and “TRADER VIC II: Principles of Professional Speculation”.
FAQ
What is the 2B pattern in trading?
A reversal pattern by Victor Sperandeo. The price breaks a previous high or low, fails to hold beyond it and closes back. The failed breakout signals a likely reversal, and the trade opens against the breakout with the stop behind the new extreme.
What is the 1-2-3 reversal?
Sperandeo's three-step confirmation of a trend change: the trendline breaks, the price fails to renew the extreme, and then it breaks the swing that formed after the trendline break. The entry comes on that last break, with the stop behind point 3.
What is the difference between the 2B pattern and the 1-2-3 reversal?
The 2B trades the failed breakout itself, close to the extreme, with a short stop. The 1-2-3 waits until the new trend is confirmed by the break of point 2, so it enters later, with more confirmation.
Where should the stop loss go in a 2B pattern?
Behind the second top in an uptrend or the second bottom in a downtrend, the extreme of the false breakout. Sperandeo recommends a take profit up to 5 times larger than the stop in mid-term trading.
How is the 2B pattern related to the Turtle Soup?
Both trade a false breakout of a previous high or low. The Turtle Soup by Linda Raschke uses the 20-day range and fixed rules for the entry, while Sperandeo's 2B applies to any adjacent tops or bottoms and enters on the close back beyond the first one.
Any information provided in articles on this website is based solely on the personal opinions of the authors. These articles should not be construed as trading recommendations or a call to action. The authors and RoboForex accept no responsibility for the results of any trades made on the basis of these recommendations and reviews. Past performance is not indicative of future results. Trading stocks and CFDs involves a high risk of capital loss.