Index Trading Explained: What a Stock Market Index Is and How to Trade It
Index trading lets you trade the direction of a whole stock market with one position. A single US 500 trade follows about 500 large US companies at once, so one company's weak report moves it far less than it moves a single stock. This guide explains what a stock market index is, which indices traders watch most, what moves their prices and how to open your first index trade step by step.
TL;DR
Trade on the Go With RoboForex MobileTrader
A portable trading workstation on your phone, on Android and iOS.
Many beginner traders on Forex think that it is only possible to trade currency pairs. There are many more trading instruments than it seems at first glance. In trading terminals, all the time appear new instruments, which might be underestimated by new market players.
Currently, a trader can always select an instrument that perfectly suits their tastes and preferences: those might be currency pairs, CFDs, futures, or indices. Today, we are going to speak about indices and how to use them in trading.
What Is a Stock Market Index?
A stock market index is an index of the average price of a certain set of instruments, such as stocks of different companies, united in one group. Indices are calculated by various rating agencies and organizations by various formulae, such as a simple average price, weighted average price, etc. However, there is no need to learn the formulae as you will not have to calculate the indices yourself.
Popular Indices
Each exchange features its own set of indices for trading, the most popular ones being:
- The Dow Jones index. This index unites the stocks of 30 biggest companies. By the way, this one is among the first indices that have been calculated and used in trading.
- The next popular one is the S&P 500 (Standard&Poor's) index. As might be guessed from the name, there are 500 companies in this index. It suits beginner traders perfectly because it has excellent liquidity and volatility. What is more, the S&P 500 reacts to the movements of individual companies rather calmly as there are so many stocks used in the formula.
- The NASDAQ 100 index unites the stocks of 100 largest companies traded on the exchange with the same name.
On European exchanges, the most popular indices would be:
- The DAX index. It features the 40 largest companies in Germany.
- CAC 40 is a French index, uniting 40 of the biggest French companies.
- FTSE 100 is a British index, calculated for 100 companies with the biggest capitalization.
Asian market:
- Nikkei 225 is an index of the Tokyo stock exchange, calculated for 225 companies.
- Shanghai Composite is an index of the Shanghai exchange.
The table puts the same eight indices side by side, with the symbol to look for in MetaTrader where RoboForex offers the index as a CFD.
| Index | Market | What it includes | Companies | Exchange hours, local time | At RoboForex, MT4/MT5 |
|---|---|---|---|---|---|
| Dow Jones Industrial Average | US | Large US companies from most sectors, weighted by share price | 30 | 9:30 to 16:00, New York | US 30 (.US30Cash) |
| S&P 500 | US | Large US companies from all sectors, weighted by market value | About 500 | 9:30 to 16:00, New York | US 500 (.US500Cash) |
| Nasdaq 100 | US | Largest non-financial companies listed on Nasdaq, led by technology | 100 | 9:30 to 16:00, New York | US TECH (.USTECHCash) |
| DAX | Germany | Largest German companies on the Frankfurt exchange | 40 | 9:00 to 17:30, Frankfurt | DE 40 (.DE40Cash) |
| CAC 40 | France | Largest French companies on Euronext Paris | 40 | 9:00 to 17:30, Paris | Not on MT4/MT5 |
| FTSE 100 | UK | Largest UK companies by market value on the London Stock Exchange | 100 | 8:00 to 16:30, London | Not on MT4/MT5 |
| Nikkei 225 | Japan | Leading companies on the Tokyo Stock Exchange, weighted by share price | 225 | 9:00 to 15:30, Tokyo, break 11:30 to 12:30 | JP 225 (.JP225Cash) |
| Shanghai Composite | China | All stocks listed on the Shanghai Stock Exchange | All listed | 9:30 to 15:00, Shanghai, break 11:30 to 13:00 | Not on MT4/MT5 |
Index CFDs trade for longer than the exchange itself: the RoboForex session for each symbol is in the specifications table further down.
What Moves Index Prices
An index is the combined price of its companies, so anything that changes what investors will pay for those companies moves the index. Four drivers account for most of the movement you will see on the chart.
1
Results of the largest companies
In an index weighted by market value, the biggest companies carry the most weight. A quarterly report from a handful of US technology giants can move US TECH and US 500 for the whole session.
2
Interest rate decisions
Lower rates make borrowing cheaper for companies and make stocks more attractive than deposits, which usually supports indices. Rate rises tend to weigh on them.
3
Economic data
Inflation, jobs and growth figures shape what traders expect from the central bank. Release dates are in the economic calendar, and index prices often jump in the minute after a release.
4
Market mood
Political news, trade disputes and sharp moves in other markets can push all indices up or down together. News that arrives while the exchange is closed shows up as a gap at the next open.
Trading Indices
The chart of an index does not differ from the chart of any other trading instrument, though many traders keep searching for some peculiarities. In reality, indices are no more difficult to trade than, say, CFDs or currency pairs. Indices can be analyzed by virtually any indicator, technical or candlestick analysis. Fundamental data is also worth paying attention to, but in the case of trading indices, you will have to track different sources and analyze lots of information.
There is nothing supernatural to it, fundamental analysis simply requires a somewhat specific approach to the data. The growth of indices means that the stocks of the companies it contains also grow and strengthen, while if the index declines, the companies are not doing very well.
Using Tech (Graphic) Fibo Analysis
Indices, as well as other instruments, sometimes form certain patterns of graphic analysis on the charts, and such patterns may be used for entering the market. Only, you have to pay attention to the working hours of the exchange which your index is traded on. Keeping in mind that the exchange does not work 24/7, gaps are likely to form on the chart, and they can sort of correct the formation process of the patterns.
In the case of intraday trading, such gaps play no critical role; the best timeframes would be from M5 to M30. This will let you carry out your analysis on a large number of candlesticks almost without gaps. The easiest patterns to define are the Flag, Pennant, Head and Shoulders, and their inverted versions. Stock indices sometimes react very abruptly on the news, that is why beginners should abstain from trading during the first 30 minutes of work of the exchange.
Trading Support and Resistance Levels
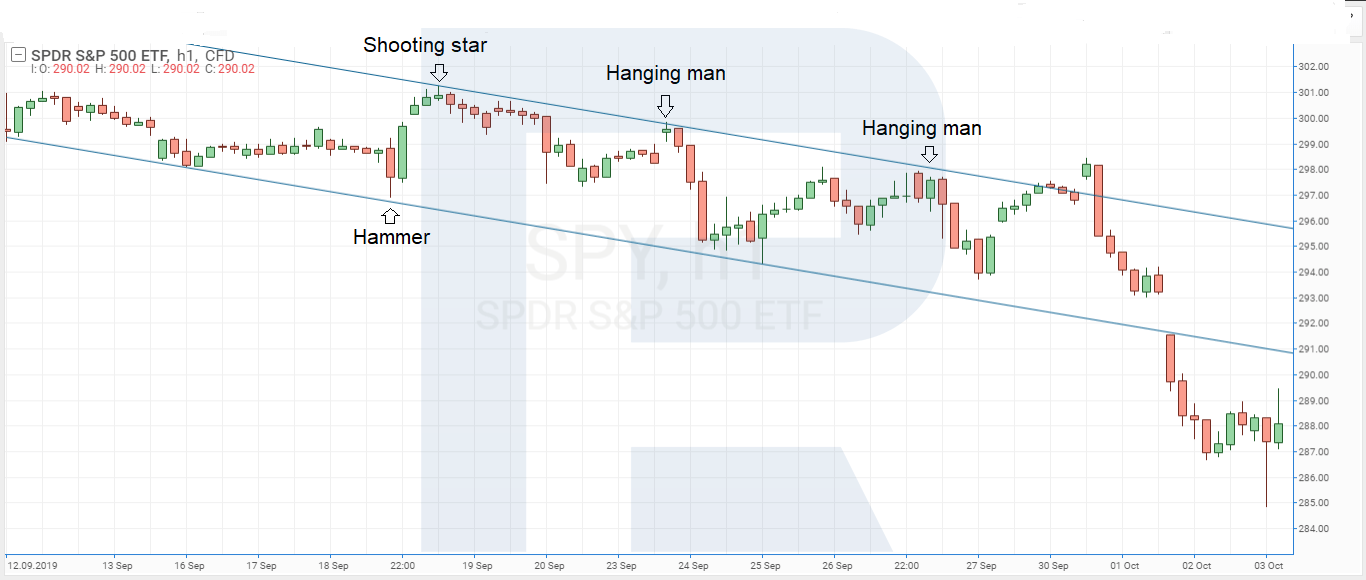
The next popular option of trading indices is following bounces off the key support and resistance levels. There are several variants of trading support and resistance levels, but we shall discuss a complex approach using reversal candlestick patterns, such as the Hammer, Hanging Man, Inverted Hammer, Shooting Star, Doji, and Engulfing.
Bounces off the levels may be searched for on any timeframe, and the gaps emerging at the opening of the session will not have any critical influence. However, the risks of mid-term trading should be kept in mind. A Stop Loss that gets into a gap will be closed at the worst possible price.
Example: How to Trade an S&P 500 ETF at Resistance
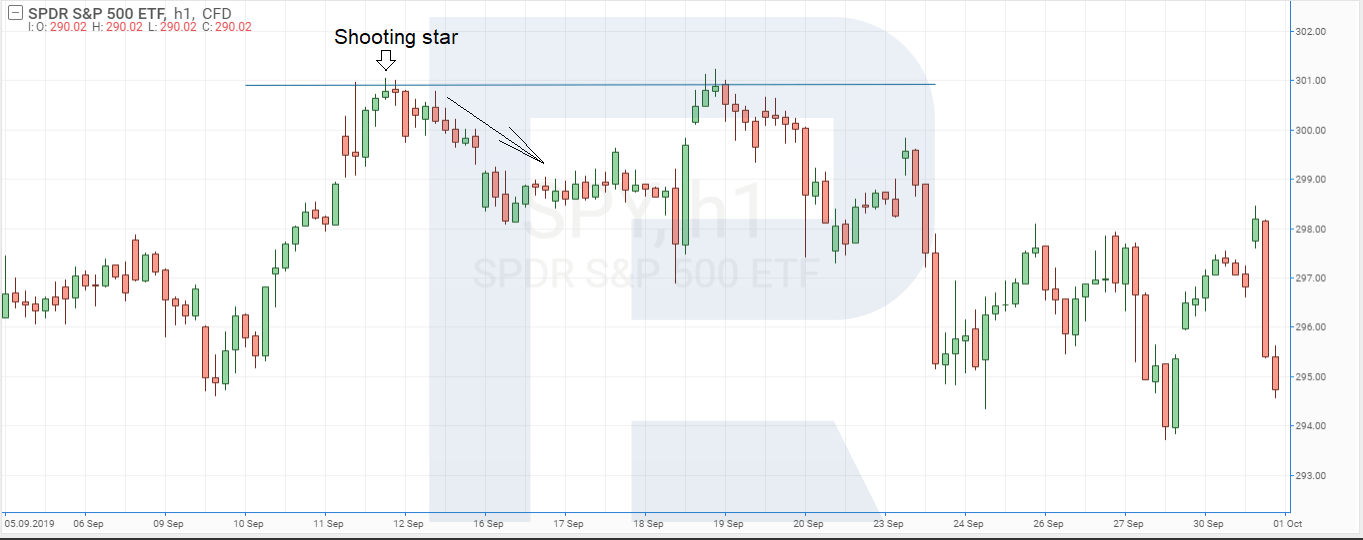
On H1, we can see the SPDR S&P 500 ETF (ticker SPY), a fund that follows the S&P 500 index. Let us draw the support and resistance lines. The bigger has been the price near a certain value historically, the stronger this level is considered and the higher the probability of a bounce (a breakaway is not excluded either). The price neared the key resistance level and formed a reversal pattern Shooting Star for the first time; then the signal was executed and the index went down, letting the trader earn several points.
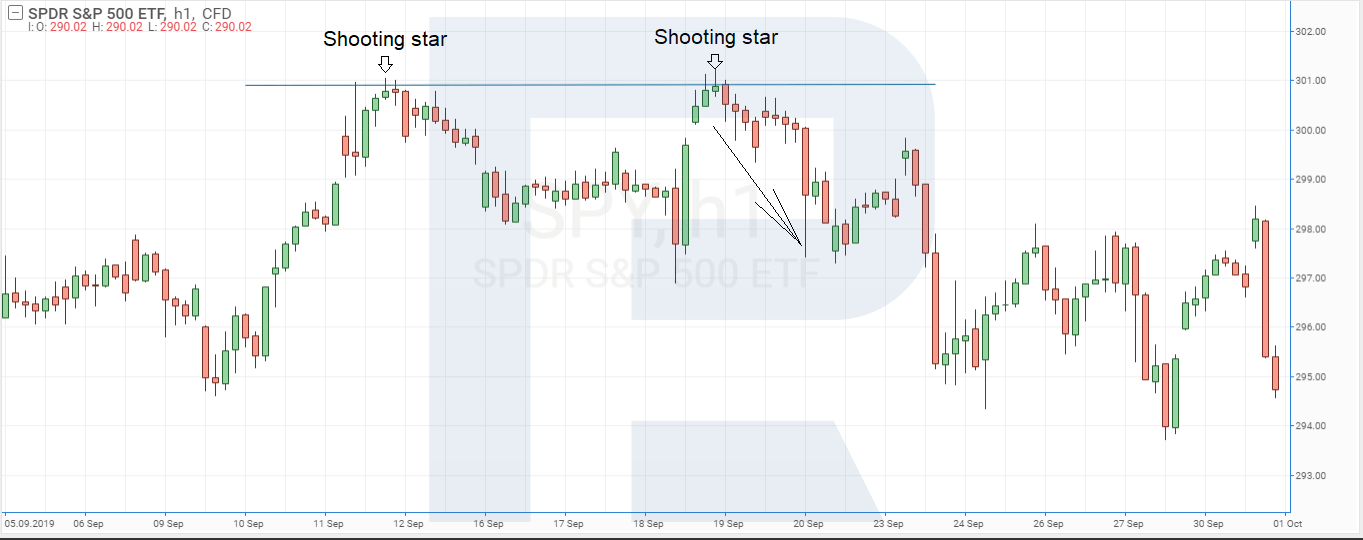
Sometime later the price approached this level again and upon testing it formed a Shooting Star again. The trader managed to execute a selling trade again according to the rules of trading candlestick patterns (the Stop Loss was put behind the maximum of the signal candlestick). In this case, the risk to potential profit ratio was about 1:4.
This trading strategy can be somewhat modified: we can use channels, if they are present on the chart, instead of the horizontal support and resistance lines. In such a case, buying should be executed from the lower border, and selling from the upper border of the channel. Keeping in mind the fact that indices normally move in one direction for a long time, trading the trend is recommended. Positions counter the trend will make less profit and are riskier.
The same method works on the US 500 index CFD: the setup, the levels and the stop rules are identical, only the symbol changes.
Index CFD Specifications at RoboForex
At RoboForex you trade indices as CFDs, contracts for difference. You open a position on the index price, and your result is the difference between the price where you enter and the price where you close. You own no shares, so you can open a buy position if you expect the index to rise or a sell position if you expect it to fall.
| Index | Symbol | 1 lot | Minimum lot | Average spread, points | Leverage | Session, server time | Currency |
|---|---|---|---|---|---|---|---|
| US 500 | .US500Cash | 1 contract | 0.01 | 0.2 | 1:100 | 03:00 to 23:15 | USD |
| US 30 | .US30Cash | 1 contract | 0.01 | 0.8 | 1:100 | 03:00 to 23:15 | USD |
| US TECH | .USTECHCash | 1 contract | 0.01 | 0.3 | 1:100 | 03:00 to 23:15 | USD |
| DE 40 | .DE40Cash | 1 contract | 0.01 | 0.3 | 1:100 | 09:05 to 22:55 | EUR |
| JP 225 | .JP225Cash | 100 contracts | 0.01 | 5.5 | 1:100 | 01:00 to 23:55 | JPY |
Prime and ECN accounts, commission 4 USD per 1 million USD traded. Pro accounts carry the same symbols with a wider spread and no commission. Source: RoboForex contract specifications, September 2026. Conditions change, so check the current figures on the indices page before you trade.
What One Trade Costs: a Worked Example
Say the US 500 stands at 6,000 points. The level is a round number chosen for the arithmetic, so check the current price in MetaTrader before you trade. One lot is one contract, so a 1-point move on 1 lot changes your result by 1 USD. Here is what a 0.1 lot position means in money:
Position value
600 USD
0.1 lot × 6,000 points
Margin at 1:100
6 USD
600 USD / 100
Value of 1 point
0.10 USD
a 50-point move is 5 USD either way
A position held past the end of the trading day pays a small overnight charge, the swap, and on Friday the swap is charged for three days to cover the weekend.
Index CFDs From 0.01 Lot on MetaTrader 4 and 5
Five major indices with leverage 1:100 and a commission from 4 USD per 1 million USD traded on Prime and ECN accounts.
How to Trade Indices: Step by Step
These five steps take you from choosing an index to closing your first trade. Run them on a demo account first: the prices are real, the money is virtual.
Step 1. Choose One Index and Learn Its Hours
For a first trade, the US 500 is the usual choice: it has the lowest average spread in the table above, a long session and plenty of news in English. Note when the New York exchange opens, 9:30 local time, because the first 30 minutes after the open move the fastest.
Step 2. Open a Demo Account and Find the Symbol
Open a demo account in MetaTrader 5. In the Market Watch window, right-click, choose Symbols, search for .US500Cash and click Show Symbol. Drag it onto a chart and switch the timeframe to H1.
Step 3. Decide on the Direction
Use one method from the section on trading indices above: find the trend, draw the nearest support and resistance levels and wait for a reversal candlestick at one of them. Then open the economic calendar and check for inflation, jobs or central bank releases in the next 24 hours, because a release can override the chart pattern.
Step 4. Size the Position and Set the Stop Loss
Decide before you enter how much of the deposit this trade may cost. Many traders limit it to 1 to 2%. With a 500 USD deposit, 1% is 5 USD. If your stop loss sits 20 points from the entry, divide 5 USD by 20 points: you can afford 0.25 USD per point, which on the US 500 is 0.25 lot. At an index level of 6,000 that position needs 15 USD of margin. The calculator below does the same sum with your own numbers.
US 500 position size calculator
Money at risk
5.00 USD
Position size
0.25 lot
Margin at 1:100
15.00 USD
1 lot of US 500 = 1 USD per point. The lot is rounded down to the 0.01 step.
Step 5. Open, Manage and Close the Trade
Place the order with the stop loss and a take profit at least twice as far away as the stop, then leave it to run. Decide in advance whether you close before the session ends or hold overnight and pay the swap. Write down each trade: after 20 demo trades you will see whether the method works for you, and that is the point to move to a live account.
Index Trading vs Stock Trading
Index trading suits traders who follow the economy as a whole: central banks, inflation and the market mood. Stock trading suits traders who study individual companies and want to act on one earnings report. Many traders use both, an index for the market view and a few stocks for their strongest ideas.
| Parameter | Index CFD, e.g. US 500 | Single US stock on StocksTrader |
|---|---|---|
| What you trade | The whole market or sector in one position | One company |
| Effect of one company's news | Small, one company is a fraction of the index | Large, one report can move the price sharply |
| Selling on a fall | Sell as easily as buy | With a stock CFD; real shares are bought only |
| Leverage at RoboForex | 1:100 | Up to 1:20 for stock CFDs, 1:2 for real shares |
| Trading hours | 03:00 to 23:15 server time on weekdays | 13:30 to 20:00 UTC, the US exchange session |
| Main costs | Spread, commission on Prime and ECN, overnight swap | Spread from 0.02 USD, financing fee on leveraged positions |
| Minimum to start | 0.01 lot, account from 10 USD | 1 share, account from 100 USD |
Summary
In this article, we have discussed several popular indices and some trading options. It is rather hard to describe all trading strategies applicable to indices in one article. Indices have certain peculiarities, but analysis and comparison will be enough for a trader to make up their mind about a suitable instrument.
Thanks to indices, the assortment of trading instruments has extended significantly. What is more, thanks to the development of companies and the constant (though modest) growth of the stocks, most indices are moving in an uptrend. Trading the trend may be more profitable in the perspective than trading counter it.
The quickest way to put this into practice is the US 500 on a demo account in MetaTrader 5: pick one method from this guide, size each trade with the calculator above and run 20 trades before you move to a live account.
FAQ
Which index is best for beginners?
The US 500 is the most common first choice. It spreads risk across about 500 large US companies, it is heavily traded and at RoboForex it has the lowest average spread of the five index CFDs, 0.2 points on Prime accounts. If you trade during European hours, the DE 40 is the natural alternative.
Can you trade indices 24 hours a day?
Almost. The US index CFDs at RoboForex trade from 03:00 to 23:15 server time, Monday to Friday, which covers the Asian, European and US sessions. Prices move most and spreads are tightest while the index's own exchange is open. Index CFDs close at the weekend.
How much money do you need to start index trading?
A RoboForex account opens from 10 USD, and the minimum trade is 0.01 lot. At a US 500 level of 6,000 points and 1:100 leverage, 0.01 lot needs about 0.60 USD of margin. A practical deposit is one that keeps the risk on each trade at 1 to 2%, with a stop loss wide enough for the index's normal moves.
What is the difference between an index CFD and an index ETF?
An ETF is a fund that you buy on an exchange and own, usually without leverage, which suits long-term investing. An index CFD is a contract on the index price: you can buy or sell, use leverage and trade outside exchange hours, and you pay a swap for each night the position stays open, which suits shorter trades.
What does "Cash" mean in a ticker such as .US500Cash?
A Cash index CFD follows the current level of the index and has no expiry date, so you can hold it as long as you like, paying the swap each night. A futures-based CFD follows a futures contract instead and closes on a set expiry date.
Any information provided in articles on this website is based solely on the personal opinions of the authors. These articles should not be construed as trading recommendations or a call to action. The authors and RoboForex accept no responsibility for the results of any trades made on the basis of these recommendations and reviews. Past performance is not indicative of future results. Trading stocks and CFDs involves a high risk of capital loss.