Brent on the rise: declining oil inventories and US tariffs support growth
After another upward wave, Brent prices are forming a correction and trading near the 64.40 USD level. Find out more in our analysis for 22 January 2026.
Brent forecast: key takeaways
- Weekly US crude oil inventories according to the American Petroleum Institute (API): previously at 5.270 million, currently at 3.040 million barrels
- US crude oil stocks change: previously at 3.391 million, projected at -1.000 million
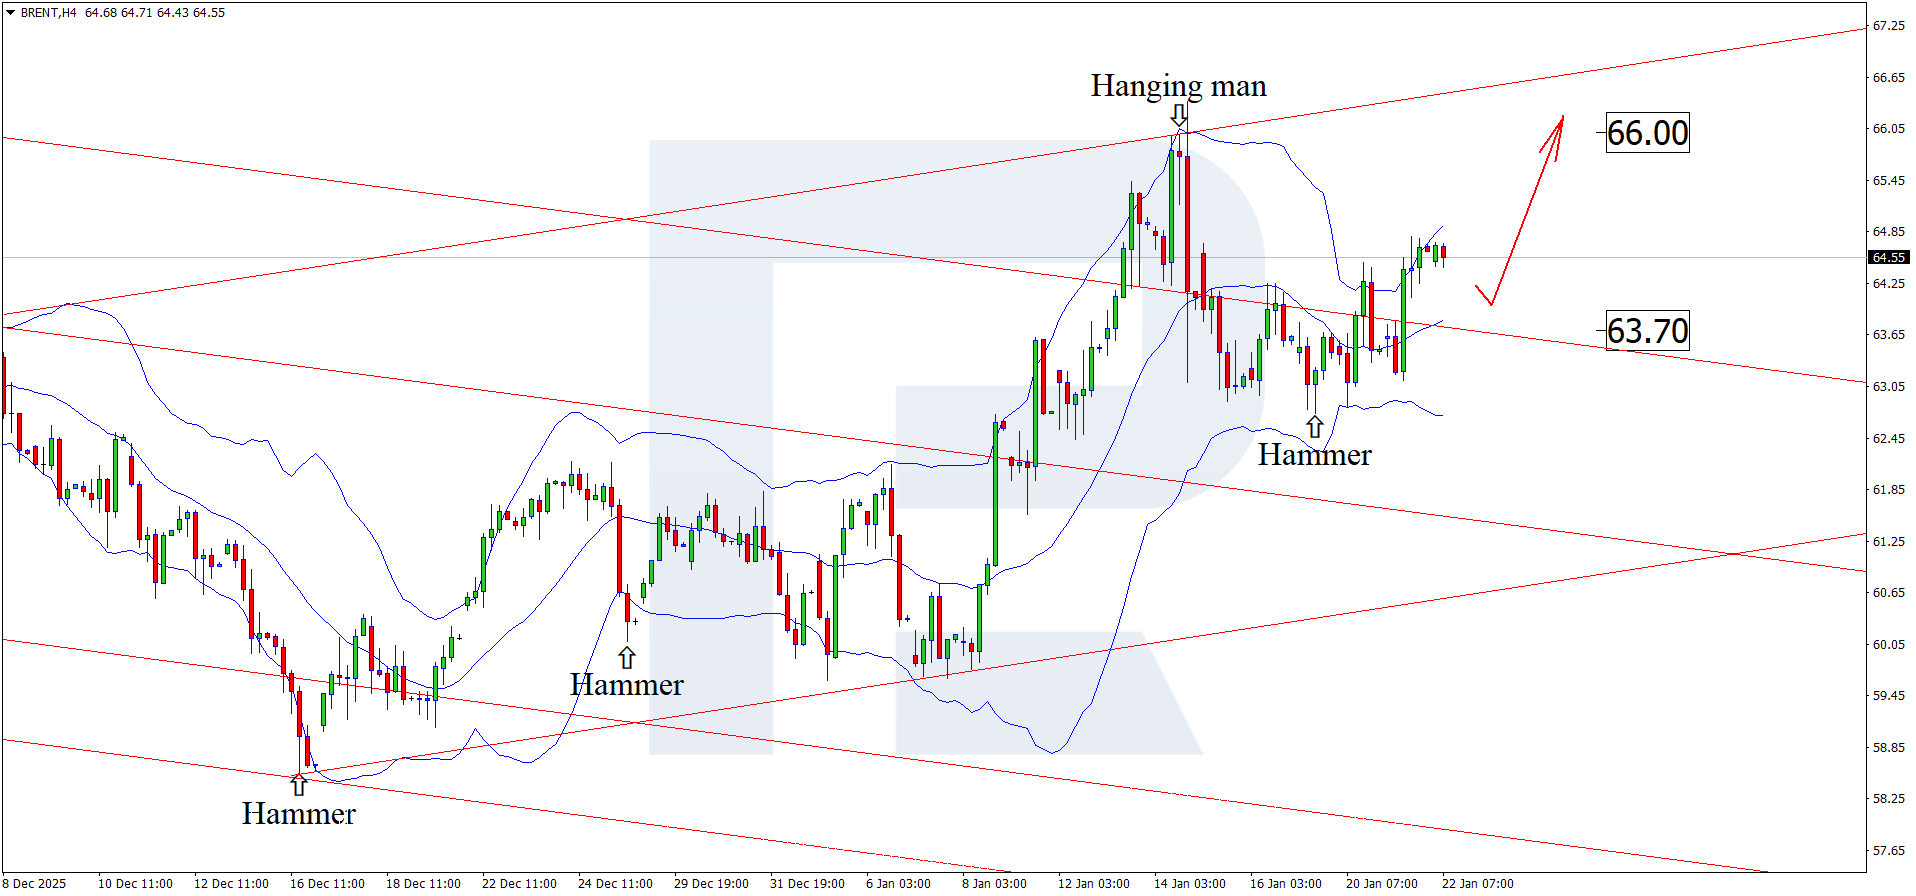
- Brent forecast for 22 January 2026: 66.00
Fundamental analysis
The Brent fundamental analysis for today, 22 January 2026, takes into account that Brent prices are forming an upward wave and trading near 64.40 USD per barrel.
According to the API, weekly US crude oil inventories declined to 3.040 million barrels in the latest reporting period, down from the previous value of 5.270 million. The reduction in inventories increased demand and supported oil prices, with quotes continuing to rise with corrections since 16 December 2025.
The Brent forecast for 22 January 2026 also considers that, according to the Energy Information Administration (EIA), US crude oil inventories may decline from 3.391 million to 1.000 million barrels. If the actual value is in line with the forecast or lower, this will provide additional support to Brent prices and may trigger further growth.
The US is preparing new trade tariffs in an attempt to support domestic producers and the economy, but in practice, the opposite is occurring: the USD is losing ground in the global market, while commodities continue to rise, delivering another blow to the US dollar.
Technical outlook
On the H4 chart, Brent prices tested the lower Bollinger Band and formed a Hammer reversal pattern. At this stage, quotes are following the signal in the form of an upward wave.
The Brent price forecast for 22 January 2026 suggests the 66.00 USD level as an upside target. A breakout above resistance would open the door for stronger upward momentum.
At the same time, an alternative scenario should not be ruled out, in which Brent quotes may form a correction, with the downside target at 63.70 USD.
Brent overview
- Asset: Brent
- Timeframe: H4 (Intraday)
- Trend: bullish
- Key resistance levels: 65.25 and 66.45
- Key support levels: 62.85 and 59.75
Brent trading scenarios for today
Main scenario (Buy Limit)
A rebound from the key support level at 63.70 USD will indicate the completion of the correction and a new bullish impulse. In this case, the potential for renewed growth within the upward structure remains.
The risk-to-reward ratio exceeds 1:3. Potential profit upon reaching the take-profit level is 230 pips, with possible losses limited to 60 pips.
- Buy Limit: 63.70 USD
- Take Profit: 66.00 USD
- Stop Loss: 63.10 USD
Alternative scenario (Sell Stop)
Opening short positions is considered if prices confidently break below the 62.90 USD support level. This scenario would indicate a continued downward movement with the aim of testing the next key support zone.
- Take Profit: 60.05 USD
- Stop Loss: 63.70 USD
Risk factors
Further easing of geopolitical tensions around Iran, combined with continued soft rhetoric from the US amid a breakout below the key 62.85 USD support level, may limit demand recovery and hinder the growth of Brent prices.
Summary
The decline in US oil inventories supports rising oil prices. Brent technical analysis suggests growth towards the 66.00 USD level after the correction is complete.
Editors’ picks
 EURUSD 2026-2027 forecast: key market trends and future predictions
This article provides the EURUSD forecast for 2026 and 2027 and highlights the main factors determining the direction of the pair’s movements. We will apply technical analysis, take into account the opinions of leading experts, large banks, and financial institutions, and study AI-based forecasts. This comprehensive insight into EURUSD predictions should help investors and traders make informed decisions.
 Gold (XAUUSD) forecast 2026 and beyond: expert insights, price predictions, and analysis
Dive deep into the Gold (XAUUSD) price outlook for 2026 and beyond, combining technical analysis, expert forecasts, and key macroeconomic factors. It explains the drivers behind gold’s recent surge, explores potential scenarios including a move toward 4,500 to 5,000 USD per ounce, and highlights why the metal remains a strong hedge during global uncertainty.
Forecasts presented in this section only reflect the author’s private opinion and should not be considered as guidance for trading. RoboForex bears no responsibility for trading results based on trading recommendations described in these analytical reviews.