Brent prices on the verge of records: decline in US oil inventories could trigger surge
Economic data and a decline in US oil inventories support Brent quotes, which have reached 70.00 USD per barrel. Find out more in our analysis for 19 February 2026.
Brent forecast: key takeaways
- US Energy Information Administration crude oil stocks: previously at 8.530 million, projected at 2.300 million barrels
- EIA Cushing crude oil stocks change: previously at 1.071 million, projected at 0.120 million barrels
- Brent forecast for 19 February 2026: 72.00
Fundamental analysis
Brent fundamental analysis for today, 19 February 2026, takes into account that, after recent gains, prices are forming a correction and trading around 70.00 USD per barrel.
The Brent forecast for 19 February 2026 also considers that, according to the EIA, US crude oil inventories may decline from 8.530 million to 2.300 million barrels. If the actual figure comes in below or in line with the forecast, this will provide additional support to Brent quotes and may trigger further growth.
Today’s Brent analysis also considers the release of EIA Cushing crude oil stocks change data. The forecast suggests a decline to 0.120 million barrels, compared to the previous 1.071 million.
A reduction in inventories may indicate higher consumption or lower supply. In either case, declining oil stockpiles generally support price growth. If the actual reading is equal to or worse than the forecast, this may provoke another upward wave in Brent quotes.
Combined with falling US oil inventories and persistent geopolitical risks, Brent prices may move towards 2025 highs in the near term.
Technical outlook
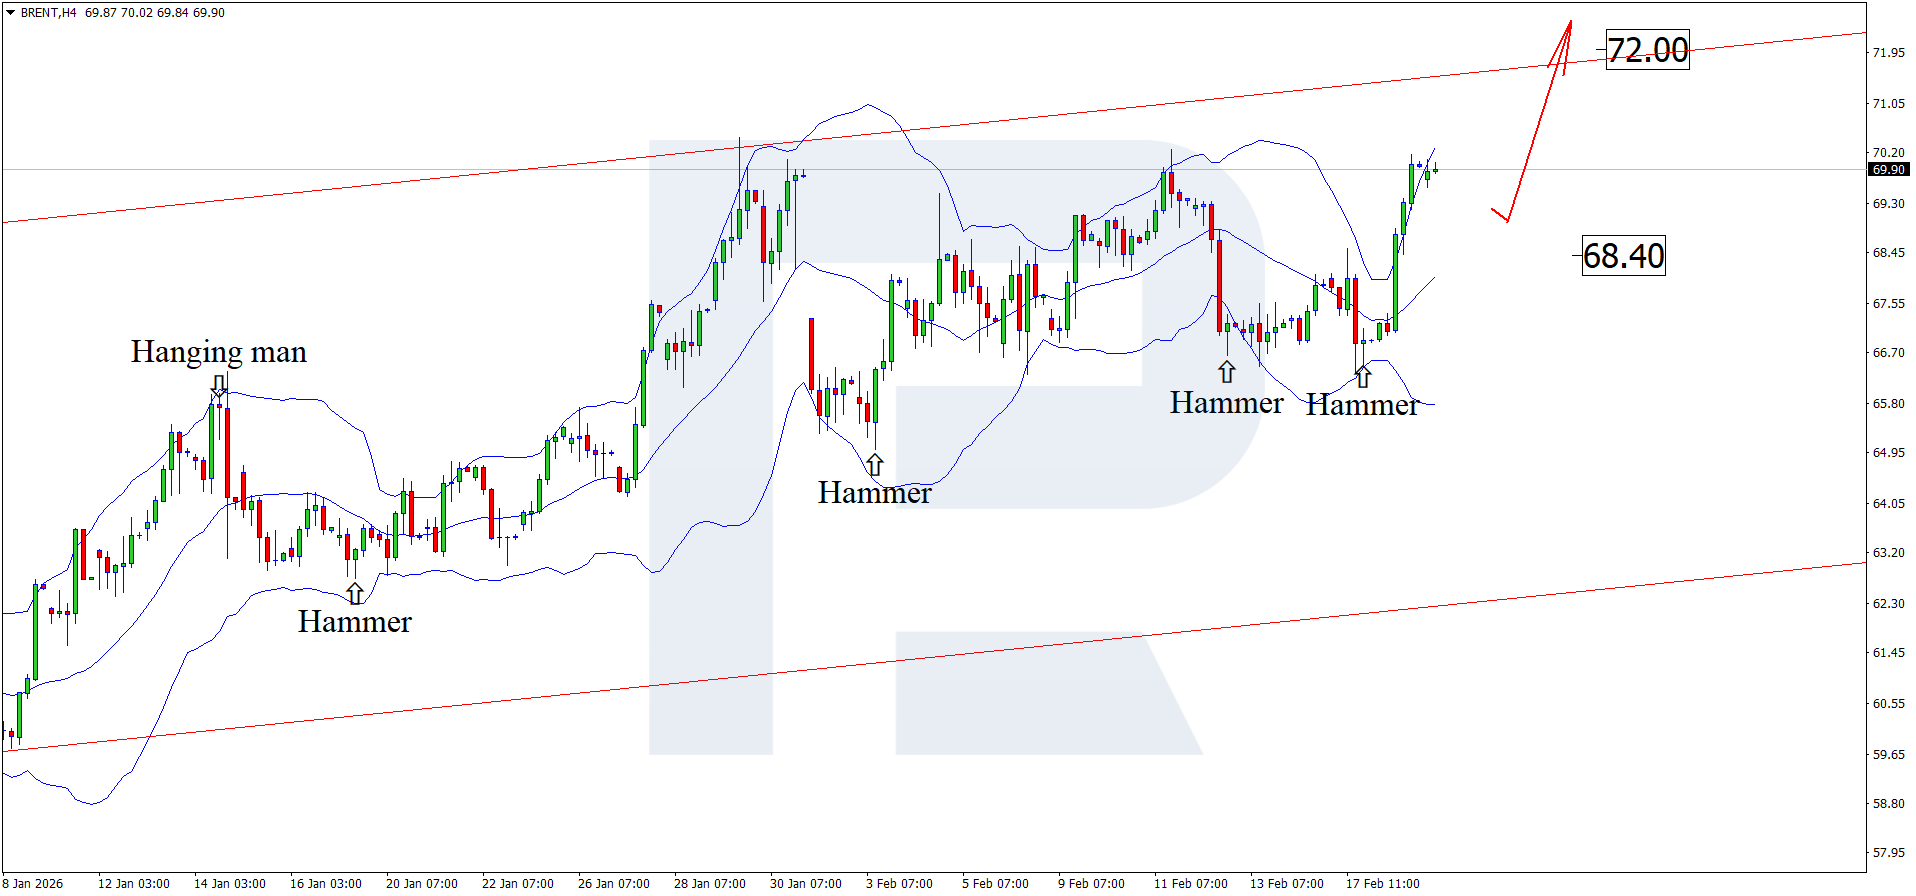
On the H4 chart, Brent quotes formed a Hammer reversal pattern after testing the lower Bollinger Band. At this stage, they continue to develop an upward wave in line with the pattern signal.
The Brent price forecast for 19 February 2026 suggests an upside target of 72.00 USD. A breakout above the resistance level would open the way for a more substantial upward movement.
At the same time, an alternative scenario remains possible, in which Brent quotes may form a corrective wave, with the target for a pullback at 68.40 USD.
Brent overview
- Asset: Brent
- Timeframe: H4 (Intraday)
- Trend: bullish
- Key resistance levels: 71.05 and 72.00
- Key support levels: 68.40 and 65.50
Brent trading scenarios for today
Main scenario (Buy Limit)
Despite the overall upward momentum, risks of a corrective wave remain. A pullback to 68.40, followed by a rebound from this level, would create conditions for opening long positions targeting 72.00 USD.
The risk-to-reward ratio is 1:4.
- Buy Limit: 68.40
- Take Profit: 72.00 USD
- Stop Loss: 68.00 USD
Alternative scenario (Sell Stop)
If geopolitical tensions between the US and Iran ease, prices may consolidate below the 68.40 support level, increasing pressure from sellers and creating conditions for a new bearish impulse.
- Take Profit: 65.50 USD
- Stop Loss: 68.90 USD
Risk factors
The main risks to further Brent growth include an increase in US oil inventories and potential easing of geopolitical tensions between the US and Iran.
Summary
Amid expectations of US oil inventory data, Brent quotes continue to strengthen, with technical analysis suggesting a move towards 72.00 USD following a minor correction.
Editors’ picks
 EURUSD 2026-2027 forecast: key market trends and future predictions
This article provides the EURUSD forecast for 2026 and 2027 and highlights the main factors determining the direction of the pair’s movements. We will apply technical analysis, take into account the opinions of leading experts, large banks, and financial institutions, and study AI-based forecasts. This comprehensive insight into EURUSD predictions should help investors and traders make informed decisions.
 Gold (XAUUSD) forecast 2026 and beyond: expert insights, price predictions, and analysis
Dive deep into the Gold (XAUUSD) price outlook for 2026 and beyond, combining technical analysis, expert forecasts, and key macroeconomic factors. It explains the drivers behind gold’s recent surge, explores potential scenarios including a move toward 4,500 to 5,000 USD per ounce, and highlights why the metal remains a strong hedge during global uncertainty.
Forecasts presented in this section only reflect the author’s private opinion and should not be considered as guidance for trading. RoboForex bears no responsibility for trading results based on trading recommendations described in these analytical reviews.