Brent: buyers are building momentum ahead of new price surge
Brent crude prices continue to rise amid sustained technical strength and escalating geopolitical tensions, currently trading at 71.50 USD. Discover more in our analysis for 24 February 2026.
Brent forecast: key takeaways
- Investors are pricing in the likelihood of negative scenarios and increasing defensive positions
- Prices are rising on expectations of escalating risks rather than actual supply disruptions
- Further movement will depend on news from the US and Iran and overall geopolitical rhetoric
- Brent forecast for 24 February 2026: 74.55
Fundamental analysis
Brent quotes have strengthened for the second consecutive session, although buyers continue to face strong resistance around 71.65 USD. While attempts to consolidate above this level have so far been unsuccessful, the technical outlook remains bullish. Previously, buyers broke above a Triangle pattern, maintaining the potential for further upward movement.
Geopolitics is currently the key market driver. Prices are rising mainly on expectations of escalating risks rather than actual supply reductions. Market participants are proactively pricing in negative scenarios and increasing defensive positions.
Investor focus is shifting to the next round of US-Iran talks scheduled to take place in Geneva. At the same time, the US has increased its military presence in the region, heightening tensions and supporting a geopolitical risk premium in oil prices.
As long as Brent holds above the broken boundary of the Triangle pattern, buyers have the upper hand. However, the next directional move will depend directly on developments in US-Iran relations and overall geopolitical rhetoric.
Technical outlook
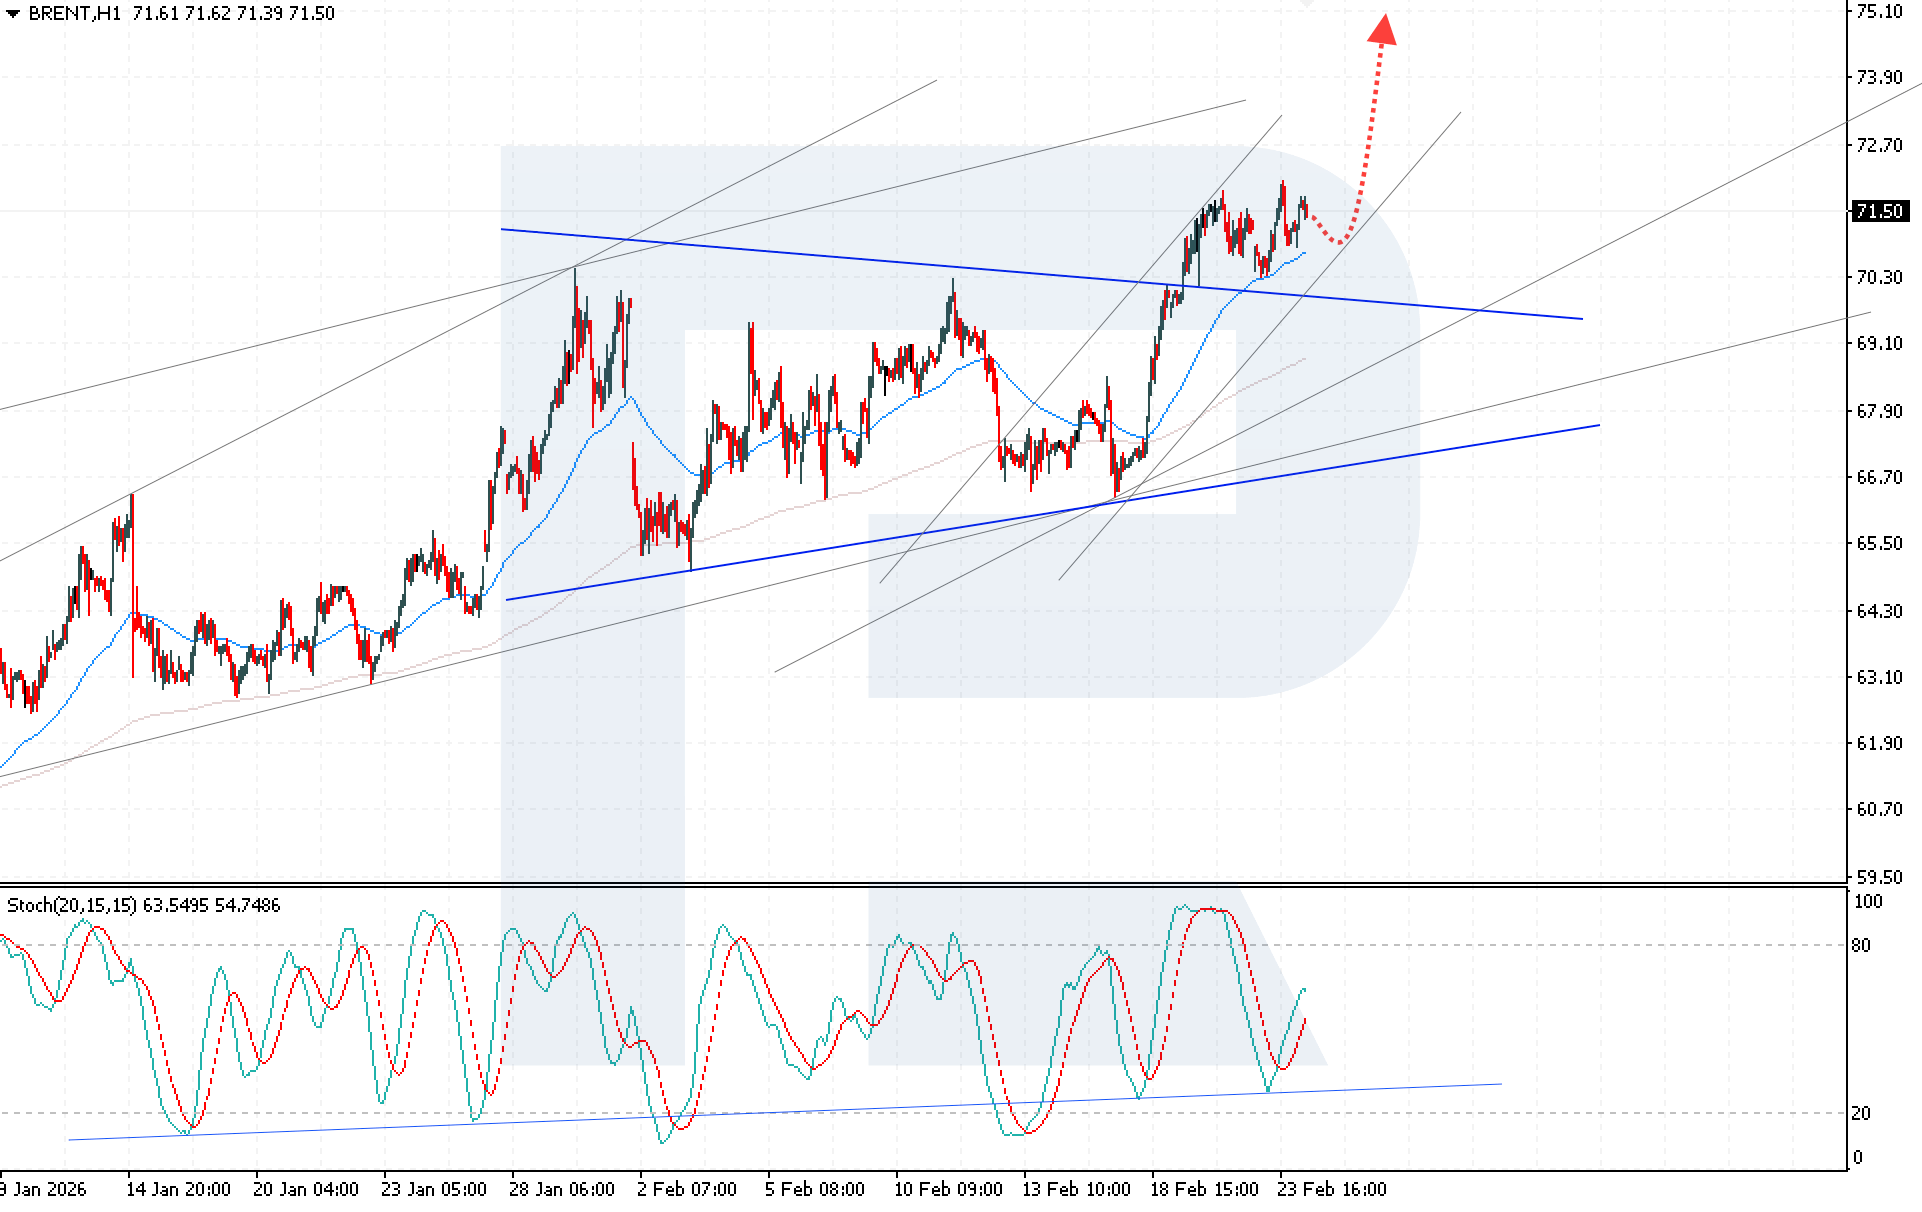
Brent quotes continue to move within an ascending channel. Current dynamics show strengthening buying activity near the local resistance level, increasing the probability of further gains.
Today’s Brent forecast suggests renewed upward momentum with a target of 74.55 USD. The Stochastic Oscillator has rebounded from the support line, and the signal lines have formed a bullish crossover, reinforcing the upside signal. A breakout above the nearest resistance level and consolidation above 72.05 USD would confirm the bullish scenario. In this case, the market would receive an additional technical signal supporting further growth.
An alternative scenario would be activated if prices break below the lower boundary of the ascending channel and consolidate below 70.00 USD. Such a signal would indicate weakening buyer positions and open the way for a deeper corrective decline.
Brent overview
- Asset: Brent
- Timeframe: H1 (Intraday)
- Trend: bullish
- Key resistance levels: 71.65 and 73.85
- Key support levels: 70.25 and 67.45
Brent trading scenarios for today
Main scenario (Buy Stop)
Buyers are increasing pressure, aiming to consolidate above a local resistance level. A breakout above 72.05 would open the door to long positions and continued growth. The potential profit at the take-profit level is 250 pips, with possible losses limited to 120 pips. The risk-to-reward ratio exceeds 1:2.
- Take Profit: 74.55 USD
- Stop Loss: 70.85 USD
Alternative scenario (Sell Stop)
If geopolitical tensions between the US and Iran ease, prices are likely to move lower. A breakout below 70.00 USD will increase bearish pressure.
- Take Profit: 65.50 USD
- Stop Loss: 70.65 USD
Risk factors
The bullish Brent scenario will be invalidated if prices break below the lower boundary of the ascending channel and consolidate below 70.00 USD, indicating a weakening bullish structure. An additional negative signal would be a return below the broken Triangle boundary or de-escalation of geopolitical tensions between the US and Iran.
Summary
As long as Brent trades above the broken boundary of the Triangle pattern, buyers maintain the advantage. However, further price direction will be determined by geopolitical developments between the US and Iran. Brent technical analysis indicates continued bullish momentum, with potential growth towards 74.55 USD if prices consolidate above 71.75 USD.
Editors’ picks
 EURUSD 2026-2027 forecast: key market trends and future predictions
This article provides the EURUSD forecast for 2026 and 2027 and highlights the main factors determining the direction of the pair’s movements. We will apply technical analysis, take into account the opinions of leading experts, large banks, and financial institutions, and study AI-based forecasts. This comprehensive insight into EURUSD predictions should help investors and traders make informed decisions.
 Gold (XAUUSD) forecast 2026 and beyond: expert insights, price predictions, and analysis
Dive deep into the Gold (XAUUSD) price outlook for 2026 and beyond, combining technical analysis, expert forecasts, and key macroeconomic factors. It explains the drivers behind gold’s recent surge, explores potential scenarios including a move toward 4,500 to 5,000 USD per ounce, and highlights why the metal remains a strong hedge during global uncertainty.
Forecasts presented in this section only reflect the author’s private opinion and should not be considered as guidance for trading. RoboForex bears no responsibility for trading results based on trading recommendations described in these analytical reviews.