Brent is waiting for news: what will happen to Hormuz?
Brent prices settled at 93.83 USD. Middle East talks are constantly stalled. Find more details in our analysis for 2 June 2026.
Brent forecast: key takeaways
- Brent is once again pricing in some of the Middle East risks
- The market is worried about the probability of a full closure of the Strait of Hormuz
- Brent forecast for 2 June 2026: 95.50
Fundamental analysis
Brent crude prices are hovering at 93.83 USD per barrel on Tuesday after rising more than 4% at the start of the month. Uncertainty surrounding US-Iran negotiations is supporting the market, forcing investors to factor in the risks of further supply disruptions.
According to Iranian media reports, Tehran suspended contacts with Washington following Israeli strikes on Lebanese territory. This increased doubts about the prospects of a long-term agreement being reached in the Middle East in the near future.
Additional concern comes from reports that Iran and its regional allies are considering a full closure of the Strait of Hormuz and the Bab el-Mandeb Strait. Both routes are crucial for global oil and petroleum product supplies.
Meanwhile, Donald Trump stated that negotiations continue and that a memorandum on restoring shipping through the Strait of Hormuz may be agreed within the coming week.
Against this backdrop, the geopolitical premium in oil prices remains, and the market continues to closely monitor any news from the region.
The Brent forecast is moderate.
Technical outlook
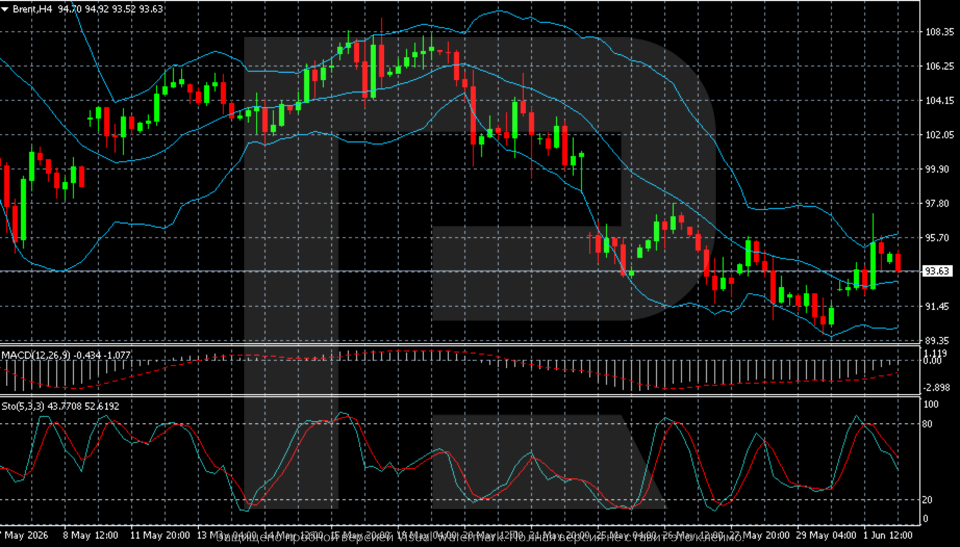
On the H4 chart, Brent remains under pressure after a strong decline from May highs in the 108–109 per barrel area. After a series of sell-offs, quotes moved down into the 91–94 area, where the market is attempting to form a base for stabilisation. Recent sessions have seen trading within a wide sideways range, although the overall trend remains downward for now. Recovery attempts quickly encounter selling pressure.
From a technical perspective, prices are holding near the middle Bollinger Band following the recent rebound from the local lows around 90.00–91.00. The nearest resistance is located in the 95.50–96.00 zone, where sellers have already become active before. Support remains around 91.00–92.00. While Brent remains below 95.50–96.00, it is premature to talk about a full-fledged upward reversal.
Indicators are giving mixed signals. MACD remains in negative territory, but the histogram is gradually recovering, indicating weakening bearish momentum. The Stochastic Oscillator is turning downwards after leaving overbought territory, warning of the risk of a new downward wave in the short term. To improve the technical picture, buyers need to consolidate above 95.50–96.00. Otherwise, the market may retest the 91.00–90.00 area.
Brent overview
- Asset: Brent
- Timeframe: H4 (Intraday)
- Trend: downward with signs of local stabilisation
- Key resistance levels: 95.50 and 96.00
- Key support levels: 91.00 and 90.00
Brent trading scenarios for today
Main scenario (Buy Stop)
Consolidation above the 95.50 resistance level would confirm a recovery move amid ongoing risks of supply disruptions through the Strait of Hormuz and uncertainty surrounding US-Iran negotiations.
- Take Profit: 96.00 USD
- Stop Loss: 95.00 USD
Alternative scenario (Sell Stop)
A breakout below the 91.00 support level would increase pressure on Brent quotes and confirm continued downtrend amid expectations of a possible agreement between Washington and Tehran and the restoration of shipping in the region.
- Take Profit: 90.00 USD
- Stop Loss: 91.50 USD
Risk factors
The oil market remains extremely sensitive to news from the Middle East. Brent is supported by the risk of the closure of the Strait of Hormuz and the Bab el-Mandeb Strait, as well as uncertainty around negotiations between the US and Iran. At the same time, statements about a possible memorandum on restoring shipping are limiting the upside potential of quotes.
Summary
Brent rose and then paused, with market indicators appearing mixed. The Brent forecast for today, 2 June 2026, does not rule out an attempt to rise towards 95.50.
Editors’ picks
 EURUSD 2026-2027 forecast: key market trends and future predictions
This article provides the EURUSD forecast for 2026 and 2027 and highlights the main factors determining the direction of the pair’s movements. We will apply technical analysis, take into account the opinions of leading experts, large banks, and financial institutions, and study AI-based forecasts. This comprehensive insight into EURUSD predictions should help investors and traders make informed decisions.
 Gold (XAUUSD) forecast 2026 and beyond: expert insights, price predictions, and analysis
Dive deep into the Gold (XAUUSD) price outlook for 2026 and beyond, combining technical analysis, expert forecasts, and key macroeconomic factors. It explains the drivers behind gold's historic rally to 4,381 USD, details the impact of the Fed's easing cycle and record central bank buying, and explores potential scenarios as the metal consolidates near 4,000 USD before a projected technical breakout toward 4,500 USD and higher.
Forecasts presented in this section only reflect the author’s private opinion and should not be considered as guidance for trading. RoboForex bears no responsibility for trading results based on trading recommendations described in these analytical reviews.