Gold (XAUUSD) in correction: focus shifts to US data
Gold (XAUUSD) prices slipped to 5,130 USD. Investors are tired of geopolitics and are watching the data. Discover more in our analysis for 10 March 2026.
XAUUSD forecast: key takeaways
- Gold (XAUUSD) is declining amid a correction
- The market believes that geopolitical risk is already priced in
- XAUUSD forecast for 10 March 2026: 5,050 or 5,200
Fundamental analysis
Gold (XAUUSD) prices are declining on Tuesday and holding near 5,130 USD per ounce, extending their correction after the previous session’s drop. Quotes came under pressure after US President Donald Trump said the Middle East conflict could end sooner than expected.
On Monday, Trump called the military operation against Iran short-term and described it as a small operation, which partially eased geopolitical concerns in the markets and reduced demand for safe-haven assets.
Earlier, fears of a prolonged conflict and a possible inflation spike forced investors to reassess expectations for Federal Reserve policy and lower their forecasts for rate cuts this year.
The market’s attention is now shifting to US macroeconomic data. This week, the CPI and PCE releases are expected, which could provide new signals about the Fed’s next steps.
The outlook for gold (XAUUSD) is mixed.
Technical outlook
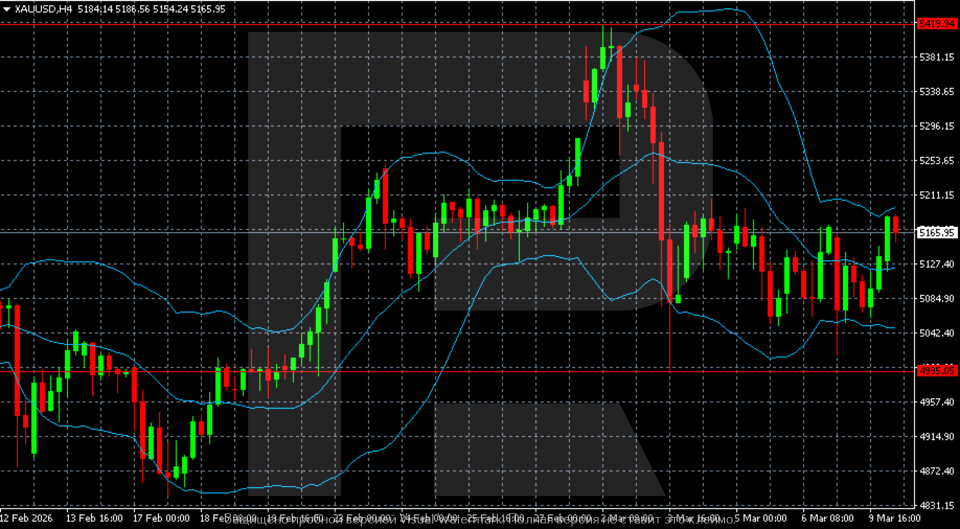
The gold (XAUUSD) H4 chart shows that after strong upward momentum in late February, the market moved into a consolidation phase with elevated volatility.
The rally started roughly from the 4,995–5,000 area. Prices formed a steady upward movement and broke through several intermediate resistance levels in late February. The momentum accelerated in early March, when quotes surged above 5,300 and reached a local peak around 5,400–5,420. At that point, Bollinger Bands widened noticeably, reflecting rising volatility and trend strength.
After quotes reached a new peak, a sharp correction followed. A large bearish candlestick formed on the chart, quickly pushing prices below 5,100. This move was accompanied by a return of quotes back within the Bollinger Band range and signalled profit-taking after the strong rise.
In subsequent sessions, the market stabilised and shifted into sideways movement. Quotes formed a range roughly between 5,050 and 5,200. Gold is now trading around 5,165, near the middle Bollinger Band. The bands are gradually flattening, indicating lower volatility and the formation of a new equilibrium zone.
The nearest resistance level is located in the 5,380–5,420 area, where the prior high was formed. The key support level remains around 4,995–5,000. As long as prices hold above this zone, the medium-term market structure remains bullish, and the current movement looks like a corrective consolidation after a strong upward momentum.
XAUUSD overview
- Asset: XAUUSD
- Timeframe: H4 (Intraday)
- Trend: bullish
- Key resistance levels: 5,380 and 5,420
- Key support levels: 5,050 and 4,995
XAUUSD trading scenarios for today
Main scenario (Buy Stop)
Consolidation above 5,200 would confirm the end of the consolidation phase and renewed upward momentum after the correction. In this case, gold may return to testing the upper boundary of the range and move towards the 5,380–5,420 area, where the recent high is located.
- Take Profit: 5,380
- Stop Loss: 5,120
Alternative scenario (Sell Stop)
A breakout below 5,050 would increase selling pressure and indicate a deeper correction after the previous rally. In this case, the market may test the key support level around 4,995.
- Take Profit: 4,995
- Stop Loss: 5,120
Risk factors
Risks for gold’s upside include a stronger US dollar and reduced geopolitical tensions in the Middle East after statements about a potential end to the conflict. Additional influence on XAUUSD this week will come from US inflation data (CPI and PCE), which may change expectations for the Federal Reserve’s next policy steps.
Summary
Gold (XAUUSD) is correcting after the rally amid easing geopolitical risks. The gold (XAUUSD) forecast for today, 10 March 2026, does not rule out sideways movement within the 5,050–5,200 range.
Editors’ picks
 EURUSD 2026-2027 forecast: key market trends and future predictions
This article provides the EURUSD forecast for 2026 and 2027 and highlights the main factors determining the direction of the pair’s movements. We will apply technical analysis, take into account the opinions of leading experts, large banks, and financial institutions, and study AI-based forecasts. This comprehensive insight into EURUSD predictions should help investors and traders make informed decisions.
 Gold (XAUUSD) forecast 2026 and beyond: expert insights, price predictions, and analysis
Dive deep into the Gold (XAUUSD) price outlook for 2026 and beyond, combining technical analysis, expert forecasts, and key macroeconomic factors. It explains the drivers behind gold’s recent surge, explores potential scenarios including a move toward 4,500 to 5,000 USD per ounce, and highlights why the metal remains a strong hedge during global uncertainty.
Forecasts presented in this section only reflect the author’s private opinion and should not be considered as guidance for trading. RoboForex bears no responsibility for trading results based on trading recommendations described in these analytical reviews.