Gold prices fall despite instability: what is next for XAUUSD
XAUUSD prices continue to decline despite negative forecasts for US macroeconomic data, testing the 4,840 USD level. Discover more in our analysis for 19 March 2026.
XAUUSD forecast: key takeaways
- Fed interest rate decision: previously at 3.75%, currently at 3.75%
- US Philadelphia Fed Manufacturing Index: previously at 16.3, projected at 8.3
- US initial jobless claims: previously at 213 thousand, projected at 215 thousand
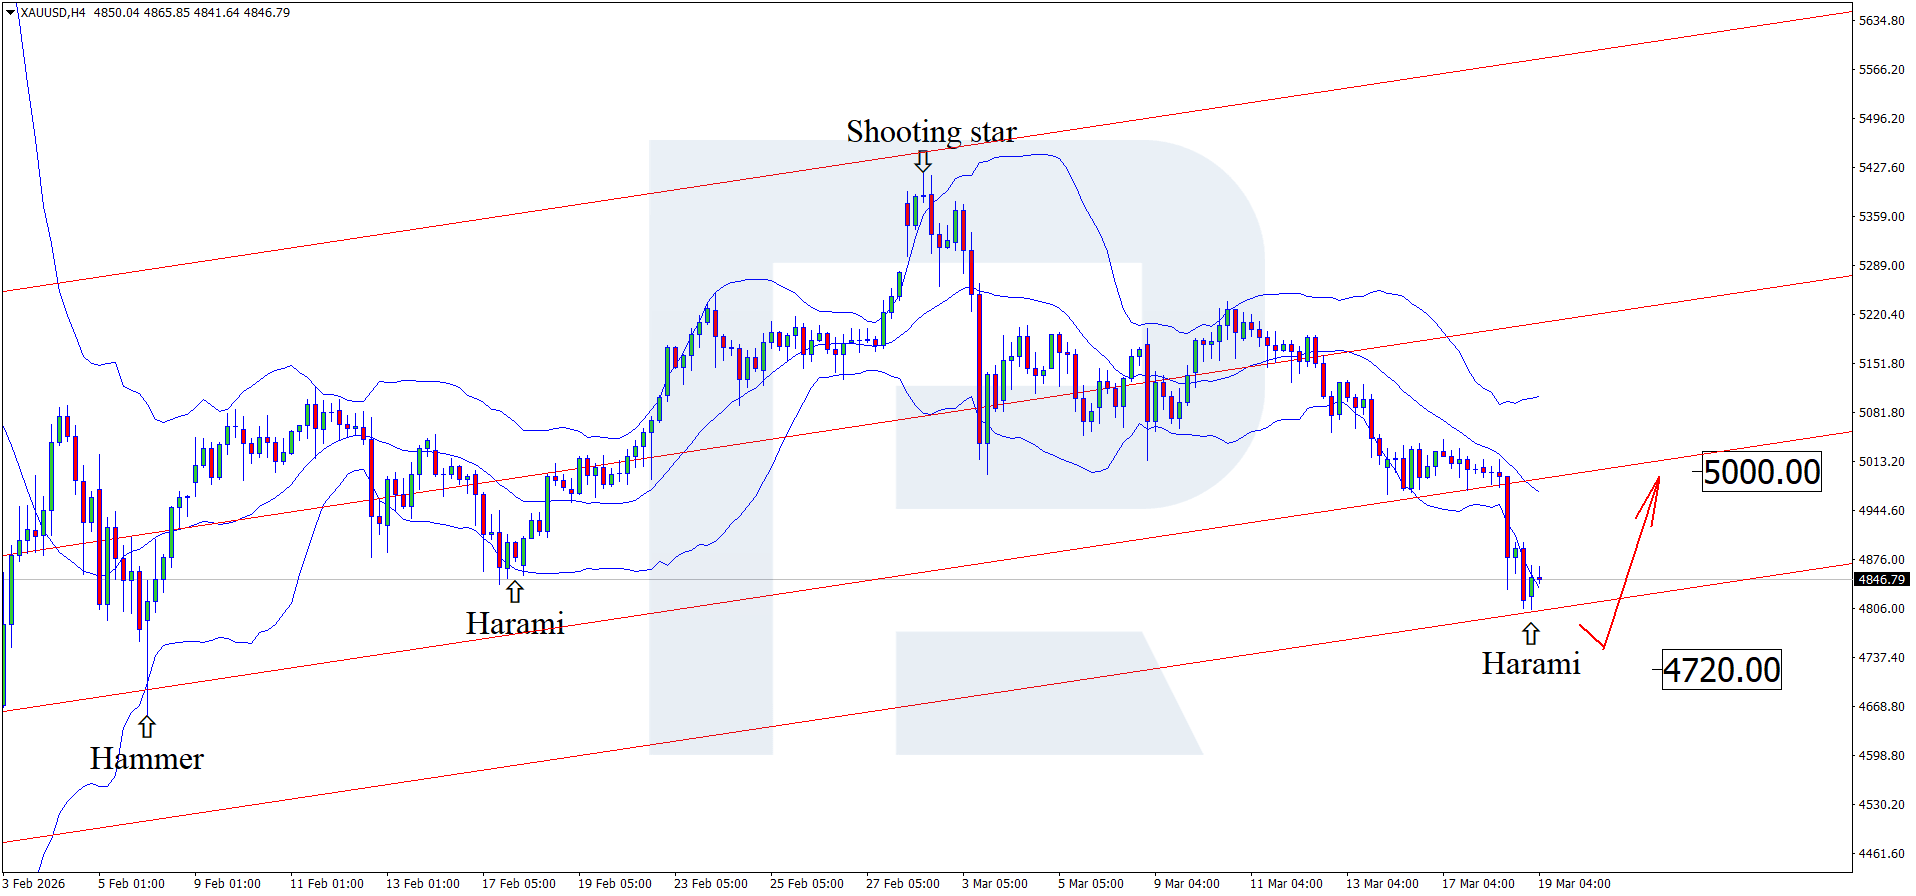
- XAUUSD forecast for 19 March 2026: 4,720 and 5,000
Fundamental analysis
Today’s XAUUSD price forecast shows that gold prices continue their corrective wave, currently trading around 4,840 USD per ounce.
Yesterday, the Federal Reserve held a meeting and published its interest rate decision, leaving the rate unchanged at 3.75% for the second consecutive meeting. Before the war with Iran, the Fed was dealing with elevated inflation and rising unemployment; now the Middle East conflict has been added to the mix. High oil prices may boost inflation in the US, which in turn could become a catalyst for the Federal Reserve to reconsider the policy rate at its next meeting. At this stage, markets are pricing in one rate cut in 2026.
Amid escalating geopolitical risks, the Philadelphia Fed Manufacturing Index is expected to fall to 8.3 on 19 March 2026, down from the previous 16.3.
US initial jobless claims are also expected to deteriorate slightly, rising to 215 thousand from 213 thousand. The change is not critical, but in combination with other macroeconomic data, it may negatively impact the USD.
Despite negative forecasts for US data, gold continues to lose value. The reason may be that major players seek to artificially drive down XAUUSD quotes in order to buy gold at lower prices.
Technical outlook
On the H4 chart, XAUUSD prices formed a Harami reversal pattern near the lower Bollinger Band. In the near term, as the pattern signal plays out, quotes may form an upward wave and resume the uptrend. Since XAUUSD remains within an ascending channel, the first upside target is 5,000 USD.
At the same time, today’s technical analysis also considers an alternative scenario in which prices pull back towards 4,720 USD before rising.
XAUUSD prices retain the potential for continued upward movement and could head towards the next psychological level of 5,600 USD in the near term.
XAUUSD overview
- Asset: XAUUSD
- Timeframe: H4 (Intraday)
- Trend: bearish
- Key resistance levels: 5,000 and 5,230
- Key support levels: 4,720 and 4,500
XAUUSD trading scenarios for today
Main scenario (Sell Stop)
A consolidation below 4,720 would confirm a continued downside move after the correction. Pressure persists amid a weak technical picture and the Fed keeping rates unchanged.
- Take Profit: 4,500
- Stop Loss: 4,760
Alternative scenario (Buy Stop)
A sustained move above 5,000 would indicate a new upward wave with the potential to move towards the resistance zone.
- Take Profit: 5,230
- Stop Loss: 4,950
Risk factors
Downside risks may be reduced by stronger demand for safe-haven assets driven by geopolitics, as well as a weaker USD on soft US macroeconomic data, which could support a rebound in gold.
Summary
Gold continues to lose ground against the USD despite weak US statistics. XAUUSD technical analysis suggests a corrective move towards 5,000 USD before another decline.
Editors’ picks
 EURUSD 2026-2027 forecast: key market trends and future predictions
This article provides the EURUSD forecast for 2026 and 2027 and highlights the main factors determining the direction of the pair’s movements. We will apply technical analysis, take into account the opinions of leading experts, large banks, and financial institutions, and study AI-based forecasts. This comprehensive insight into EURUSD predictions should help investors and traders make informed decisions.
 Gold (XAUUSD) forecast 2026 and beyond: expert insights, price predictions, and analysis
Dive deep into the Gold (XAUUSD) price outlook for 2026 and beyond, combining technical analysis, expert forecasts, and key macroeconomic factors. It explains the drivers behind gold’s recent surge, explores potential scenarios including a move toward 4,500 to 5,000 USD per ounce, and highlights why the metal remains a strong hedge during global uncertainty.
Forecasts presented in this section only reflect the author’s private opinion and should not be considered as guidance for trading. RoboForex bears no responsibility for trading results based on trading recommendations described in these analytical reviews.