
US Treasury supports gold, XAUUSD receives an unexpected boost
The release of the FOMC minutes provided additional support for gold, with XAUUSD quotes currently at 4,485. Discover more in our analysis for 20 August 2026.
XAUUSD forecast: key takeaways
- The US Treasury doubled the volume of Treasury buybacks
- Concerns about persistent inflation intensified within the FOMC
- Falling Treasury yields support gold
- XAUUSD forecast for 20 August 2026: 4,565 or 4,440
Fundamental analysis
The XAUUSD price forecast for today, 20 August 2026, shows that gold is forming a corrective wave after its rise and is testing the 4,485 USD level.
The main new driver was the US Treasury's decision to double the volume of long-term Treasury buyback operations. This contributed to lower bond yields and a weaker dollar, increasing gold's appeal.
The minutes released yesterday showed that concerns about persistent inflation had intensified within the FOMC, with several committee members prepared to support a rate hike if inflationary pressure persisted. At the same time, the market still estimates the probability of rates remaining unchanged in September at around 67%.
If US inflation accelerates and US interest rates remain high for longer than expected, the advantage of yield-bearing assets over gold will increase. Against this backdrop, further gains in XAUUSD will largely depend on how sustainable the decline in Treasury yields proves to be.
The XAUUSD forecast for 20 August 2026 takes into account that gold is bolstered by falling Treasury yields, a weaker dollar, and sustained central bank demand. However, the hawkish signal from the Federal Reserve minutes remains the main constraint on growth: if the market begins to price in higher rates again, pressure on gold will increase.
Technical outlook
On the H4 chart, XAUUSD prices formed a Harami reversal pattern near the upper Bollinger Band and could form a corrective wave as the pattern signal plays out. Since XAUUSD quotes have broken out of the ascending channel, a target for the pullback could be the 4,440 USD support level.
At the same time, XAUUSD technical analysis for today also suggests another scenario in which prices rise towards 4,565 USD without testing the support level.
XAUUSD overview
- Asset: XAUUSD
- Timeframe: H4 (intraday)
- Trend: bullish
- Key resistance levels: 4,565 and 4,600
- Key support levels: 4,440 and 4,270
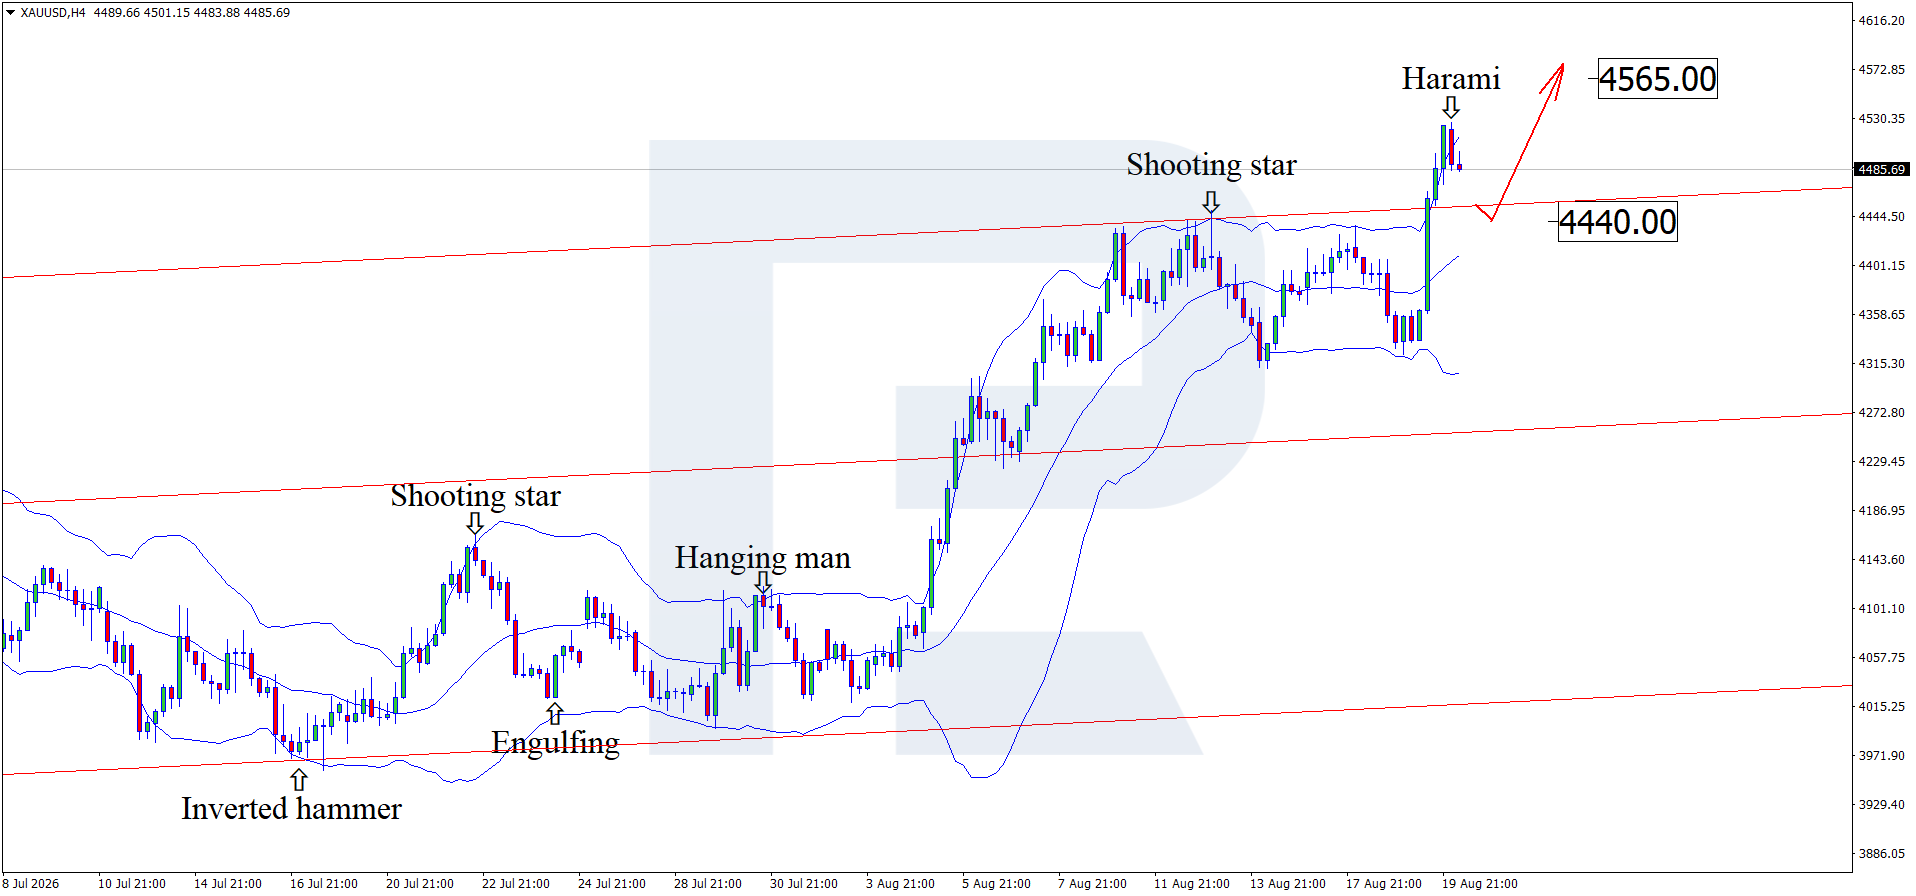
XAUUSD trading scenarios for today
Main scenario (Buy Stop)
A breakout and consolidation above the 4,525 resistance level would confirm continued upward momentum and create conditions for opening long positions.
- Take Profit: 4,565
- Stop Loss: 4,500
Alternative scenario (Sell Stop)
A breakout below the 4,440 support level would indicate a deeper correction and create conditions for opening short positions.
- Take Profit: 4,270
- Stop Loss: 4,465
The trading idea is valid until 00.00 on 20 August 2026.
Risk factors
The main risks to gold’s further gains remain rising US Treasury yields, potential hawkish signals from the Federal Reserve, and a renewed increase in energy prices and inflation.
Summary
Following the release of the FOMC minutes, gold tested the 4,500 USD level but failed to consolidate above it. XAUUSD technical analysis suggests a correction towards the 4,440 support level before further growth.
Editors’ picks
 EURUSD forecast 2026–2027: technical analysis, price levels & predictions
EURUSD has pulled back from the 2026 high of 1.1915 and is now trading near 1.1450 — below both EMA65 and EMA200 — with the active scenario shifting from bullish to bearish. The ECB raised rates to 2.40%, but the Fed holds at 3.75%, and US inflation (3.5%) continues to outpace the eurozone (2.8%). A confirmed break below 1.1280 opens the next downward wave toward 1.1080. We break down the key levels, three trading scenarios with entry triggers, and what Deutsche Bank, Morgan Stanley and UBS are forecasting for EURUSD in 2026.
 Gold (XAUUSD) forecast 2026: predictions based on fundamental and technical analysis
Gold has corrected over 25% from its all-time high of 5,597 USD and is now trading near 4,100 USD — testing a critical support zone. Is this the bottom, or will the downtrend continue? We break down the key levels (support 3,920 USD, breakout trigger 4,500 USD), three trading scenarios with entry levels, and what J.P. Morgan, Goldman Sachs and Deutsche Bank are forecasting for gold in 2026.
Forecasts presented in this section only reflect the author’s private opinion and should not be considered as guidance for trading. RoboForex bears no responsibility for trading results based on trading recommendations described in these analytical reviews.