Gold (XAUUSD) weekly forecast: prices near four-week peak
Gold (XAUUSD) enters the week of 2–6 March above 5,180 USD per ounce and near the highs of almost four weeks, supported by geopolitical risks in the Middle East and uncertainty around US tariff policy. The market has also shifted expectations for a Federal Reserve rate cut to a later date.
On the daily chart, the uptrend structure remains, but after setting a record peak near 5,400, gold has moved into a consolidation phase. The focus is on the dollar’s dynamics and Federal Reserve signals. The baseline scenario suggests movement within the 5,000–5,400 range, with a medium-term bullish bias and heightened sensitivity to the news background.
XAUUSD forecast for this week: quick overview
- Weekly performance: gold (XAUUSD) is holding above 5,180 USD per ounce and trading near the highs of almost four weeks, driven by geopolitical risks and uncertainty around US tariff policy. The market has shifted expectations for the next Federal Reserve rate cut to a later date, not earlier than September
- Support and resistance: the daily chart shows a continued uptrend. After reaching a new peak near 5,400, gold entered a consolidation phase. Bollinger Bands are narrowing, MACD is in positive territory, but momentum is weakening. The key support levels are 4,950–5,000 and 4,750, and the resistance level lies at 5,400. Holding above 4,950 keeps the bullish scenario intact
- Fundamentals and outlook: the focus is on US inflation and Federal Reserve signals. Geopolitics and tariff risks support demand for safe-haven assets. The baseline scenario suggests consolidation within the 5,000–5,400 range while maintaining an overall upward bias
Gold (XAUUSD) fundamental analysis
Gold (XAUUSD) is hovering above 5,180 USD per ounce, trading near the highs of almost four weeks. Geopolitical risks and uncertainty around US trade policy supported the market last week.
Investors are closely watching the build-up of US military presence in the Middle East. Washington has simultaneously increased pressure on Iran by imposing sanctions on entities linked to oil exports and weapons supplies.
The trade agenda adds further tension, as the Trump administration continues to push a global tariff strategy. US Trade Representative Jamieson Greer said tariff rates could be raised to 15% where appropriate after the introduction of a 10% baseline tariff. This followed the Supreme Court’s decision to overturn the previous reciprocal tariffs.
Amid inflation risks, the market pushed expectations for the next Fed rate cut to a later date, with investors now pricing in possible easing not earlier than September.
XAUUSD technical analysis
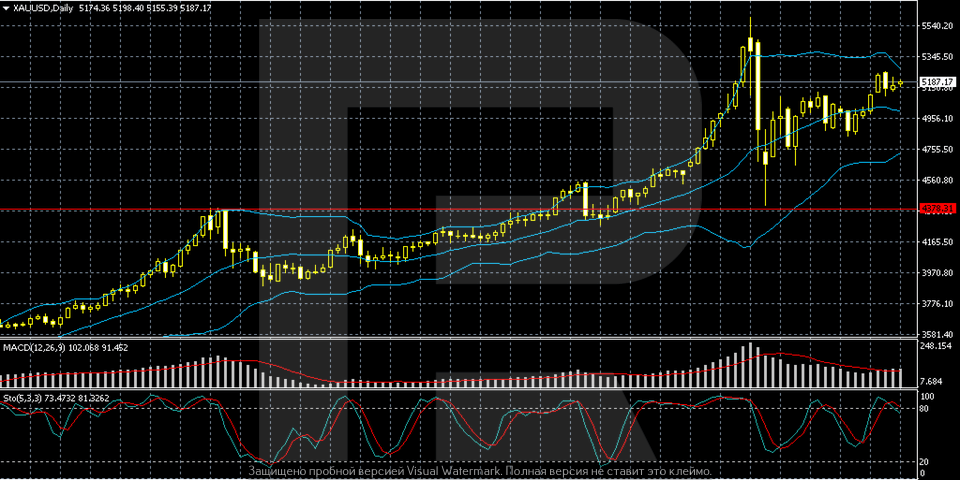
On the daily chart, gold (XAUUSD) maintains a pronounced uptrend.
Prices have consistently formed higher lows and higher highs. After steady growth from the zone below 4,000, quotes accelerated and hit a new all-time high around 5,400, after which they moved into a phase of elevated volatility with long wicks and sharp pullbacks.
Now gold is consolidating below the peaks. Bollinger Bands expanded during upward momentum and then began to narrow partially, indicating a transition from a trending phase to a stabilisation stage.
Prices are holding above the middle Bollinger Band, confirming the medium-term bullish bias. The nearest support zone is seen around 4,950–5,000, while a deeper support lies around 4,750, with resistance remaining in the 5,400 area.
MACD is in positive territory, but the histogram is declining, suggesting weakening momentum. The Stochastic Oscillator is fluctuating in the upper part of the range, without a clear reversal signal.
XAUUSD trading scenarios
The fundamental backdrop for gold remains solid, with XAUUSD prices holding above 5,180 USD per ounce, near their highest level in nearly four weeks. Support comes from geopolitical risks and uncertainty around US tariff policy. The Trump administration is considering increasing tariffs to 15%, and inflation risks have shifted expectations for a Federal Reserve rate cut to a later date, not earlier than September.
From a technical perspective, the long-term uptrend remains intact. After reaching a new all-time high near 5,400, gold entered a consolidation phase. Prices are holding above the middle Bollinger Band, and volatility is declining. MACD is in positive territory, but momentum is weakening; the Stochastic Oscillator is in the upper part of the range. The key support levels are located at 4,950–5,000 and 4,750, and the resistance level lies at 5,400.
- Buy scenario
Long positions are possible if prices hold above 5,000, with a target for another attack at 5,400.
- Sell scenario
A breakout below 4,950 would increase the risk of a decline towards 4,750.
Conclusion: the baseline scenario suggests consolidation below 5,400 while maintaining a medium-term bullish bias.
Summary
Last week, gold (XAUUSD) held above 5,180 USD per ounce, near the highs of almost four weeks, bolstered by geopolitical risks and uncertainty around US tariff policy. The market also shifted expectations for a Federal Reserve rate cut to a later date, not earlier than September.
Technically, the long-term trend remains upward. After reaching a new peak near 5,400, gold moved into consolidation, with prices hovering above the middle Bollinger Band and volatility declining. MACD is in positive territory, but momentum is weakening. The key support levels are at 4,950–5,000 and 4,750, with resistance located at 5,400. The baseline scenario is consolidation below 5,400 while a medium-term bullish bias remains.
Editors’ picks
 EURUSD 2026-2027 forecast: key market trends and future predictions
This article provides the EURUSD forecast for 2026 and 2027 and highlights the main factors determining the direction of the pair’s movements. We will apply technical analysis, take into account the opinions of leading experts, large banks, and financial institutions, and study AI-based forecasts. This comprehensive insight into EURUSD predictions should help investors and traders make informed decisions.
 Gold (XAUUSD) forecast 2026 and beyond: expert insights, price predictions, and analysis
Dive deep into the Gold (XAUUSD) price outlook for 2026 and beyond, combining technical analysis, expert forecasts, and key macroeconomic factors. It explains the drivers behind gold’s recent surge, explores potential scenarios including a move toward 4,500 to 5,000 USD per ounce, and highlights why the metal remains a strong hedge during global uncertainty.
Forecasts presented in this section only reflect the author’s private opinion and should not be considered as guidance for trading. RoboForex bears no responsibility for trading results based on trading recommendations described in these analytical reviews.