Gold (XAUUSD) weekly forecast: the uptrend remains in place
Gold (XAUUSD) enters the week of 16–20 March around 5,160–5,170 USD per ounce after declining last week. Rising oil prices are putting pressure on prices, with a stronger dollar and higher US Treasury yields also weighing on gold.
On the daily chart, the bullish structure remains intact. After reaching new highs above 5,400, gold moved into a correction phase and is now consolidating in the 4,986–5,362 range. The baseline scenario for the week is movement within the 5,000–5,360 range while maintaining the medium-term uptrend.
XAUUSD forecast for this week: quick overview
- Weekly performance: last week, gold (XAUUSD) was under pressure and fell below 5,150 USD per ounce, primarily driven by rising oil prices. The commodities market continues its rally amid fears of a prolonged conflict around Iran. Even the largest-ever release of 400 million barrels from IEA reserves is seen by investors as insufficient to stabilise the market. Additional pressure on gold comes from a stronger dollar and higher US Treasury yields. The market is now pricing in only one Federal Reserve rate cut by the end of the year
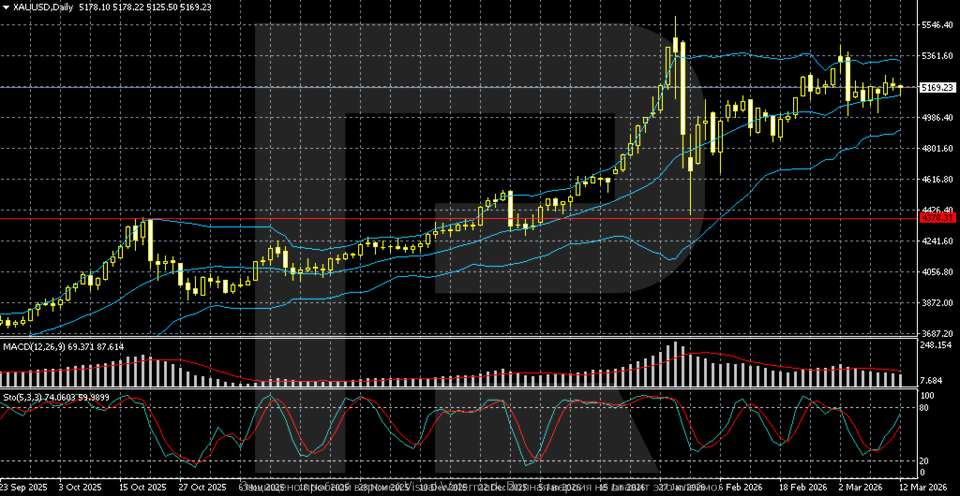
- Support and resistance: the daily chart shows the uptrend that formed in autumn 2025 remains intact. After breaking above 4,378, gold accelerated and hit a new high above 5,400 in late January, followed by a correction. The market is now consolidating in the 4,986–5,362 range and trading around 5,169. MACD has been gradually declining after the January peak, while the Stochastic Oscillator is turning up. Key support is in the 4,986–5,000 zone, while resistance is located around 5,362
- Fundamentals and outlook: despite the current correction, the long-term bullish structure remains as long as prices hold above 4,986. The baseline scenario suggests continued consolidation within the 5,000–5,360 range while maintaining the medium-term uptrend
Gold (XAUUSD) fundamental analysis
Last week, gold (XAUUSD) came under pressure and dipped below 5,150 USD per ounce. The main factor was rising oil prices, which increased inflation risks and reduced the likelihood of near-term monetary easing by central banks.
The oil market continues its rally amid fears of a prolonged conflict around Iran. These risks outweigh the effect of the coordinated release of strategic oil reserves by major economies. Even after the International Energy Agency’s decision to conduct the largest-ever release of 400 million barrels of oil, investors consider this step insufficient to stabilise the market.
Additional pressure on gold comes from a stronger dollar and rising US Treasury yields. Higher inflation expectations reduce the likelihood of a near-term Federal Reserve rate cut – the market is now pricing in only one easing move by the end of the year.
At the same time, data published during the week showed that US core inflation remains moderate at the start of the year. Meanwhile, the EU warned that inflation in the region in 2026 could exceed 3%, which also supports cautious sentiment in markets.
XAUUSD technical analysis
On the daily chart, gold (XAUUSD) maintains upward momentum that formed in autumn 2025. After breaking above the 4,378 area, which previously acted as an important resistance, the market gained momentum and in late January set a new high above 5,400. A sharp correction followed, but the overall structure of higher lows largely remains intact.
In recent weeks, price action has moved into a consolidation phase within a range of roughly 4,986–5,362. Quotes are hovering near the middle Bollinger Band and are now trading around 5,169, signalling a pause after a strong bullish momentum. The nearest support is in the 4,986–5,000 zone, while the key resistance level is located near 5,362.
Indicators point to a moderate loss of momentum. The MACD histogram has been gradually declining after the January peak, while the Stochastic Oscillator is turning up from the mid zone, which may indicate an attempt to restore demand. As long as prices hold above 4,986, the long-term bullish structure remains in place.
XAUUSD trading scenarios
The fundamental backdrop for gold remained mixed last week. XAUUSD fell below 5,150 USD per ounce amid rising oil prices. Developments in commodities increased inflation risks and reduced the likelihood of near-term rate cuts by central banks. The metal was also pressured by a stronger dollar and rising US Treasury yields. The oil market remains tense due to risks of a prolonged conflict around Iran.
From a technical perspective, the long-term uptrend remains intact. After reaching new highs above 5,400, gold entered into a correction phase and is currently consolidating in the 4,986–5,362 range. Support is in the 4,986–5,000 zone, while the resistance level is seen around 5,362.
- Buy scenario
Long positions are possible if prices hold above 5,000 with a target of 5,360–5,400.
- Sell scenario
A breakout below 4,986 will increase downside risks towards 4,800.
Conclusion: the baseline scenario suggests consolidation within the 5,000–5,360 range while the uptrend remains intact.
Summary
Gold (XAUUSD) ended the week around 5,160–5,170 USD per ounce after dipping below 5,150. Pressure on quotes came from rising oil prices, higher inflation expectations, a stronger dollar, and rising US Treasury yields. The market is now pricing in only one Federal Reserve rate cut by the end of the year.
Technically, gold maintains its upward trajectory but is in a consolidation phase after hitting new highs above 5,400. Prices are hovering between 4,986 and 5,362. The baseline scenario suggests movement within this range.
Editors’ picks
 EURUSD 2026-2027 forecast: key market trends and future predictions
This article provides the EURUSD forecast for 2026 and 2027 and highlights the main factors determining the direction of the pair’s movements. We will apply technical analysis, take into account the opinions of leading experts, large banks, and financial institutions, and study AI-based forecasts. This comprehensive insight into EURUSD predictions should help investors and traders make informed decisions.
 Gold (XAUUSD) forecast 2026 and beyond: expert insights, price predictions, and analysis
Dive deep into the Gold (XAUUSD) price outlook for 2026 and beyond, combining technical analysis, expert forecasts, and key macroeconomic factors. It explains the drivers behind gold’s recent surge, explores potential scenarios including a move toward 4,500 to 5,000 USD per ounce, and highlights why the metal remains a strong hedge during global uncertainty.
Forecasts presented in this section only reflect the author’s private opinion and should not be considered as guidance for trading. RoboForex bears no responsibility for trading results based on trading recommendations described in these analytical reviews.