Gold (XAUUSD) weekly forecast: risk of further decline
Gold (XAUUSD) enters the week of 23–27 March at around 4,830 USD per ounce after a previous decline. Pressure on prices came from the Federal Reserve’s hawkish stance: the market is pricing in only one rate cut this year. An additional factor is rising oil prices amid the conflict around Iran. This increases inflation expectations and limits demand for the metal.
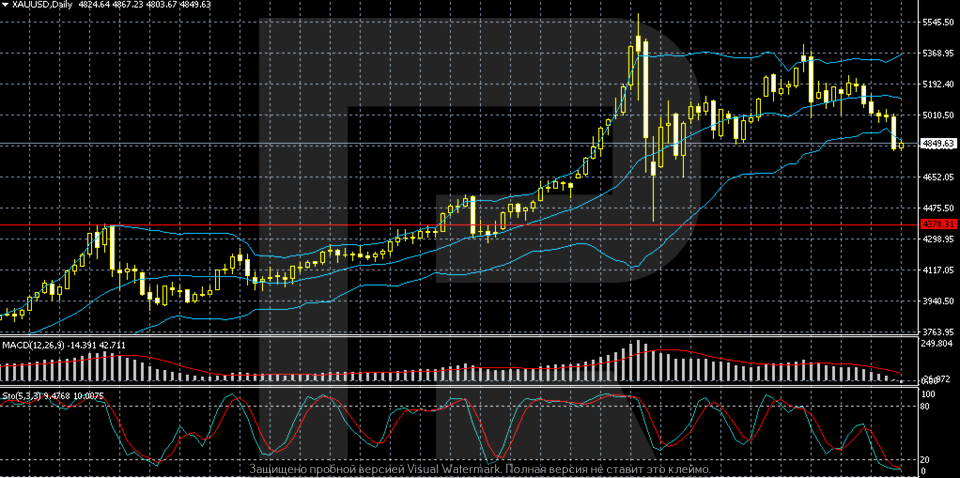
On the daily chart, the medium-term bullish structure remains intact, but after reaching new highs above 5,400, gold moved into a correction phase. Prices have secured below the middle Bollinger band and are forming lower highs. The baseline scenario for the week is movement within the 4,800–5,050 range, with a risk of further decline if prices stay below the 5,000–5,050 area.
XAUUSD forecast for this week: quick overview
- Weekly performance: gold (XAUUSD) came under pressure and stabilised around 4,830 USD per ounce after six consecutive sessions of losses. The main factor was the Federal Reserve’s hawkish stance: the regulator kept rates unchanged and signalled only one cut this year. Rising oil prices amid the conflict around Iran increased inflation risks and limited demand for gold, despite its safe-haven status. Additional pressure came from partial profit-taking by investors
- Support and resistance: the daily chart shows a persistent medium-term uptrend formed at the start of the year. After hitting new highs above 5,400, the market moved into a correction phase and gained a foothold below the middle Bollinger Band, forming lower highs. Indicators confirm weakening momentum: MACD remains in negative territory, and the Stochastic Oscillator is in oversold territory. The key support level is located in the 4,800–4,850 zone, with resistance around 5,000–5,050
- Fundamentals and outlook: despite the correction, the long-term structure remains bullish. The baseline scenario suggests continued pressure and possible consolidation with the risk of a drop below 4,800 while prices remain below 5,000–5,050
Gold (XAUUSD) fundamental analysis
Gold (XAUUSD) prices stabilised near 4,830 USD per ounce by the end of last week. Prices had fallen for six consecutive sessions, the longest selling streak since late 2024. Pressure on the market came from the Federal Reserve’s hawkish stance, which outweighed geopolitical risks.
The Fed held rates steady and signalled only one cut this year. Jerome Powell stressed that policy easing is possible only if inflation slows more confidently. Another factor was uncertainty around the conflict in the Middle East, as higher energy prices increase inflation expectations.
Geopolitics, on the one hand, supports demand for safe-haven assets. On the other hand, rising oil prices are putting pressure on gold. Last week, Iran struck a facility in Qatar linked to the largest LNG complex, heightening tensions after attacks on gas infrastructure in the region.
Since the start of the year, gold has remained up about 12%, but momentum has weakened. Reduced expectations for rate cuts and partial position-taking by investors are limiting upside potential.
XAUUSD technical analysis
On the daily chart, gold (XAUUSD) maintains a medium-term uptrend formed since the start of the year. Prices consistently hit new highs and traded above the middle Bollinger Band, reflecting steady demand and strong upward momentum. Quotes reached the peak above 5,400, after which the market faced sharp profit-taking.
After the impulsive drop, the structure changed: a correction phase began with elevated volatility. Quotes returned to the range and consolidated below the middle Bollinger Band, forming lower highs. Recovery attempts remain limited, and movement is gradually shifting lower, indicating easing buying pressure.
Indicators confirm the corrective scenario. MACD is declining and remains in negative territory, signalling a loss of momentum; the Stochastic Oscillator is in oversold territory, but without a clear reversal. The current 4,800–4,850 zone acts as the nearest support. While prices remain below 5,000–5,050, the risks of further decline persist despite possible short-term rebounds.
XAUUSD trading scenarios
The fundamental backdrop for gold remained mixed last week. XAUUSD stabilised around 4,830 USD per ounce after six consecutive sessions of declines, marking the longest losing streak since late 2024. Pressure came from the Federal Reserve’s hawkish stance: the regulator kept rates unchanged and signalled only one cut this year. Rising oil prices amid the conflict around Iran increased inflation risks and further limited demand for the metal, despite its safe-haven status.
From a technical perspective, the long-term uptrend remains intact; however, after hitting new highs above 5,400, the market shifted into a correction phase. Prices have gained a foothold below the middle Bollinger Band and are forming lower highs. The nearest support level is in the 4,800–4,850 area, with resistance around 5,000–5,050.
- Buy scenario
Long positions are possible if prices return and consolidate above 5,000 with the potential to move towards 5,150.
- Sell scenario
A breakout below 4,800 will increase downside risks with targets in the 4,700–4,650 area.
Conclusion: the baseline scenario is a correction with a risk of further decline if pressure from high rates and inflation expectations persists.
Summary
Gold (XAUUSD) closed the week around 4,830 USD per ounce after declining for six consecutive sessions, marking the longest losing streak since late 2024. Prices came under pressure from the Federal Reserve’s hawkish stance. The market is pricing in only one rate cut this year. An additional factor was rising oil prices amid the conflict around Iran.
Technically, gold retains a medium-term bullish structure but has moved into a correction phase after hitting new highs above 5,400. Prices have consolidated below the middle Bollinger Band and are forming lower highs. The baseline scenario suggests movement within the 4,800–5,050 range, with a risk of continued decline below the 4,800 support level.
Editors’ picks
 EURUSD 2026-2027 forecast: key market trends and future predictions
This article provides the EURUSD forecast for 2026 and 2027 and highlights the main factors determining the direction of the pair’s movements. We will apply technical analysis, take into account the opinions of leading experts, large banks, and financial institutions, and study AI-based forecasts. This comprehensive insight into EURUSD predictions should help investors and traders make informed decisions.
 Gold (XAUUSD) forecast 2026 and beyond: expert insights, price predictions, and analysis
Dive deep into the Gold (XAUUSD) price outlook for 2026 and beyond, combining technical analysis, expert forecasts, and key macroeconomic factors. It explains the drivers behind gold’s recent surge, explores potential scenarios including a move toward 4,500 to 5,000 USD per ounce, and highlights why the metal remains a strong hedge during global uncertainty.
Forecasts presented in this section only reflect the author’s private opinion and should not be considered as guidance for trading. RoboForex bears no responsibility for trading results based on trading recommendations described in these analytical reviews.