Gold (XAUUSD) weekly forecast: downward bias remains in place
Gold (XAUUSD) enters the week of 6–10 April in the 4,600–4,700 USD per ounce range after a correction from local highs. Pressure on quotes persists amid a stronger US dollar following Donald Trump’s statements and uncertainty around the Middle East conflict. Rising oil prices are adding to inflation risks and supporting the Federal Reserve’s hawkish stance, which limits demand for gold.
The baseline scenario for the week is consolidation with a downward bias. While prices remain below 4,800–5,000, the risk of a retest of the 4,300–4,200 area remains.
XAUUSD forecast for this week: quick overview
- Weekly performance: gold (XAUUSD) corrected to 4,690 USD per ounce, halting its rally. Pressure increased amid a stronger dollar after Trump’s comments about uncertain timelines for ending the Middle East conflict. Rising oil prices also add to pressure by boosting inflation risks and supporting hawkish expectations for Fed rates
- Support and resistance: on the daily chart, the structure shifted into a correction phase with a downward bias after the reversal from 5,500. Prices fell to 4,200–4,300 and bounced to 4,600, but remain below the middle Bollinger Band. Support is located at 4,300–4,200, while the resistance level stands at 4,800–5,000
- Fundamentals and outlook: the baseline scenario suggests consolidation with the risk of a renewed decline as long as prices remain below 4,800–5,000. A strong dollar and hawkish rate expectations limit gold’s upside potential
Gold (XAUUSD) fundamental analysis
Last week, gold (XAUUSD) prices corrected to around 4,690 USD per ounce, ending a four-day rise. Pressure on the metal increased amid a rebound in the US dollar following statements by President Donald Trump, who did not set clear timelines for ending the Middle East conflict.
In his comments, Trump noted that the US is close to accomplishing its key strategic objectives in Iran, but he also allowed for the possibility that the military campaign could continue with more intensive actions over the next two to three weeks. Such rhetoric boosted demand for the dollar and supported its position in the global market.
In the current environment, the US currency is once again acting as a safe-haven asset, which weighs on dollar-denominated precious metals, including gold.
An additional factor is rising oil prices, which are increasing inflation risks and shaping expectations of a more hawkish monetary policy stance. Against this backdrop, market participants have fully ruled out a Federal Reserve rate cut scenario in 2026, whereas earlier they had priced in two rounds of easing.
As a result, the balance of factors is shifting against gold: demand for safe-haven assets remains, but a stronger dollar and rising yields limit the potential for further gains.
XAUUSD technical analysis
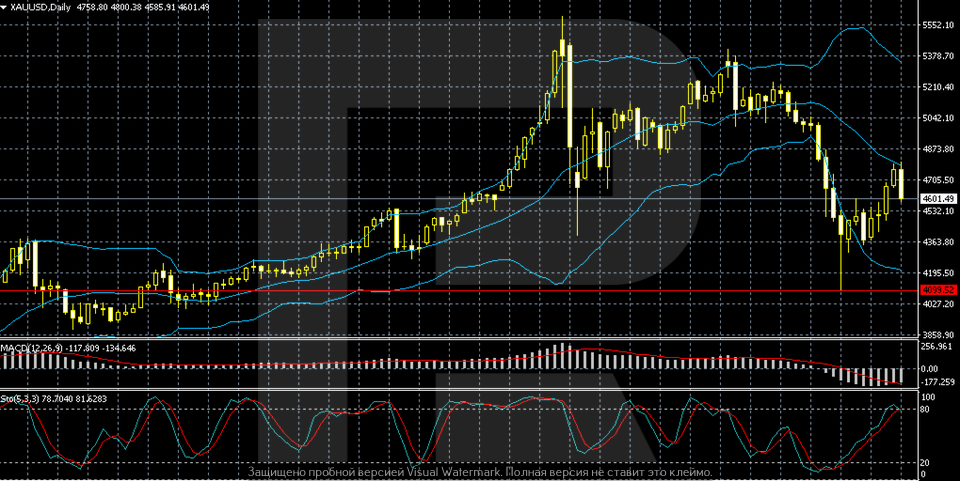
On the daily chart, gold (XAUUSD) has moved into a correction phase after a strong uptrend. After hitting new local highs near 5,500, a sharp reversal followed, accompanied by high volatility and a series of long bearish candlesticks. Current prices of around 4,601 reflect a partial recovery after the decline, but the structure has already shifted from a steady uptrend into a more neutral-to-bearish phase.
Bollinger Bands indicate a widening of the range during the sell-off and subsequent narrowing on the rebound. Prices tested the lower boundary of the channel around 4,200–4,300 and bounced upwards, confirming demand at lower levels. However, quotes are now hovering below the indicator’s midline, signalling persistent selling pressure and the risk of another decline.
Momentum indicators present a mixed picture. MACD remains in negative territory, although the pace of decline is slowing, which may indicate a consolidation base is forming. The Stochastic Oscillator has exited oversold territory and is approaching overbought levels, reflecting short-term recovery momentum. In the near term, consolidation within a range is likely, with the key support level around 4,300 and resistance in the 4,800–5,000 area.
XAUUSD trading scenarios
The fundamental backdrop for gold remained negative last week. After rising, XAUUSD prices corrected to 4,690 USD per ounce amid a stronger dollar. Pressure was reinforced by Trump’s statements about uncertain timelines for ending the Middle East conflict and the possibility of increased military activity. The dollar is again acting as a safe-haven asset. Rising oil prices also weigh on gold: inflation risks are increasing, and the market has ruled out Federal Reserve rate cuts in 2026.
From a technical perspective, gold has shifted into a downward correction. After reaching highs near 5,500, prices fell to 4,200–4,300 and rebounded to 4,600. Quotes remain below the middle Bollinger Band, indicating selling pressure. MACD is in negative territory, while the Stochastic Oscillator reflects a short-term bounce. Consolidation within a range is likely, with support at 4,300–4,200 and resistance at 4,800–5,000.
- Buy scenario
A consolidation above 4,800 would open the way towards 5,000.
- Sell scenario
A breakout below the 4,300 level would extend the decline towardы 4,200.
Conclusion: the baseline scenario is sideways movement with a downward bias amid a strong dollar and hawkish rate expectations.
Summary
Gold (XAUUSD) ended the week near 4,690 USD per ounce, correcting after the rise. Pressure increased as the US dollar strengthened following Donald Trump’s statements about uncertain timelines for ending the Middle East conflict. Rising oil prices are fuelling inflation expectations and bolstering the Fed’s hawkish stance, which is limiting demand for gold.
Technically, the structure has shifted into a downward correction after highs near 5,500. Prices remain below the middle Bollinger Band despite the rebound from 4,200–4,300. The baseline scenario is consolidation in the 4,300–4,800 range with the risk of a renewed decline below 4,300.
Editors’ picks
 EURUSD 2026-2027 forecast: key market trends and future predictions
This article provides the EURUSD forecast for 2026 and 2027 and highlights the main factors determining the direction of the pair’s movements. We will apply technical analysis, take into account the opinions of leading experts, large banks, and financial institutions, and study AI-based forecasts. This comprehensive insight into EURUSD predictions should help investors and traders make informed decisions.
 Gold (XAUUSD) forecast 2026 and beyond: expert insights, price predictions, and analysis
Dive deep into the Gold (XAUUSD) price outlook for 2026 and beyond, combining technical analysis, expert forecasts, and key macroeconomic factors. It explains the drivers behind gold’s recent surge, explores potential scenarios including a move toward 4,500 to 5,000 USD per ounce, and highlights why the metal remains a strong hedge during global uncertainty.
Forecasts presented in this section only reflect the author’s private opinion and should not be considered as guidance for trading. RoboForex bears no responsibility for trading results based on trading recommendations described in these analytical reviews.