Gold (XAUUSD) weekly forecast: consolidation with downside risks
Gold (XAUUSD) enters the week of 13–17 April in the 4,700–4,750 USD per ounce range after volatile moves and an attempt to stabilise. Pressure persists amid a fragile ceasefire in the Middle East and uncertainty around the Strait of Hormuz. A recovery in oil prices, along with a stronger dollar and higher yields, keeps inflation risks elevated and limits demand for gold.
The baseline scenario for the week is consolidation with a downward bias. As long as prices remain below 4,800–5,000, the risk of a retest of the 4,500–4,300 area remains.
XAUUSD forecast for this week: quick overview
- Weekly performance: gold (XAUUSD) stabilised near 4,700 USD after sharp swings. Pressure remains amid a fragile ceasefire in the Middle East and uncertainty around the Strait of Hormuz. Oil’s recovery, a stronger dollar, and rising yields are increasing inflation risks and limiting demand for gold despite the recent bounce
- Support and resistance: on the daily chart, the structure has shifted into a correction after the reversal from 5,500. Prices dropped towards 4,200–4,300 and recovered to 4,700–4,750, trading near the middle Bollinger Band. The market is entering a consolidation phase, with support at 4,500–4,300 and resistance at 5,000–5,200
- Fundamentals and outlook: the baseline scenario is consolidation with a risk of a renewed decline while prices remain below 4,800–5,000. A strong dollar and rising yields limit recovery potential, while uncertainty around the Middle East ceasefire keeps volatility elevated
Gold (XAUUSD) fundamental analysis
Gold stabilised near 4,700 USD per ounce over the week after sharp swings earlier. Investors are assessing a fragile Middle East ceasefire amid ongoing local clashes and uncertainty around the reopening of the Strait of Hormuz.
Iranian media report that tanker transit through the strait has been restricted again after strikes in the region. Tehran officials say several ceasefire conditions have been violated. This keeps tension in the market elevated.
At the same time, US Vice President JD Vance noted signs of a possible resumption of shipping and travelled to Islamabad for direct talks with Iran.
Oil prices partially recovered, while the dollar and bond yields rose slightly, weighing on gold. At the end of last week, the metal rose more than 3% on ceasefire headlines, but then gave back almost all the gains amid profit-taking and a broad improvement in risk appetite across global markets.
XAUUSD technical analysis
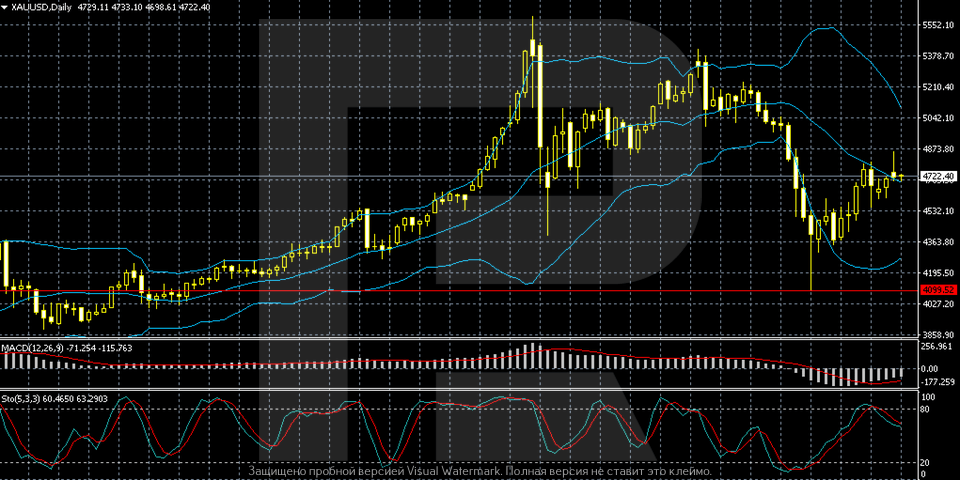
The XAUUSD daily chart shows that after a prolonged uptrend, the market formed a peak near 5,500 and moved into a correction phase. The decline was sharp and impulsive, with a series of long bearish candlesticks indicating aggressive profit-taking and a shift in short-term sentiment. Lows were recorded near 4,200, from where a rebound began.
Prices then shifted into a partial recovery phase and are currently trading around 4,700–4,750. Bollinger Bands first widened sharply on the drop and then began to narrow, signalling reduced volatility and a transition into consolidation. Prices are hovering near the indicator’s midline, suggesting a balance between buyers and sellers after the strong downside move.
Indicators confirm a neutral-to-recovery phase. MACD remains in negative territory, but the histogram is gradually contracting, indicating that downside momentum is slowing. The Stochastic Oscillator is in the upper part of the range and is starting to turn lower, signalling a possible short-term correction. Overall, the market appears to be shifting from a trend to a range, with key support levels at 4,500–4,300 and resistance at 5,000–5,200.
XAUUSD trading scenarios
The fundamental backdrop for gold remains unstable. XAUUSD prices are hovering near 4,700 USD per ounce after sharp swings amid a fragile Middle East ceasefire. Uncertainty around the Strait of Hormuz persists: reports of violated agreement terms and restricted shipping keep tensions elevated. At the same time, rising oil, a firmer dollar, and higher yields increase inflation risks and weigh on the metal despite short-term recovery attempts.
From a technical perspective, gold has shifted into a correction phase after reversing from 5,500. The drop towards 4,200–4,300 was followed by a recovery to 4,700–4,750, where the market moved into consolidation. Prices are hovering near the middle Bollinger Band, indicating balance. MACD remains in negative territory, but downside momentum is weakening, while the Stochastic Oscillator signals a possible short-term correction. The range remains, with support at 4,500–4,300 and resistance at 5,000–5,200.
- Buy scenario
A breakout and consolidation above 4,800 would open the way towards 5,000–5,200.
- Sell scenario
A breakout below 4,500 would increase pressure and bring prices back towards 4,300.
Conclusion: the baseline scenario is consolidation with a downward bias amid a strong dollar, high rates, and persistent geopolitical uncertainty.
Summary
Gold (XAUUSD) prices are holding near 4,700 USD per ounce after sharp swings and an attempt to recover. Pressure persists amid a fragile Middle East ceasefire and uncertainty around the Strait of Hormuz. Rising oil prices, a stronger dollar, and higher yields increase inflation risks and limit demand for gold.
Technically, the structure has shifted into a correction after peaks near 5,500. Prices rebounded from 4,200–4,300 and are consolidating in the 4,700–4,750 zone near the middle Bollinger Band. The baseline scenario is range-bound movement with a downward bias within 4,500–5,000 and a risk of another drop towards 4,300.
Editors’ picks
 EURUSD 2026-2027 forecast: key market trends and future predictions
This article provides the EURUSD forecast for 2026 and 2027 and highlights the main factors determining the direction of the pair’s movements. We will apply technical analysis, take into account the opinions of leading experts, large banks, and financial institutions, and study AI-based forecasts. This comprehensive insight into EURUSD predictions should help investors and traders make informed decisions.
 Gold (XAUUSD) forecast 2026 and beyond: expert insights, price predictions, and analysis
Dive deep into the Gold (XAUUSD) price outlook for 2026 and beyond, combining technical analysis, expert forecasts, and key macroeconomic factors. It explains the drivers behind gold’s recent surge, explores potential scenarios including a move toward 4,500 to 5,000 USD per ounce, and highlights why the metal remains a strong hedge during global uncertainty.
Forecasts presented in this section only reflect the author’s private opinion and should not be considered as guidance for trading. RoboForex bears no responsibility for trading results based on trading recommendations described in these analytical reviews.