Gold (XAUUSD) weekly forecast: there is a chance for growth – the market is ready for it
Gold (XAUUSD) enters the week of 27 April–1 May near 4,700 USD per ounce after declining and losing some of its recent gains. Pressure remains amid high uncertainty in the Middle East and the blockade of the Strait of Hormuz. Iran retains control of the route, the US continues its port blockade, and the market is awaiting a new proposal to resolve the conflict. Since the start of the confrontation, the metal has remained about 10% lower.
The baseline scenario for the week is consolidation within a range with a neutral bias. As long as prices hold above 4,700, attempts at a recovery towards 4,900–5,000 are possible. A loss of the 4,700 level will increase pressure and bring back the risk of a decline into the 4,500–4,300 area.
XAUUSD forecast for this week: quick overview
- Weekly performance: gold (XAUUSD) declined to 4,700 USD per ounce, giving back some of its gains. Pressure persists amid uncertainty in the Middle East and the blockade of the Strait of Hormuz. Since the start of the conflict, the metal has lost about 10%
- Support and resistance: on the daily chart, the market exited the uptrend after reversing from 5,400–5,500 and entered a correction phase, dropping to the 4,300–4,400 zone. Prices are currently recovering and forming a sideways range around 4,700. Support levels are located at 4,500 and 4,300, with resistance in the 4,900–5,000 area
- Fundamentals and outlook: the baseline scenario is consolidation after a sharp decline. Upside potential is limited by inflation risks and expectations of tight central bank policy. Further movement will depend on geopolitics and rate dynamics
Gold (XAUUSD) fundamental analysis
Gold ended the week lower in the 4,700 USD per ounce area, paring some of its recent gains. Pressure remains due to high uncertainty in the Middle East and the blockade of the Strait of Hormuz, which keeps energy prices and inflation risks elevated.
Iran retains control over the strait, significantly restricting international shipping. Reports say that last week it opened fire on commercial vessels. In response, the US continues its blockade of Iranian ports, increasing pressure on Tehran. Iran views these actions as a violation of the ceasefire terms.
At the same time, US President Donald Trump said the ceasefire would remain in effect indefinitely while Washington awaits a new proposal from Iran.
Overall, gold has remained under pressure since the conflict began. Higher energy prices have increased inflation expectations and raised the probability of tighter central bank policy. All these factors limit demand for the metal.
Since the start of the confrontation, gold has lost about 10%, reflecting the market’s sensitivity to inflation and rate dynamics.
XAUUSD technical analysis
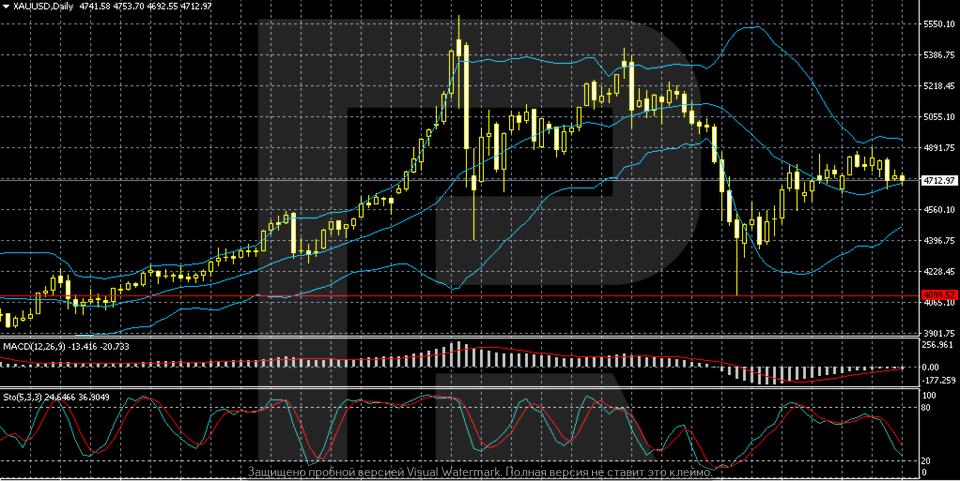
The XAUUSD daily chart shows that after a strong uptrend, prices formed a peak in the 5,400–5,500 area, followed by a sharp reversal lower with high volatility. This move was accompanied by long candlesticks and wide ranges, indicating active profit-taking and a shift in the balance of power in the market.
After the drop to the 4,300–4,400 area, a rebound began, and gold is now trading around 4,700+, forming a recovery phase. However, the structure no longer looks like a trend: the movement is choppy, with alternating upward impulses and pullbacks. This looks more like consolidation after a sharp decline.
Bollinger Bands confirm this picture: after a sharp expansion, the range is gradually narrowing, signalling lower volatility. Prices are hovering near the middle line, occasionally testing it from above and below. The nearest resistance level is forming in the 4,900–5,000 zone, while support levels remain around 4,500 and below, at around 4,300.
Indicators show weakening downside momentum. MACD remains in negative territory, but the histogram is contracting, signalling a possible transition to more neutral dynamics. The Stochastic Oscillator is moving down from overbought territory, indicating the risk of a short-term pullback. Overall, the market is in a balance phase, awaiting a new driver to break out of the range.
XAUUSD trading scenarios
The fundamental backdrop for gold remains tense. XAUUSD ended the week near 4,700 USD per ounce, paring some of its gains amid high uncertainty in the Middle East. The Strait of Hormuz remains effectively closed: Iran retains control of the route, while the US continues its port blockade. This supports energy prices and intensifies inflation risks. Despite a formal ceasefire, the conflict remains a pressure factor. Since the start of the confrontation, the precious metal has fallen by about 10%.
Technically, the market has entered a consolidation phase after plunging from 5,400–5,500 to 4,300–4,400. The current movement around 4,700 looks like a recovery without a clear trend: choppy swings with alternating impulses and pullbacks. Prices are hovering around the middle Bollinger Band, and the range is narrowing. MACD remains in negative territory, but downside momentum is weakening; the Stochastic Oscillator indicates the risk of a short-term pullback. Range: support levels at 4,500 and 4,300, and resistance at 4,900–5,000.
- Buy scenario
A consolidation above 4,900–5,000 would open the way for further recovery.
- Sell scenario
A breakout below 4,500 would increase pressure and bring prices back to 4,300.
Conclusion: the market is in balance after a sharp decline. The baseline scenario appears to be a range-bound consolidation, heavily influenced by geopolitical developments and inflation expectations.
Summary
Gold (XAUUSD) prices are hovering near 4,700 USD per ounce, with geopolitics remaining the key factor. Since the conflict began, gold has been about 10% lower.
Technically, the structure has shifted into a consolidation phase after the reversal from the 5,400–5,500 highs. Prices are hovering near the middle Bollinger Band within the 4,700–5,000 range; movement remains choppy and without a clear trend. The baseline scenario suggests sideways trading with attempts to rise towards the upper boundary of the range. However, without a consolidation above 4,900–5,000, the risk of a pullback towards 4,500–4,300 remains.
Editors’ picks
 EURUSD 2026-2027 forecast: key market trends and future predictions
This article provides the EURUSD forecast for 2026 and 2027 and highlights the main factors determining the direction of the pair’s movements. We will apply technical analysis, take into account the opinions of leading experts, large banks, and financial institutions, and study AI-based forecasts. This comprehensive insight into EURUSD predictions should help investors and traders make informed decisions.
 Gold (XAUUSD) forecast 2026 and beyond: expert insights, price predictions, and analysis
Dive deep into the Gold (XAUUSD) price outlook for 2026 and beyond, combining technical analysis, expert forecasts, and key macroeconomic factors. It explains the drivers behind gold’s recent surge, explores potential scenarios including a move toward 4,500 to 5,000 USD per ounce, and highlights why the metal remains a strong hedge during global uncertainty.
Forecasts presented in this section only reflect the author’s private opinion and should not be considered as guidance for trading. RoboForex bears no responsibility for trading results based on trading recommendations described in these analytical reviews.