Gold (XAUUSD) weekly forecast: there is a basis for growth, but more details are needed
Gold (XAUUSD) enters the week of 11–15 May near 4,700 USD per ounce after rebounding amid falling oil prices. Support came from rising expectations of a deal between the US and Iran: the market is reacting to diplomatic signals and the potential reopening of the Strait of Hormuz. This eased inflation risks, but interest rates continue to limit upside – the Fed emphasises that inflation remains above target, meaning restrictive policy may persist for longer.
The baseline scenario for the week suggests consolidation. While prices hold above 4,500–4,550, attempts to rise towards 4,800–4,900 are possible. A loss of this area will increase pressure and bring back the risk of a decline to the 4,500–4,300 area.
XAUUSD forecast for this week: quick overview
- Weekly performance: gold (XAUUSD) gained a foothold near 4,700 USD per ounce after rebounding mid-week. Support came from falling oil prices amid expectations of a US-Iran agreement, which eased inflation risks. The market is reacting to de-escalation signals, but remains sensitive to headlines
- Support and resistance: on the daily chart, the structure shifted from bullish to corrective after the reversal from 5,400–5,500 and the drop to 4,300–4,400. Consolidation is now forming within the 4,500–4,900 range. The nearest support levels lie at 4,500–4,550 and 4,300, with resistance at 4,800–4,900
- Fundamentals and outlook: the baseline scenario is sideways movement. Falling oil prices support gold, but the rate factor limits upside: inflation remains above the Fed’s target. Further movement will depend on developments in Iran talks and monetary policy expectations
Gold (XAUUSD) fundamental analysis
Gold (XAUUSD) ended last week near 4,700 USD per ounce after a strong mid-week rally. The market was bolstered by a sharp decline in oil prices amid hopes for a deal between the US and Iran. This reduced inflation risks and pressure from expectations of restrictive central bank policy.
Diplomacy remains the key driver. According to media reports, Washington sent Tehran via intermediaries a framework memorandum that could become a step towards ending the conflict and gradually reopening the Strait of Hormuz. Iran has already confirmed that it is reviewing the proposal, with a response expected in the coming days. Broader talks on Iran’s nuclear program may begin later.
The drop in oil has eased inflationary tensions and partially revived interest in gold. However, interest rates remain a market constraint. Fed officials note that inflation is still far from the 2% target.
At this point, the gold market remains balanced between geopolitics and rate expectations. The baseline scenario is consolidation near current levels with high sensitivity to Middle East headlines.
XAUUSD technical analysis
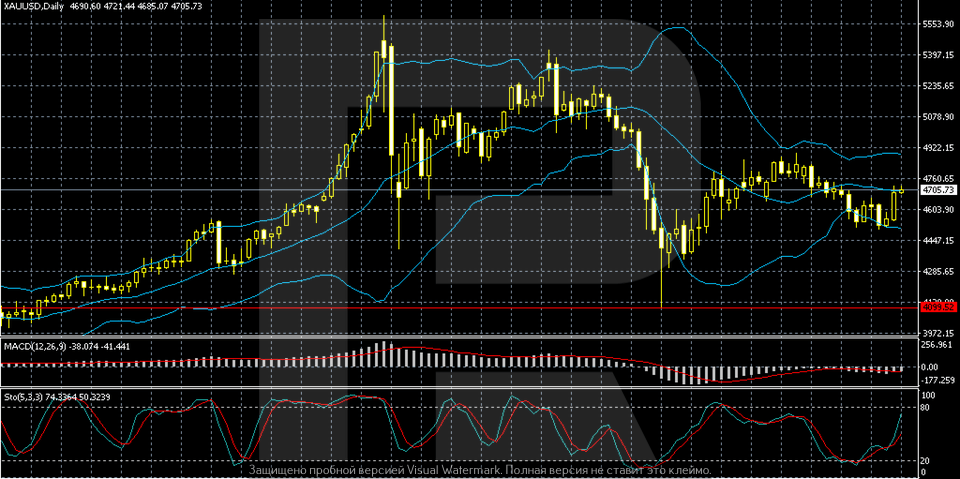
The XAUUSD daily chart clearly shows the end of the strong uptrend, with prices rising steadily from below 4,200 to a peak in the 5,400–5,500 area. The final stage of the rally was accompanied by acceleration and widening Bollinger Bands – a classic sign of overheating. After reaching the highs, the market sharply reversed lower, forming long, volatile candlesticks, indicating active profit-taking and a shift in balance in favour of sellers.
The decline was fast and directional: quotes moved almost without pauses to the 4,300–4,400 zone, where a local bottom formed. This area acted as strong support, prompting aggressive buying and a rebound. However, the recovery did not turn into a new trend: prices returned to the 4,600–4,800 range, but failed to consolidate above it and began to fluctuate again.
The current dynamics are sideways consolidation following a strong downward momentum. Prices are moving near the middle Bollinger Band, while the bands have noticeably narrowed, indicating lower volatility and position-building. Nearest support is in the 4,500–4,550 zone, where the market has already found demand. Resistance remains in the 4,800–4,900 area, where selling pressure and profit-taking increase.
Indicators confirm a neutral-to-weak structure. MACD remains in negative territory, although selling pressure is gradually losing strength – the histogram is shrinking. The Stochastic Oscillator, meanwhile, is rising from the mid-zone, signalling an attempt at a local move higher. Overall, the market is in a balance phase. Without a new fundamental driver, a breakout from the 4,500–4,900 range is not yet confirmed. Any upward movement remains a correction within a broader bearish structure.
XAUUSD trading scenarios
The fundamental backdrop for gold has improved, but remains mixed. XAUUSD closed the week near 4,700 USD per ounce after rebounding amid falling oil prices. This eased inflation risks and partially revived interest in the metal. The key driver is diplomacy: the US sent Iran a framework memorandum via intermediaries that could become a step towards ending the conflict and reopening the Strait of Hormuz. Tehran’s response is expected in the coming days. However, the rate factor continues to weigh: the Fed notes that inflation remains above its target, meaning there is limited room for policy easing.
Technically, the market is in a consolidation phase after the sharp reversal from 5,400–5,500 and the drop to 4,300–4,400. The recovery proved uneven: prices returned to the 4,600–4,800 range, but failed to consolidate above it. Bollinger Bands are narrowing, indicating lower volatility and accumulation. MACD remains in negative territory, although selling pressure is easing, while the Stochastic Oscillator signals an attempt to rise. Range: support levels are located at 4,500–4,550 and 4,300, and resistance lies at 4,800–4,900.
- Buy scenario
A consolidation above 4,800–4,900 would open the way for a more sustainable recovery.
- Sell scenario
A breakout below 4,500–4,550 would increase pressure and could return prices to 4,300.
Conclusion: the market is balanced after the sharp decline. The baseline scenario suggests consolidation with high sensitivity to geopolitics and rate expectations.
Summary
Gold (XAUUSD) is hovering near 4,700 USD per ounce after rebounding amid falling oil prices. Geopolitics remains the key driver: the market is pricing in expectations of a possible US-Iran agreement after a framework memorandum was delivered via intermediaries. This reduces inflation risks and partially supports demand for the metal. However, the rate factor continues to limit growth: the Federal Reserve emphasises that inflation is still far from the target, meaning room for policy easing is limited.
Technically, the structure has shifted into a consolidation phase after the reversal from the 5,400–5,500 highs and the drop to 4,300–4,400. Current dynamics within the 4,500–4,900 range appear to be an unstable recovery without a clear trend: moves are choppy, with pullbacks. Prices are hovering near the middle Bollinger Band, and volatility is declining. The baseline scenario is sideways movement. Without a consolidation above 4,800–4,900, risks of a return to 4,500–4,300 remain. Any move higher remains a correction within a broader bearish structure.
Editors’ picks
 EURUSD 2026-2027 forecast: key market trends and future predictions
This article provides the EURUSD forecast for 2026 and 2027 and highlights the main factors determining the direction of the pair’s movements. We will apply technical analysis, take into account the opinions of leading experts, large banks, and financial institutions, and study AI-based forecasts. This comprehensive insight into EURUSD predictions should help investors and traders make informed decisions.
 Gold (XAUUSD) forecast 2026 and beyond: expert insights, price predictions, and analysis
Dive deep into the Gold (XAUUSD) price outlook for 2026 and beyond, combining technical analysis, expert forecasts, and key macroeconomic factors. It explains the drivers behind gold’s recent surge, explores potential scenarios including a move toward 4,500 to 5,000 USD per ounce, and highlights why the metal remains a strong hedge during global uncertainty.
Forecasts presented in this section only reflect the author’s private opinion and should not be considered as guidance for trading. RoboForex bears no responsibility for trading results based on trading recommendations described in these analytical reviews.