Gold (XAUUSD) weekly price forecast: the precious metal is coming under pressure
Gold (XAUUSD) enters the week of 1–5 June near 4,370 USD per ounce, under pressure amid uncertainty around US-Iran talks. The market is focusing on the risks of persistently high inflation and a prolonged period of tight policy by major central banks. Key disagreements between the parties remain: Tehran insists on control over the Strait of Hormuz and maintaining its nuclear program. Gold is also pressured by a strong dollar, rising US yields, and the Fed’s hawkish rhetoric.
The baseline scenario for the week suggests continued high volatility and broad consolidation with a moderately negative bias. As long as XAUUSD holds above 4,370–4,400, the market retains the potential for stabilisation and local attempts to recover towards 4,520–4,660. A loss of support will increase pressure on gold and raise the risk of a continued decline towards 4,100.
XAUUSD forecast for this week: quick overview
- Weekly performance: the market continues to assess the risks of persistently high inflation and a prolonged period of tight policy by major central banks. Key disagreements between the parties remain: Tehran insists on maintaining control over the Strait of Hormuz and its nuclear program, while the US refuses to ease sanctions without a full-fledged agreement
- Support and resistance: on the daily chart, gold remains under strong pressure after a major correction from the highs around 5,500. Quotes are gradually moving towards the 4,370–4,400 support zone. Recovery attempts are still limited, and each rebound meets selling pressure in the 4,520–4,660 area. The nearest support level is located at 4,370 and 4,100, with resistance around 4,520–4,660
- Fundamentals and outlook: the baseline scenario suggests continued high volatility and cautious consolidation with a moderately negative tilt. The Federal Reserve’s hawkish rhetoric, a strong dollar, and rising US yields continue to limit the recovery potential for gold. Additional pressure comes from concerns about persistently high energy prices and prolonged inflation pressure. Further XAUUSD movements will depend on US-Iran talks, the situation around the Strait of Hormuz, and Fed rate expectations
Gold (XAUUSD) fundamental analysis
Gold (XAUUSD) ended the week near 4,373 USD per troy ounce, weighed down by uncertainty surrounding the US-Iran talks. The market continued to assess risks to inflation and prospects for a prolonged period of high interest rates in the global economy. Despite diplomatic contacts, key disagreements between the parties remain unresolved. Tehran insists on maintaining control over the Strait of Hormuz and its nuclear program.
Additional pressure on the market comes from harsh US rhetoric. Donald Trump reiterated that Washington will not agree to a “bad deal” and is not ready to ease sanctions against Iran, despite Tehran’s demands for financial relief and an end to attacks. Against this backdrop, the market still prices in risks of persistently elevated energy prices and a longer period of tight policy by major central banks.
Technically, gold remains in a downward phase following a major correction from its highs. The baseline scenario for next week suggests continued high volatility and cautious consolidation with a moderately negative bias.
XAUUSD technical analysis
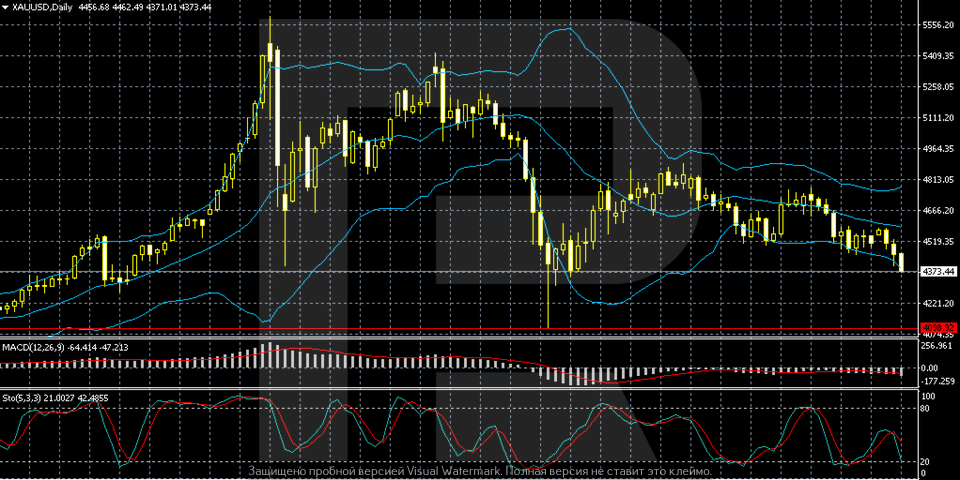
Gold (XAUUSD) remains under strong pressure on the daily chart after a major correction from the all-time highs around 5,500. Following a strong uptrend, the market faced profit-taking and a downward reversal amid a stronger dollar, rising US yields, and expectations of tighter Federal Reserve policy. In recent weeks, quotes have been gradually shifting towards the 4,370–4,400 area, where a crucial support zone is now located.
Gold is currently trading near the lower Bollinger Band, indicating continued bearish momentum and elevated volatility. Local recovery attempts remain limited, with each rebound quickly encountering selling pressure in the 4,520–4,660 area. Recent candlesticks form a steady downward structure with a series of lower highs, and the market does not yet show signs of a full-fledged upward reversal.
The technical picture remains negative. MACD holds deep in negative territory and continues to indicate seller dominance, although the pace of decline is gradually slowing. The Stochastic Oscillator is turning down after a short-term recovery and is approaching oversold territory, signalling continued pressure on the market. The nearest support is located around 4,370–4,100, while resistance levels lie around 4,520–4,660. As long as gold remains below 4,660, the risks of further decline persist.
XAUUSD trading scenarios
The fundamental backdrop for gold (XAUUSD) remains negative. The market is assessing the risks of persistently high inflation and a prolonged period of tight policy by major central banks amid uncertainty around US-Iran talks. Despite diplomatic contacts, key disagreements between the parties remain: Tehran insists on control over the Strait of Hormuz and maintaining its nuclear program. Harsh US rhetoric and expectations that the Federal Reserve will maintain high interest rates are adding to pressure on gold. This supports the dollar and US Treasury yields.
Technically, gold remains in a downward phase following a major correction from the highs around 5,500. After the strong sell-off, quotes are gradually moving towards the 4,370–4,400 area, where an important support zone is now located. Prices are hovering near the lower Bollinger Band, indicating continued bearish momentum and elevated volatility. Local recovery attempts remain limited: each rebound quickly meets selling pressure in the 4,520–4,660 area. The nearest support levels are located at 4,370 and 4,100.
- Buy scenario
A consolidation above 4,520–4,660 would be the first signal of stabilisation, opening the way for a deeper correction towards 4,810.
- Sell scenario
A breakout below the 4,370 support level would increase pressure on gold and raise the risk of a decline towards 4,100.
Conclusion: gold (XAUUSD) remains under pressure and maintains a moderately negative technical signal.
Summary
Gold (XAUUSD) is hovering around 4,370 USD per ounce, under pressure from uncertainty surrounding US-Iran talks. The market continues to assess the risks of persistently high inflation and a prolonged period of tight policy by major central banks. Additional pressure on gold comes from tough US rhetoric and expectations that the Federal Reserve will maintain high interest rates.
Technically, XAUUSD remains in a bearish phase following a major correction from the highs around 5,500 and a gradual decline towards 4,370–4,400. The market is currently testing a key support zone near the lower Bollinger Band, with recovery attempts being limited. The baseline scenario suggests continued high volatility and cautious consolidation with a moderately negative tilt. As long as quotes hold below 4,520–4,660, the risk of a continued decline towards 4,370–4,100 remains.
Editors’ picks
 EURUSD 2026-2027 forecast: key market trends and future predictions
This article provides the EURUSD forecast for 2026 and 2027 and highlights the main factors determining the direction of the pair’s movements. We will apply technical analysis, take into account the opinions of leading experts, large banks, and financial institutions, and study AI-based forecasts. This comprehensive insight into EURUSD predictions should help investors and traders make informed decisions.
 Gold (XAUUSD) forecast 2026 and beyond: expert insights, price predictions, and analysis
Dive deep into the Gold (XAUUSD) price outlook for 2026 and beyond, combining technical analysis, expert forecasts, and key macroeconomic factors. It explains the drivers behind gold’s recent surge, explores potential scenarios including a move toward 4,500 to 5,000 USD per ounce, and highlights why the metal remains a strong hedge during global uncertainty.
Forecasts presented in this section only reflect the author’s private opinion and should not be considered as guidance for trading. RoboForex bears no responsibility for trading results based on trading recommendations described in these analytical reviews.