
Gold (XAUUSD) weekly forecast: bears gain more potential
Gold is ending the week near 4,300 USD per ounce and may record its third consecutive weekly decline. Rising US Treasury yields and renewed expectations of a Federal Reserve rate hike have increased pressure on the metal.
The coming week will be dominated by the US central bank meeting, making the 4,300 level key to future moves in XAUUSD.
XAUUSD forecast for this week: quick overview
- Market focus: the Federal Reserve meeting will be the key event for gold in the week of 14–18 September. Following an acceleration in producer inflation, the market raised the probability of a 25-basis-point rate hike to around 71%, up from 61% before the PPI release. For XAUUSD, it is crucial whether the Fed confirms the need for further policy tightening. A rate hike combined with hawkish rhetoric could support bond yields and add to pressure on gold. A more cautious signal regarding the next steps, by contrast, could trigger a recovery in the metal after three weeks of declines
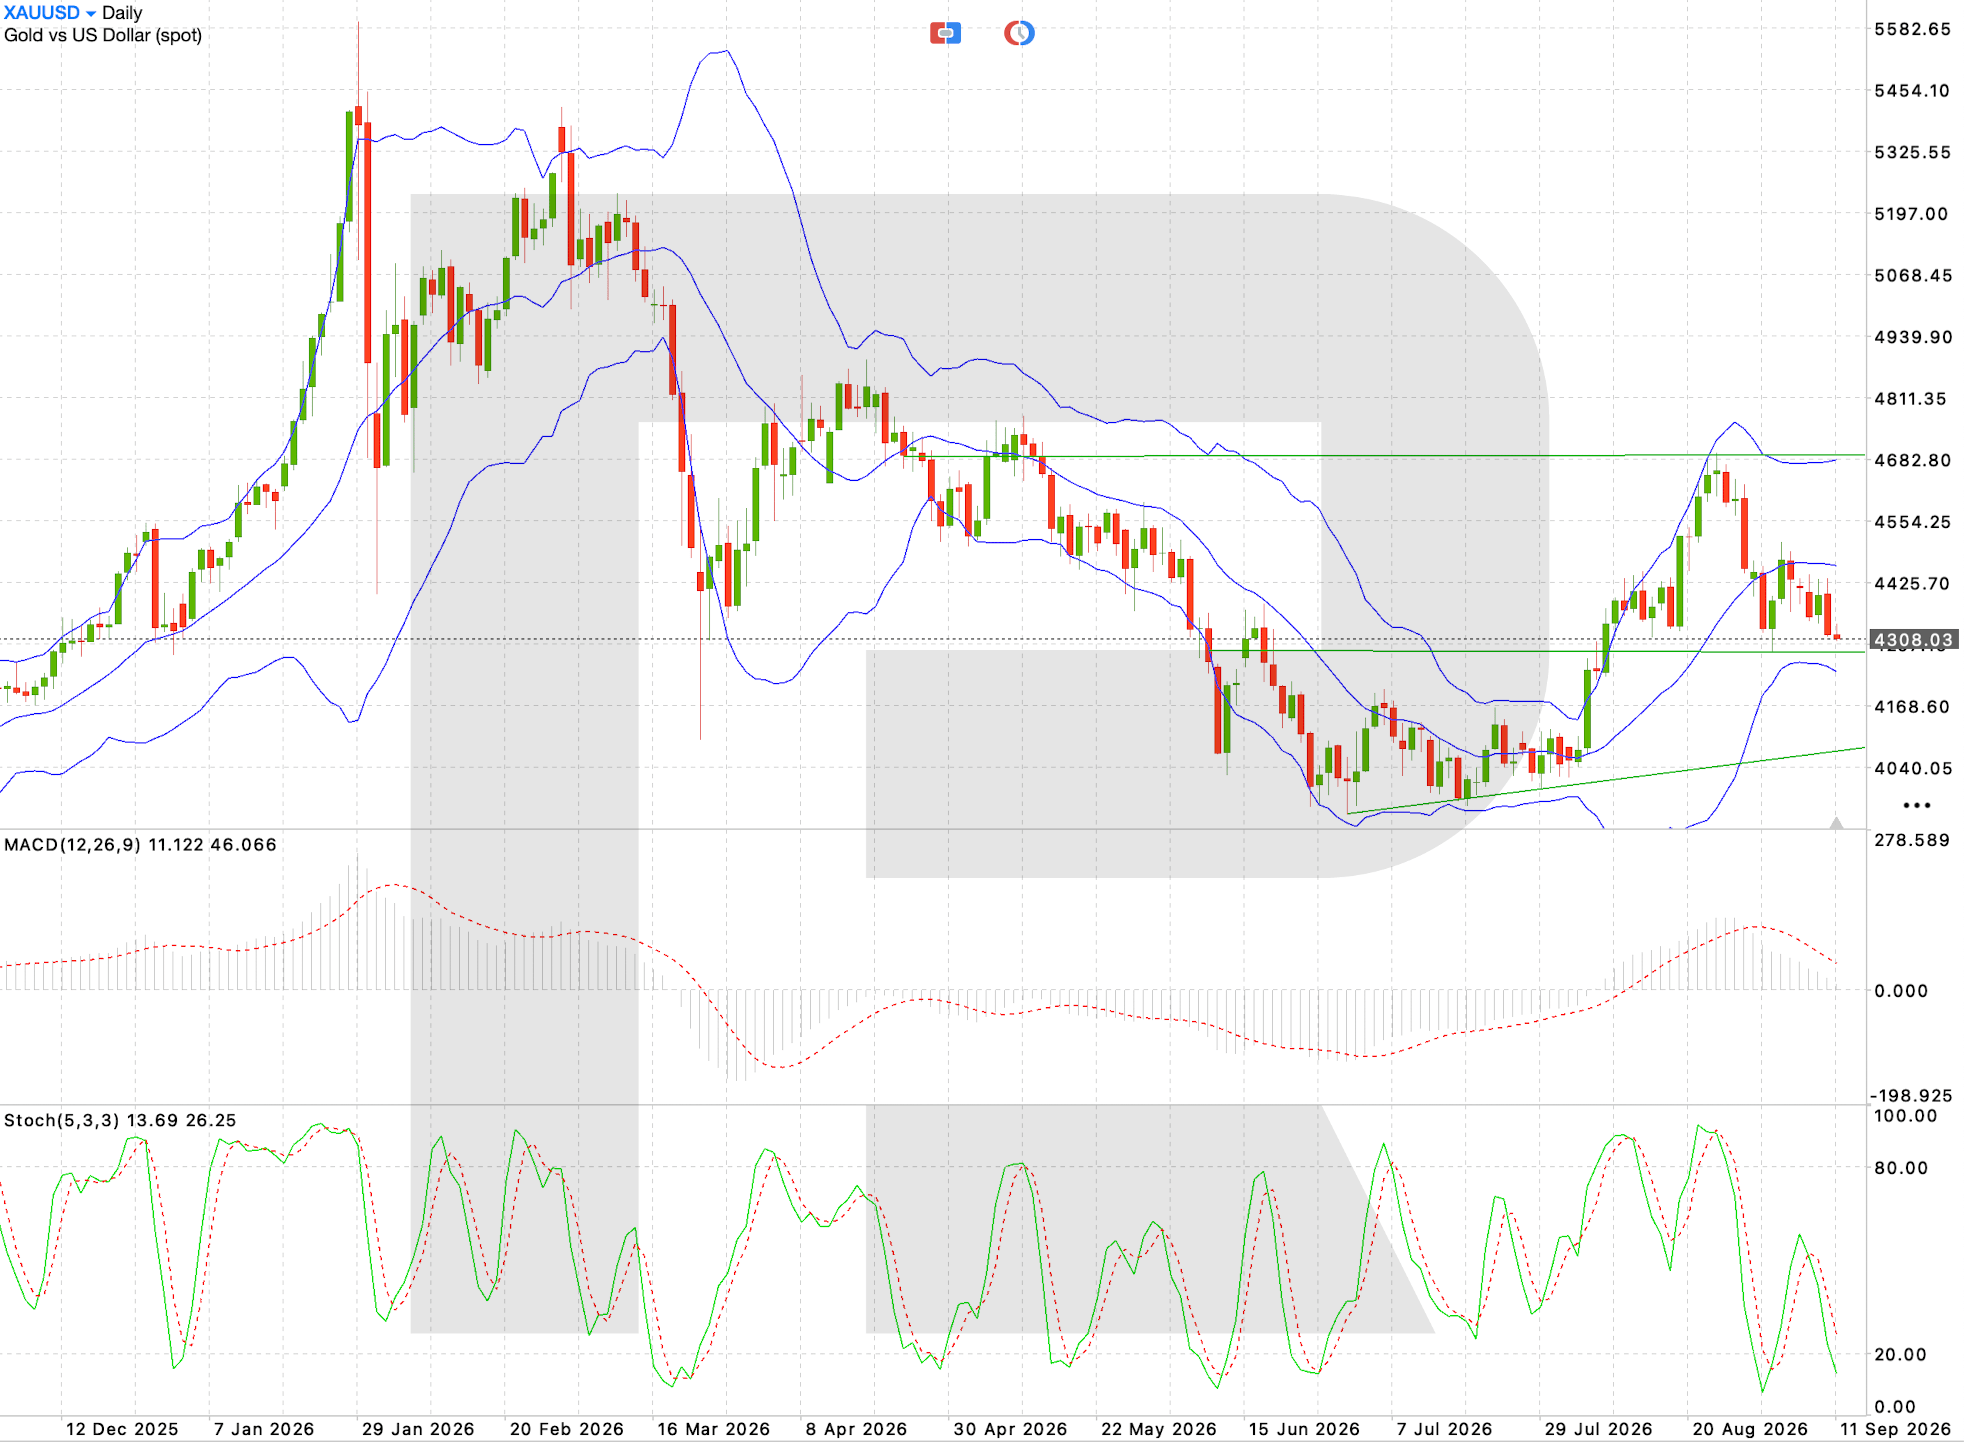
- Current trend: on the daily chart, gold continues to decline after failing to consolidate around 4,680. Prices have fallen below the middle Bollinger Band and are testing the 4,300 level towards the end of the week. MACD remains above zero but is rapidly losing bullish momentum. The Stochastic Oscillator has moved into oversold territory, suggesting a local technical rebound, although it does not yet signal the end of the downward move
- Fundamentals and outlook: the baseline scenario suggests continued pressure on gold while prices remain below the 4,425–4,450 area. The 4,300 support level is becoming the key mark: a firm breakout below it would allow sellers to extend the move towards 4,168. To change the short-term picture, XAUUSD needs to recover above 4,425. The technical backdrop would improve more significantly only with a recovery towards 4,554
Gold (XAUUSD) fundamental analysis
The fundamental backdrop for gold deteriorated following an unexpected acceleration in US producer inflation. The rise in the PPI in August fuelled concerns that higher energy costs amid the conflict with Iran are continuing to filter through the US economy, complicating the Federal Reserve’s task of stabilising prices.
At the same time, US Treasury yields rose. They received an additional boost from weak investor participation in the US Treasury’s first expanded bond buyback operation. Higher yields are particularly unfavourable for gold, as they increase the opportunity cost of holding a non-yielding asset.
Oil remains another significant factor. The escalation of the conflict between the US and Iran is supporting oil prices and increasing inflation risks. Under normal conditions, geopolitical tensions tend to support demand for gold as a safe-haven asset, but the inflation channel is currently exerting an opposite effect: high oil prices increase the likelihood of a more hawkish Federal Reserve policy.
Gold therefore approaches the Federal Reserve meeting from a vulnerable position. To restore sustained demand for the metal, the market will need either softer rate expectations or a significant decline in US Treasury yields.
XAUUSD technical analysis
On the daily chart, the August recovery ended near the 4,683 resistance level, after which a sequence of lower highs formed. Prices have fallen towards the key horizontal area around 4,300 and are trading below the middle Bollinger Band.
The nearest resistance is located around 4,425–4,450, followed by 4,554 and the key barrier at 4,683. A downside breakout below 4,300 would open the way towards 4,168, with the next significant support level at 4,040, where the ascending trendline from the July lows is located.
MACD remains positive, but the contracting histogram and the declining signal line confirm a weakening of the previous bullish momentum. The Stochastic Oscillator is near oversold territory, so a short-term rebound is possible, but by itself this would not change the established corrective structure.
The technical advantage at the start of the week remains with sellers unless XAUUSD climbs above 4,425.
XAUUSD trading scenario
The key support level at 4,300 is containing further declines, so selling directly within this area is risky. A trading signal will appear only after a confirmed breakout below this level.
Sell scenario
A breakout below 4,300 USD would confirm a continued correction and open the way towards the next technical support.
- Entry level: sell stop 4,295
- Take profit: 4,168
- Stop loss: 4,360
- Risk-to-reward ratio: approximately 1:2.0
The trade idea is valid until 8:00 AM on 18 September 2026 (server time, UTC+3).
If XAUUSD holds above 4,300, the trade idea will not be activated.
Summary
Gold enters the new week under pressure following three consecutive weekly declines, with the technical structure remaining vulnerable around 4,300. Oversold conditions suggest a local rebound, but there is still no confirmation of a reversal.
The gold (XAUUSD) forecast for 14–18 September suggests a continued bearish bias if prices break below the 4,300 level, with the potential for a move towards 4,168.
Editors’ picks
 EURUSD forecast 2026–2027: technical analysis, price levels & predictions
EURUSD has recovered from the July lows and is trading near 1.1545 — back in bullish territory. The pair has reclaimed EMA65 on the daily, formed a bullish EMA crossover on H4, and the US-eurozone GDP gap has narrowed sharply (US 1.5% vs eurozone 1.0%). Goldman Sachs and Deutsche Bank both now target 1.2500 by year-end. A confirmed close above 1.1700 opens the path to 1.1805. We break down the key levels, three trading scenarios, and what the unprecedented 9-3 FOMC dissent vote means for EURUSD.
 Gold (XAUUSD) forecast 2026: technical analysis, price levels & predictions
Gold has reversed its downtrend and is trading near 4,360 USD, back above both EMA65 and EMA200. ETF flows turned positive in July with 3 billion USD of net inflows, and central banks bought 288.9 tonnes in Q2 — up 62% year-on-year. A breakout above 4,500 USD opens the path to 4,855 USD and the 5,597 USD all-time high. We break down the key levels, three trading scenarios with entry triggers, and what J.P. Morgan, Deutsche Bank and Goldman Sachs are forecasting for gold in 2026.
Forecasts presented in this section only reflect the author’s private opinion and should not be considered as guidance for trading. RoboForex bears no responsibility for trading results based on trading recommendations described in these analytical reviews.