
Bitcoin (BTCUSD) comes back to life: what happens next
The Bitcoin (BTCUSD) price rose to 63,421 USD. Buyers remain resilient, but renewed capital inflows would make their task easier. Discover more in our analysis for 17 August 2026.
BTCUSD forecast: key takeaways
- Bitcoin (BTCUSD) is rising at the start of the week, but geopolitical risks and the FOMC minutes remain in focus
- Bulls need capital inflows into ETFs to resume
- BTCUSD forecast for 17 August 2026: 63,520
Fundamental analysis
The Bitcoin price is rising to 63,421 USD on Monday. The fundamental backdrop for BTCUSD remains mixed. Earlier, soft US inflation data and a decline in the probability of a Federal Reserve rate hike in September to around 33% supported risk assets. A weaker US dollar remains an additional positive factor.
Geopolitics continues to weigh on the cryptocurrency market through energy prices. Negotiations over the Strait of Hormuz remain deadlocked, while rising Brent prices increase the risk that energy inflation could become a more persistent factor. New attacks on oil infrastructure and low US strategic reserve levels make markets more sensitive to any renewed escalation.
The institutional backdrop is also mixed. Sales by MARA and Strategy totalling 24,690 BTC were absorbed by the market without a sharp decline thanks to OTC transactions and ETF flows, indicating underlying demand. However, by the end of last week, spot BTC ETFs were once again facing outflows, while MSCI’s proposal to exclude Strategy and Metaplanet from global indices added a new potential source of pressure.
This week, the main event will be the minutes of the July FOMC meeting. More hawkish signals could strengthen the dollar and restore pressure on BTC, while an emphasis on slowing inflation and a cooling economy would support risk appetite. Overall, the fundamental picture remains moderately positive for buyers. However, without a sustained return of ETF inflows and lower geopolitical risks, BTC’s upside potential will remain limited.
The Bitcoin (BTCUSD) forecast is moderate.
Technical outlook
On the H1 chart, Bitcoin (BTCUSD) has formed a strong upward momentum after rebounding from the 62,500–62,700 zone and is trading around 63,422. The price has confidently moved back above the middle Bollinger Band and approached the indicator’s upper boundary. Buyers briefly gained the upper hand, although the market has already reached a local resistance area.
The nearest resistance is located in the 63,520–63,740 zone. Consolidation above it would open the way towards 63,970 and then 64,180. The first support level lies at 63,300, followed by 63,080 and 62,860. As long as BTC remains above 63,080–63,300, the current rise retains its strength.
MACD has turned upwards and is gaining positive momentum, confirming the return of buyers. The Stochastic Oscillator has risen above 80 and is in overbought territory, so a pause or local pullback may follow the sharp rise. The baseline scenario remains movement within the 63,080–63,520 range with a moderately positive bias.
BTCUSD overview
- Asset: BTCUSD
- Timeframe: H1 (intraday)
- Trend: bullish
- Key resistance levels: 63,740 and 64,180
- Key support levels: 63,300 and 63,080
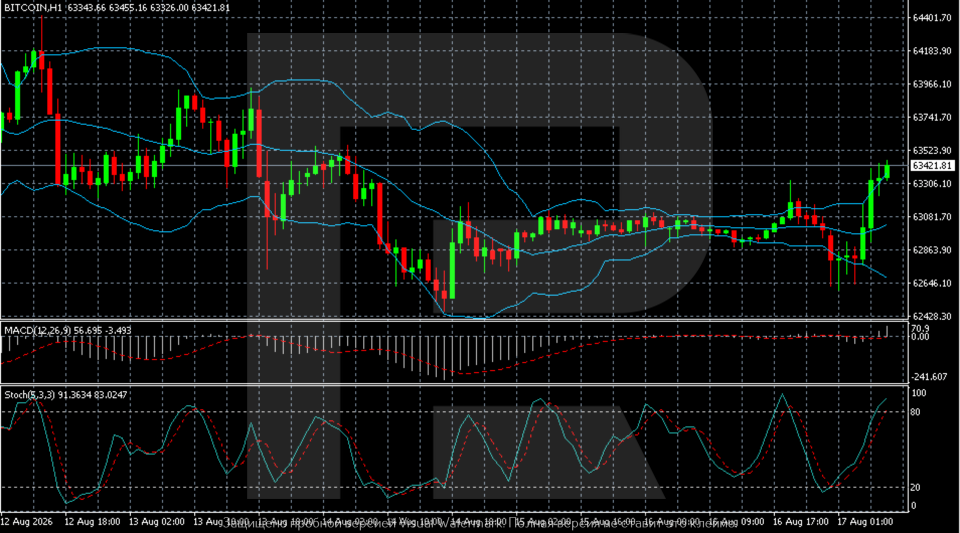
Bitcoin trading scenarios for today
Main scenario (Buy Stop)
A breakout and consolidation above the 63,740 USD resistance level would confirm continued upward momentum in BTCUSD and create conditions for a move towards the next target.
- Take Profit: 64,180
- Stop Loss: 63,450
Alternative scenario (Sell Stop)
A breakout and consolidation below the 63,080 USD support level would indicate weakening buying pressure and a correction towards the next support zone.
- Take Profit: 62,860
- Stop Loss: 63,300
Risk factors
The main risk to the bullish BTCUSD scenario remains overbought conditions after the sharp recovery and buyers’ failure to consolidate above the 63,520–63,740 zone. Additional pressure could emerge from hawkish signals in the FOMC minutes, a stronger dollar, or another rise in oil prices. Meanwhile, a mild inflation backdrop and renewed inflows into spot BTC ETFs could support further Bitcoin gains.
Summary
The Bitcoin price is rising at the start of the week, but the outlook for further gains remains limited. The BTCUSD forecast for today, 17 August 2026, suggests a continued upward move towards 63,520.
Editors’ picks
 EURUSD forecast 2026–2027: technical analysis, price levels & predictions
EURUSD has pulled back from the 2026 high of 1.1915 and is now trading near 1.1450 — below both EMA65 and EMA200 — with the active scenario shifting from bullish to bearish. The ECB raised rates to 2.40%, but the Fed holds at 3.75%, and US inflation (3.5%) continues to outpace the eurozone (2.8%). A confirmed break below 1.1280 opens the next downward wave toward 1.1080. We break down the key levels, three trading scenarios with entry triggers, and what Deutsche Bank, Morgan Stanley and UBS are forecasting for EURUSD in 2026.
 Gold (XAUUSD) forecast 2026: predictions based on fundamental and technical analysis
Gold has corrected over 25% from its all-time high of 5,597 USD and is now trading near 4,100 USD — testing a critical support zone. Is this the bottom, or will the downtrend continue? We break down the key levels (support 3,920 USD, breakout trigger 4,500 USD), three trading scenarios with entry levels, and what J.P. Morgan, Goldman Sachs and Deutsche Bank are forecasting for gold in 2026.
Forecasts presented in this section only reflect the author’s private opinion and should not be considered as guidance for trading. RoboForex bears no responsibility for trading results based on trading recommendations described in these analytical reviews.