
BTCUSD approaches a key resistance zone after a strong Q3 recovery
The BTCUSD price is attempting to break above the 88,000 level, with the price currently standing at 86,204. Find more details in our analysis for 5 October 2026.
BTCUSD forecast: key takeaways
- The yield on 30-year US Treasury bonds rose to 5.44%, the highest level since 2004
- Institutional capital inflows for the week ending 26 September amounted to around 2.5 billion USD
- BTCUSD forecast for 5 October 2026: 92,145
Fundamental analysis
The main positive factor for Bitcoin at present remains the substantial inflow of institutional capital through US spot ETFs. In the week ending 26 September, US spot Bitcoin ETFs attracted around 2.4 billion USD in net capital inflows, marking one of the strongest results of 2026. A nine-day inflow streak brought the funds around 3 billion USD and pushed cumulative year-to-date flows back into positive territory. However, this streak ended on 1 October with an outflow of approximately 149 million USD. Consequently, while ETFs continue to provide fundamental support for BTC, the nature of demand is becoming less clear-cut.
The main factor for Bitcoin in the coming weeks remains US Federal Reserve monetary policy. In September, the Fed raised the interest rate to the 3.75–4.00% range, but the latest labour market data was noticeably weaker than expected: the US economy added only around 29 thousand jobs in September, while unemployment rose to 4.2%. Against this backdrop, the probability of another rate hike at the 27–28 October meeting has fallen significantly.
At the same time, the US debt market remains a major constraint on BTC growth. The yield on 10-year Treasury bonds is around 5.28%, while the DXY dollar index is near 101.7. At the beginning of September, the 10-year yield was around 4.8%, while DXY stood near 98.8. Thus, financial conditions have tightened noticeably over the past several weeks.
Technical outlook
BTCUSD quotes continue to move within an uptrend. The nearest resistance level has formed around 87,435 USD, while a key support level is located at 80,040 USD. The price is currently completing a corrective move from the resistance zone, after which growth may resume. If the situation develops less dynamically, a sideways range may form before a new bullish impulse.
If growth continues, the next target could be 92,145 USD.
At the same time, an alternative scenario remains possible. A breakout and consolidation below the 80,040 USD support level would indicate increased selling pressure and raise the likelihood of a continued downward correction.
BTCUSD overview
- Asset: BTCUSD
- Timeframe: D1
- Trend: bullish
- Key resistance levels: 87,435
- Key support levels: 80,040
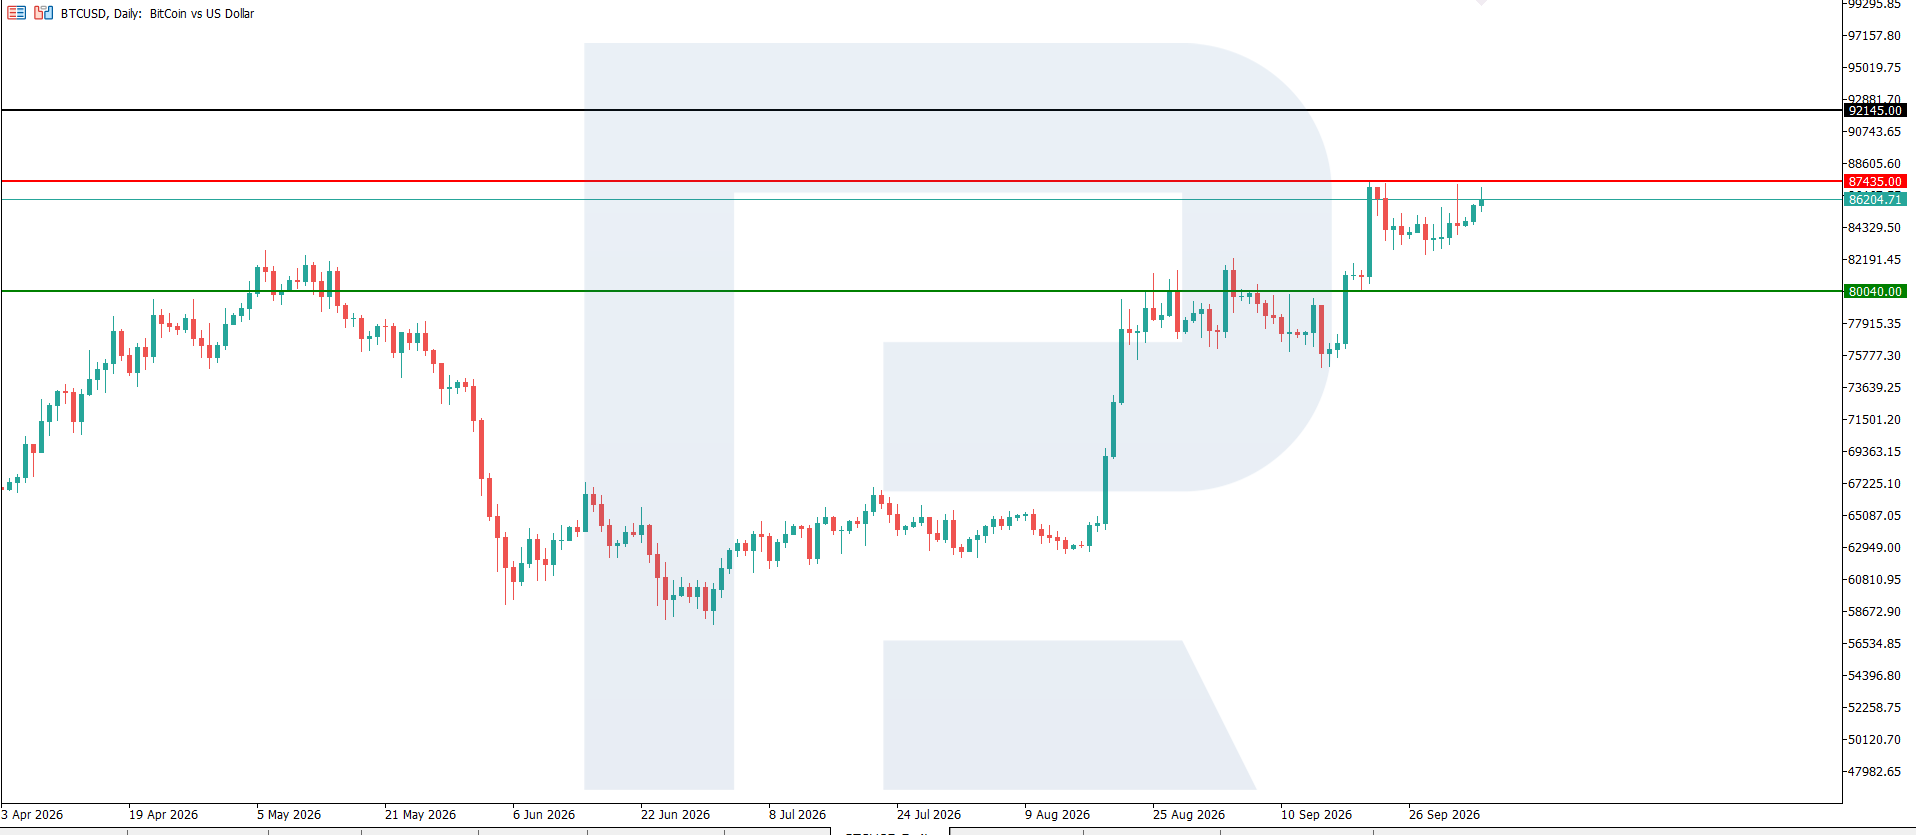
Bitcoin trading scenario for today
Trading scenario (Buy Stop)
A breakout above the resistance level, with the price consolidating above 87,435 USD, would strengthen bullish pressure and create conditions for opening long positions in BTCUSD.
- Current price: 86,204
- Entry level: 87,485
- Stop loss: 86,555
- Take profit: 92,145
- Risk-to-reward ratio: more than 1:5
The trade idea is valid until 8:00 AM on 10 October 2026 (server time, UTC+3).
Risk factors
The main risk factors for BTCUSD include continued high volatility in the cryptocurrency market, a possible further tightening of US Federal Reserve monetary policy, rising US government bond yields, and a stronger dollar. Additional pressure on the price could come from a decline in capital inflows into spot Bitcoin ETFs or a shift towards sustained net outflows.
Summary
The fundamental backdrop is currently mixed but has a moderately positive bias. On the one hand, the market is receiving strong support from ETFs and continued demand for risk assets. On the other hand, high inflation, tight Fed policy, and elevated bond yields are limiting the upside potential.
Editors’ picks
 EURUSD forecast 2026–2027: technical analysis, price levels & predictions
The EURUSD outlook for 2026 and 2027: key levels on the daily chart, three trading scenarios and the policy gap between the Fed and the ECB that drives the pair.
 Gold (XAUUSD) forecast 2026: technical analysis, price levels & predictions
Where gold could trade in 2026: key levels, three trading scenarios with entry triggers and the forecasts from J.P. Morgan, Deutsche Bank and Goldman Sachs.
Forecasts presented in this section only reflect the author’s private opinion and should not be considered as guidance for trading. RoboForex bears no responsibility for trading results based on trading recommendations described in these analytical reviews.