
Crypto market outlook for the week of 26–30 October 2026: key levels and trading scenarios
The crypto market outlook for 26 October to 1 November covers BTCUSD, ETHUSD, XRPUSD, SOLUSD, and DOGEUSD: key levels, events, and trading scenarios. The main driver for cryptocurrencies will be the Federal Reserve meeting on 27–28 October, after which investors' attention will shift to US PCE inflation and GDP figures. Bitcoin is trading around 79,745, while major altcoins remain under selling pressure.
Key levels for the week
| Instrument | Weekly forecast | Support | Resistance | Scenario |
|---|---|---|---|---|
| BTCUSD | −5.3% | 79,300 | 83,400 | Sellfrom79,300 |
| ETHUSD | −9.0% | 2,278 | 2,455 | Sellfrom2,270 |
| XRPUSD | −8.9% | 1.2630 | 1.3600 | Sellfrom1.2600 |
| SOLUSD | −10.6% | 98.50 | 107.30 | Sellfrom98.30 |
| DOGEUSD | −8.3% | 0.0750 | 0.0842 | Sellfrom0.0758 |
Events that can move crypto this week
| Date | Event | Instruments affected |
|---|---|---|
| Tuesday, 27 October 2026 | US durable goods orders | Strong data could support the dollar and bond yields, increasing pressure on BTCUSD and ETHUSD. |
| Wednesday, 28 October 2026 | Federal Reserve interest rate decision and press conference | The week's main event for all five cryptocurrencies. Signals from the regulator on inflation and the future path of interest rates will be particularly important. |
| Thursday, 29 October 2026 | Core PCE index and preliminary US GDP for Q3 | Accelerating inflation and economic resilience could strengthen expectations of hawkish Fed policy, limiting demand for cryptocurrencies. |
| Thursday, 29 October 2026 | ECB interest rate decision | Potential movements in the euro exchange rate and the US Dollar Index could indirectly affect BTCUSD, ETHUSD, and altcoins. |
| Friday, 30 October 2026 | Bank of Japan interest rate decision | Changes in expectations for Japanese interest rates could affect global liquidity and investors' risk appetite. |
Crypto market fundamentals
The cryptocurrency market enters the final week of October under selling pressure, with Bitcoin falling below the psychological 80,000 mark, Ethereum testing the 2,300 area, and major altcoins showing weakness. Following September's recovery, digital assets have lost some of their upward momentum as investors reduce risky positions ahead of key central bank decisions.
An additional source of uncertainty is institutional capital flows. According to preliminary data for 19–23 October, US spot Bitcoin ETFs attracted approximately 301 million USD, while Ethereum ETFs recorded outflows of around 221 million USD. This divergence confirms more resilient demand for Bitcoin than Ethereum, although significant daily fluctuations in flows point to investor caution.
The key event will be the Federal Reserve meeting on 27–28 October. The market's baseline scenario suggests that the rate will remain at 4.00%, so the main cryptocurrency reaction may be driven less by the decision itself than by the assessment of inflation risks and the outlook for monetary policy. Core PCE and US GDP data will follow and could adjust expectations for the December meeting.
In the coming days, BTCUSD, ETHUSD, and major altcoins will depend on the direction of the US Dollar Index, US Treasury yields, and capital flows into cryptocurrency ETFs. For now, the technical picture points to prevailing downward momentum, although oscillators approaching oversold territory set the stage for short-term recoveries.
Bitcoin price forecast: BTCUSD
On the D1 chart, BTCUSD is trading around 79,745 after declining from September highs near 87,000. The price has fallen below the middle Bollinger Band and is approaching the lower boundary of the range. The nearest support level is located at 79,300, with resistance around 83,400. MACD remains negative, confirming weakening upward momentum. The Stochastic Oscillator is in oversold territory, but no sustained reversal signals have yet formed.
A breakout below the 79,300 support level would pave the way for a continued downward correction, initially targeting the 75,500 area. If the price recovers above 83,400, buyers could regain the initiative and drive quotes towards the 87,400 resistance level.
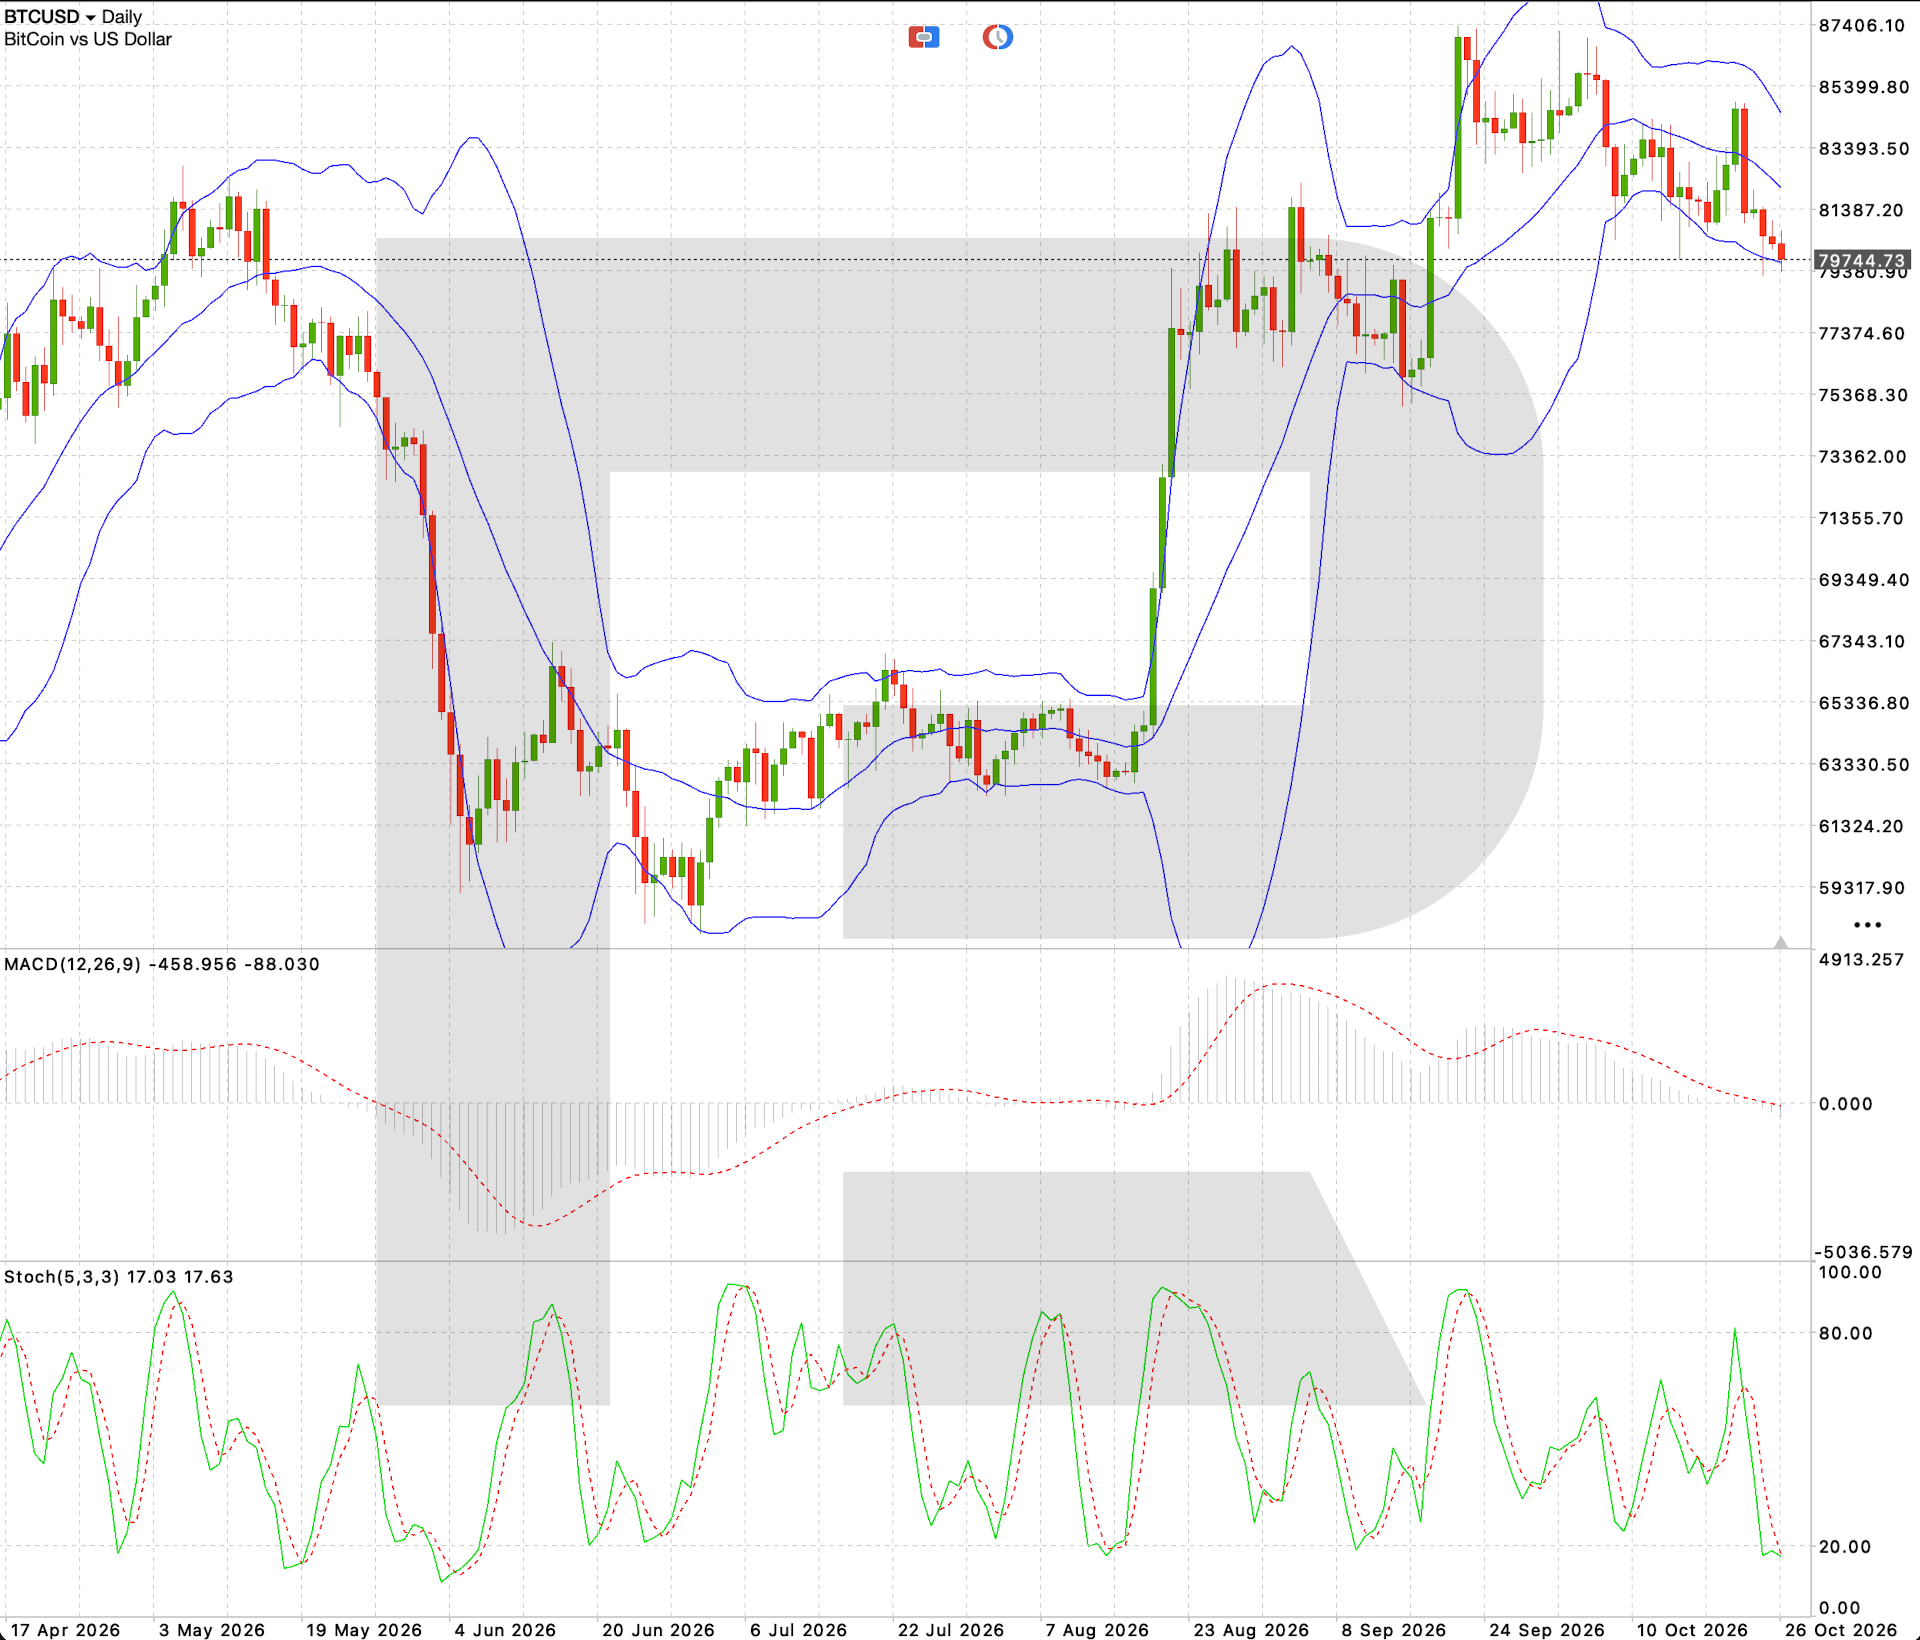
BTCUSD trading scenario
Ethereum price forecast: ETHUSD
On the D1 chart, ETHUSD has fallen to 2,307, continuing its decline after reaching a September high around 2,800. The nearest support level lies at 2,278, while resistance stands at 2,455. The price is trading below the middle Bollinger Band and is approaching the lower boundary of the range. MACD is in negative territory, while the Stochastic Oscillator has fallen towards oversold levels. The technical picture confirms sellers' advantage.
A breakout below the 2,278 support level could accelerate the decline towards 2,100. An alternative scenario suggests a recovery above resistance at 2,455, after which the price could rise to 2,630. However, the overall technical picture will remain bearish until the price consolidates above this threshold.
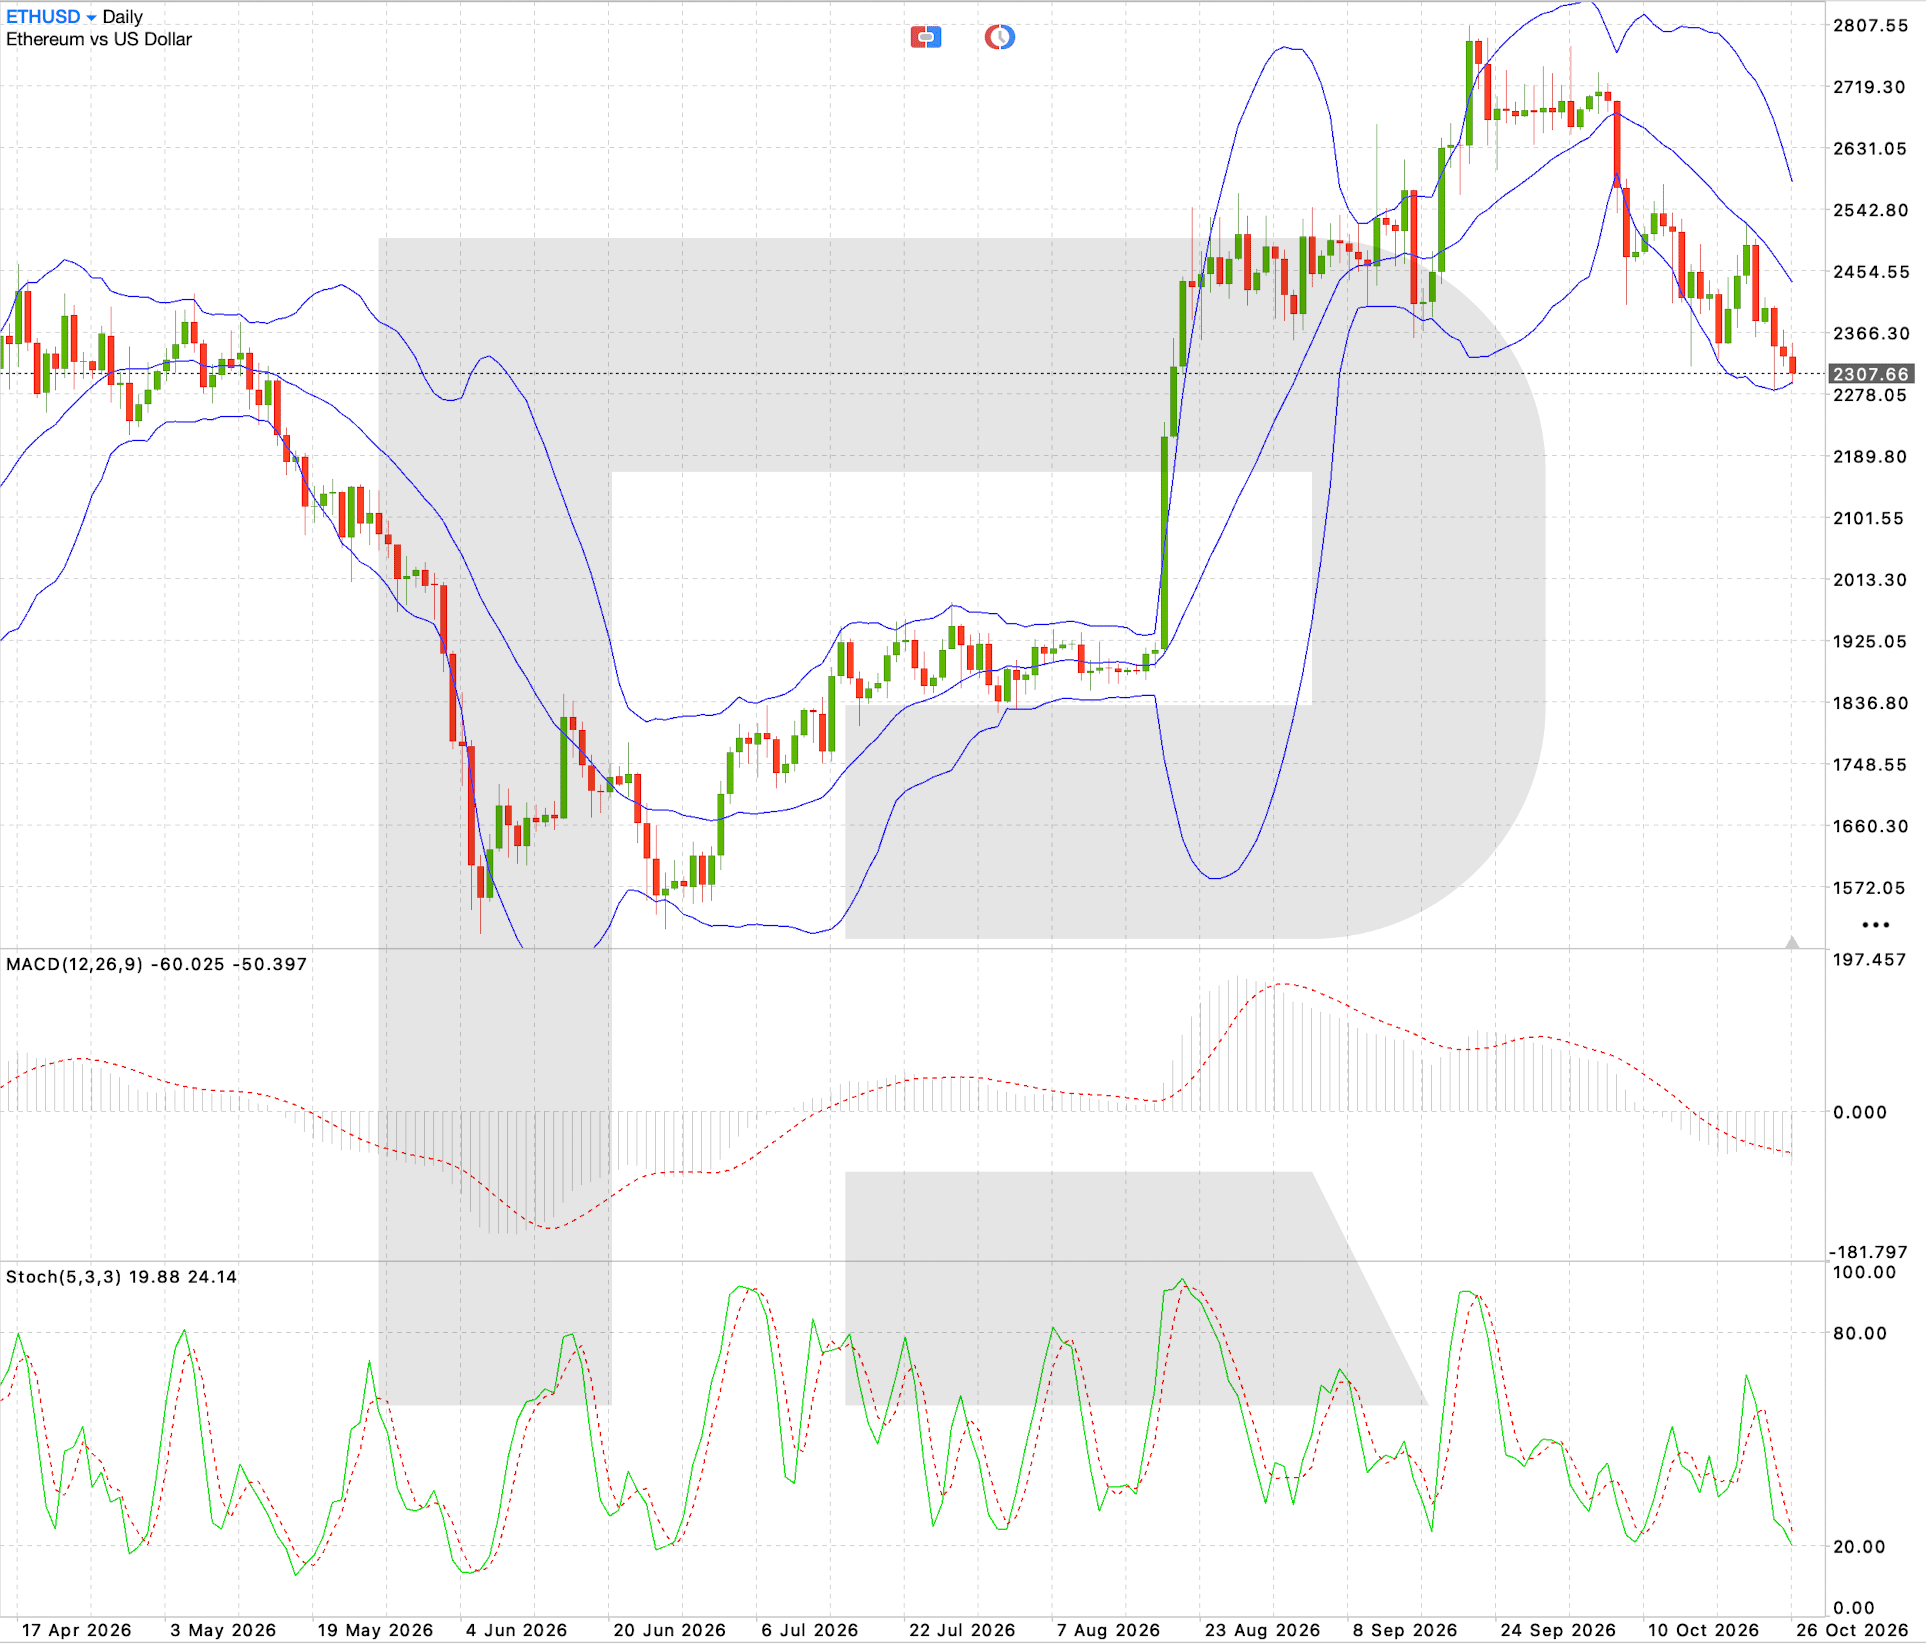
ETHUSD trading scenario
XRP price forecast: XRPUSD
On the D1 chart, XRPUSD is trading around 1.2794 after declining from September highs near 1.55. The price has settled below the middle Bollinger Band and approached the lower boundary of the range. The nearest support is located at 1.2630, with resistance around 1.3600. MACD is in negative territory, while the Stochastic Oscillator indicates weakening buying activity.
A breakout below the 1.2630 support level would strengthen downward momentum and open the way for a decline towards 1.1650. A deeper correction could take the price to the 1.1175 area. An alternative scenario suggests a return above 1.3600, setting the stage for a recovery towards 1.4570. Sellers hold the upper hand until the price overcomes this resistance level.
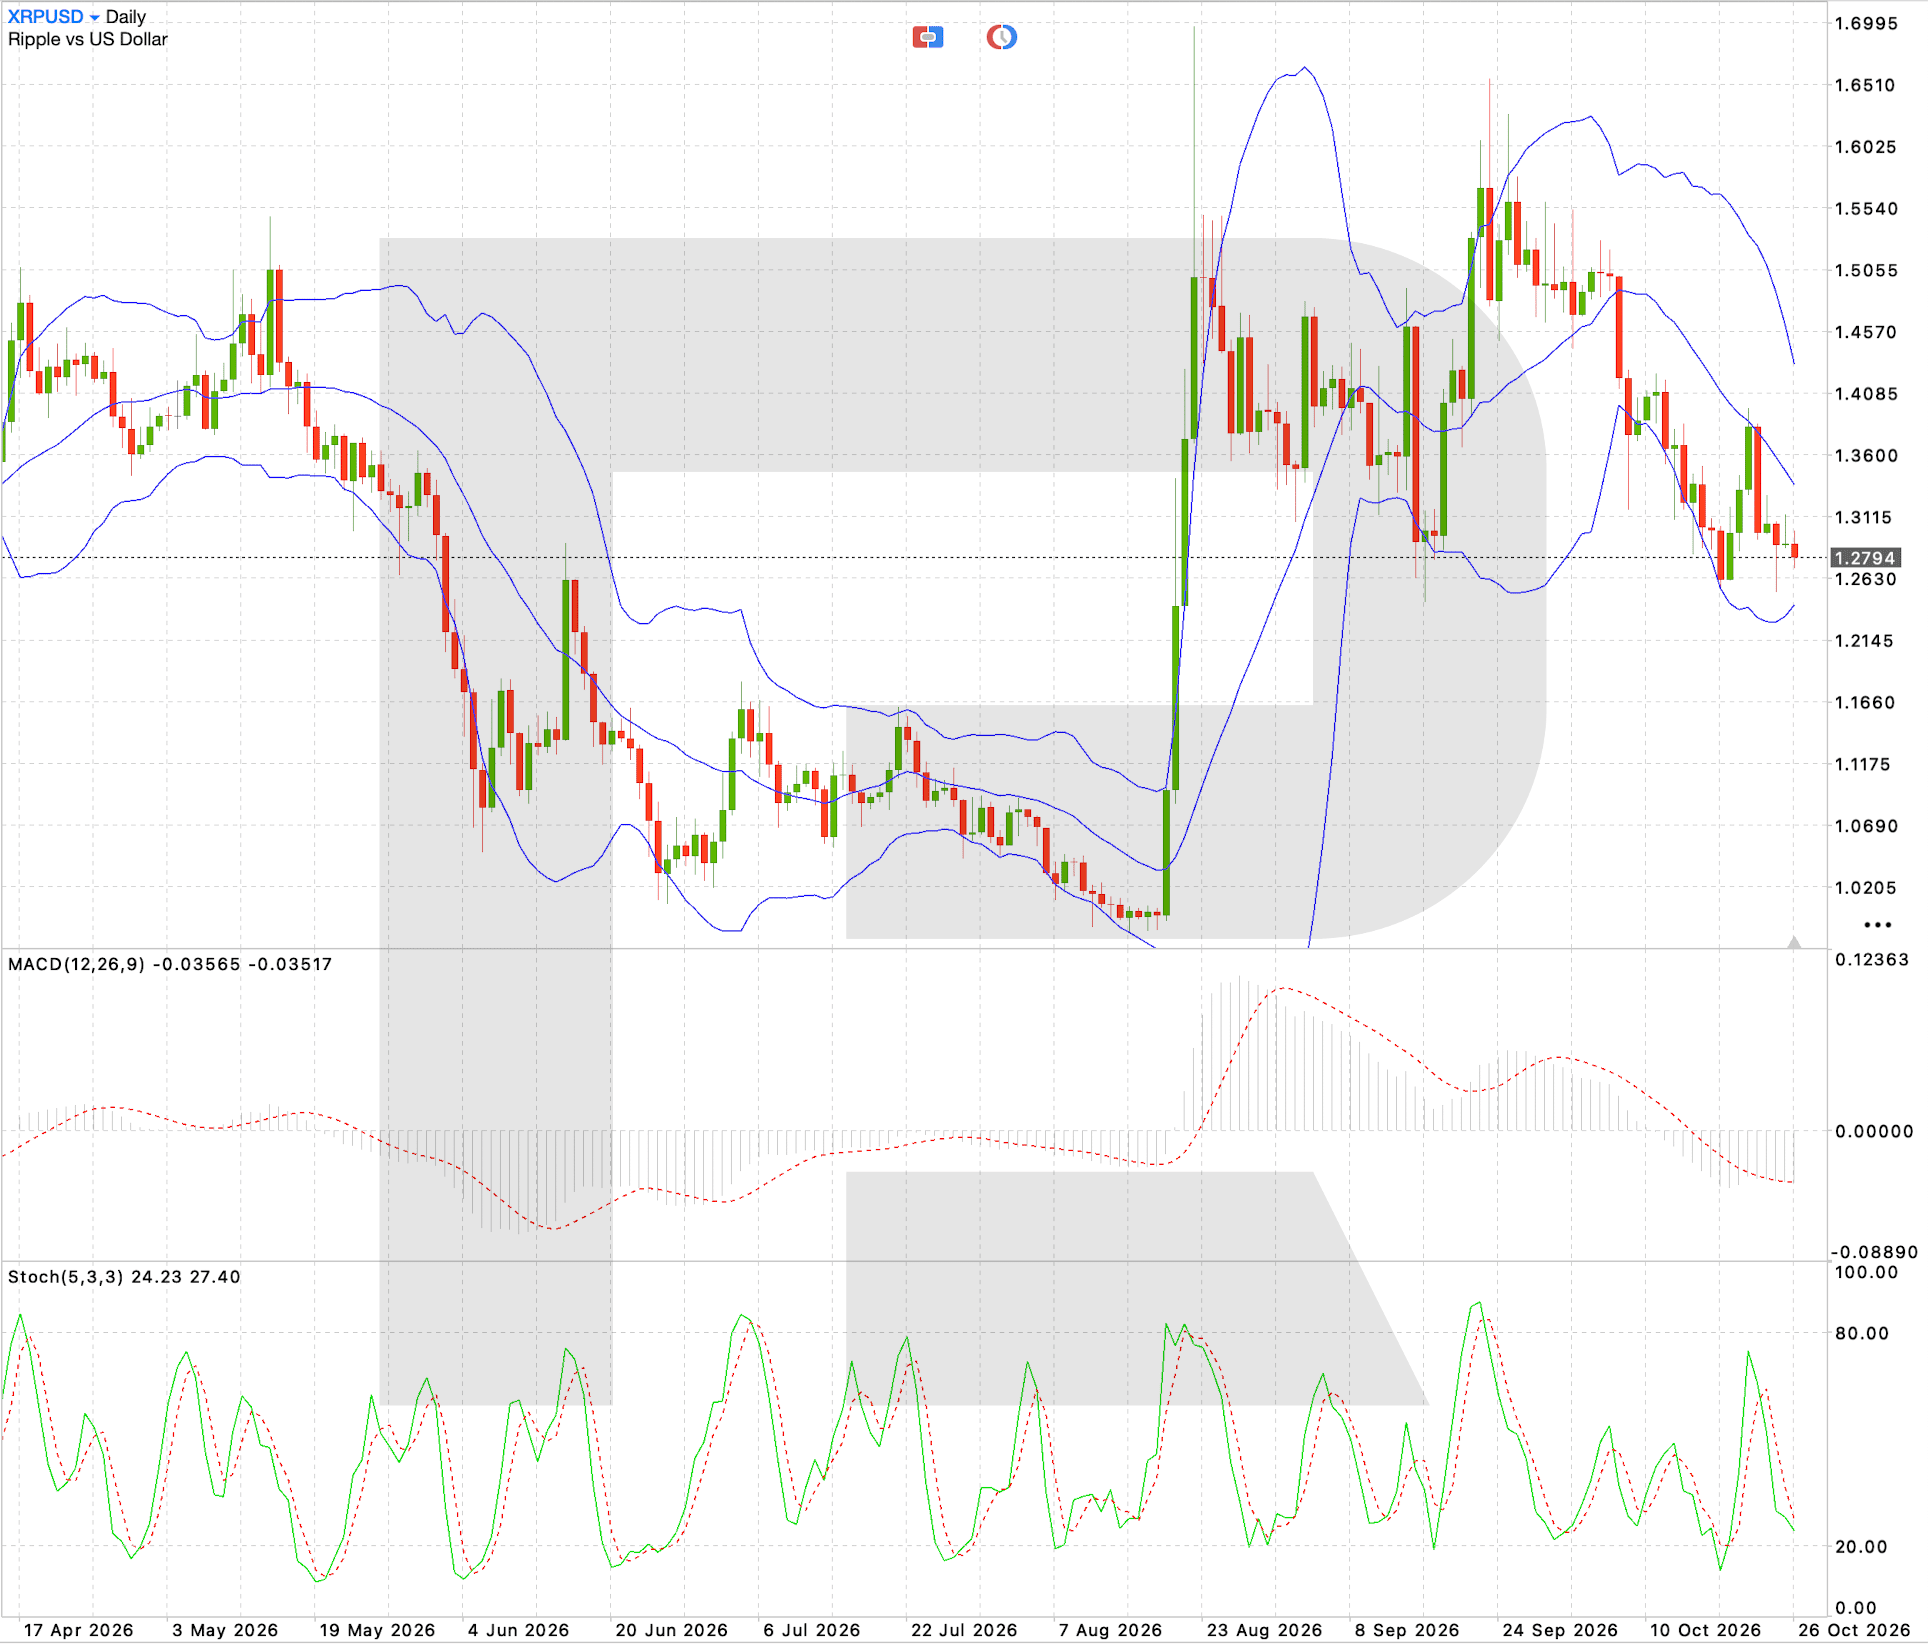
XRPUSD trading scenario
Solana price forecast: SOLUSD
On the D1 chart, SOLUSD is trading around 100.32 after declining from September highs above 120.00. The price has fallen below the middle Bollinger Band and is approaching the lower boundary of the range. The support level has formed at 98.50, with resistance at 107.30. MACD has moved into negative territory, confirming developing downward momentum. The Stochastic Oscillator is near oversold territory, suggesting a short-term technical rebound.
A breakout below the 98.50 support level would signal a continued correction towards 89.70. If sellers retain the initiative, the next area of interest could be 85.30. A recovery above the 107.30 resistance level would open the way for a rise to 116.10, although a sustained trend reversal would require the price to return above the middle Bollinger Band.
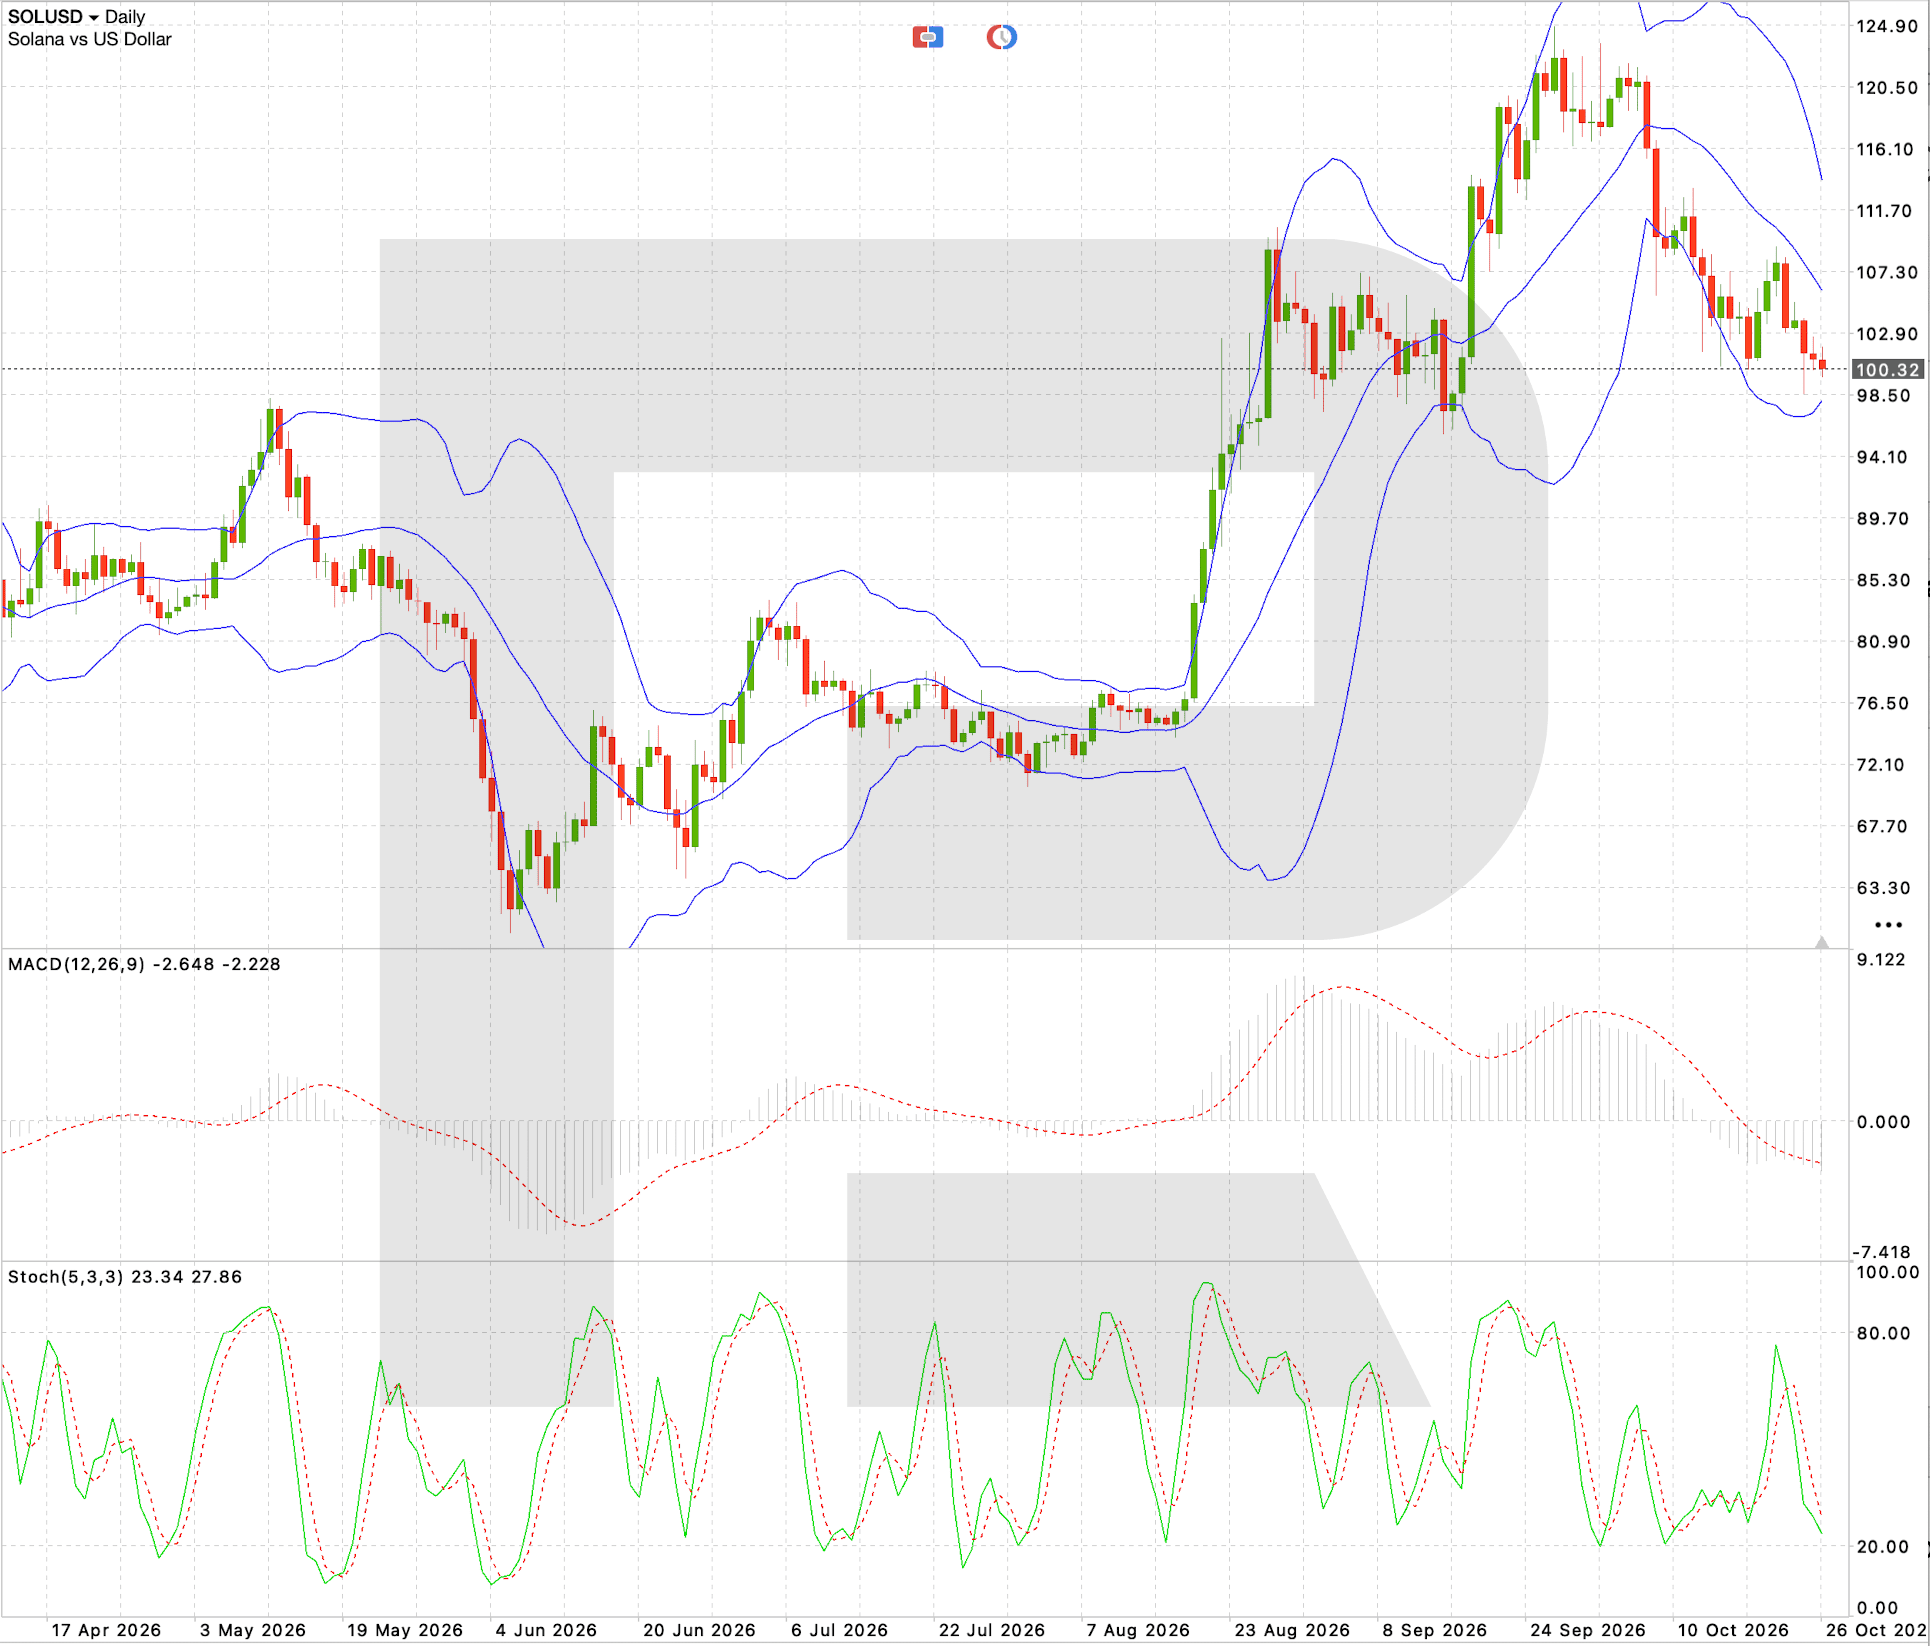
SOLUSD trading scenario
Dogecoin price forecast: DOGEUSD
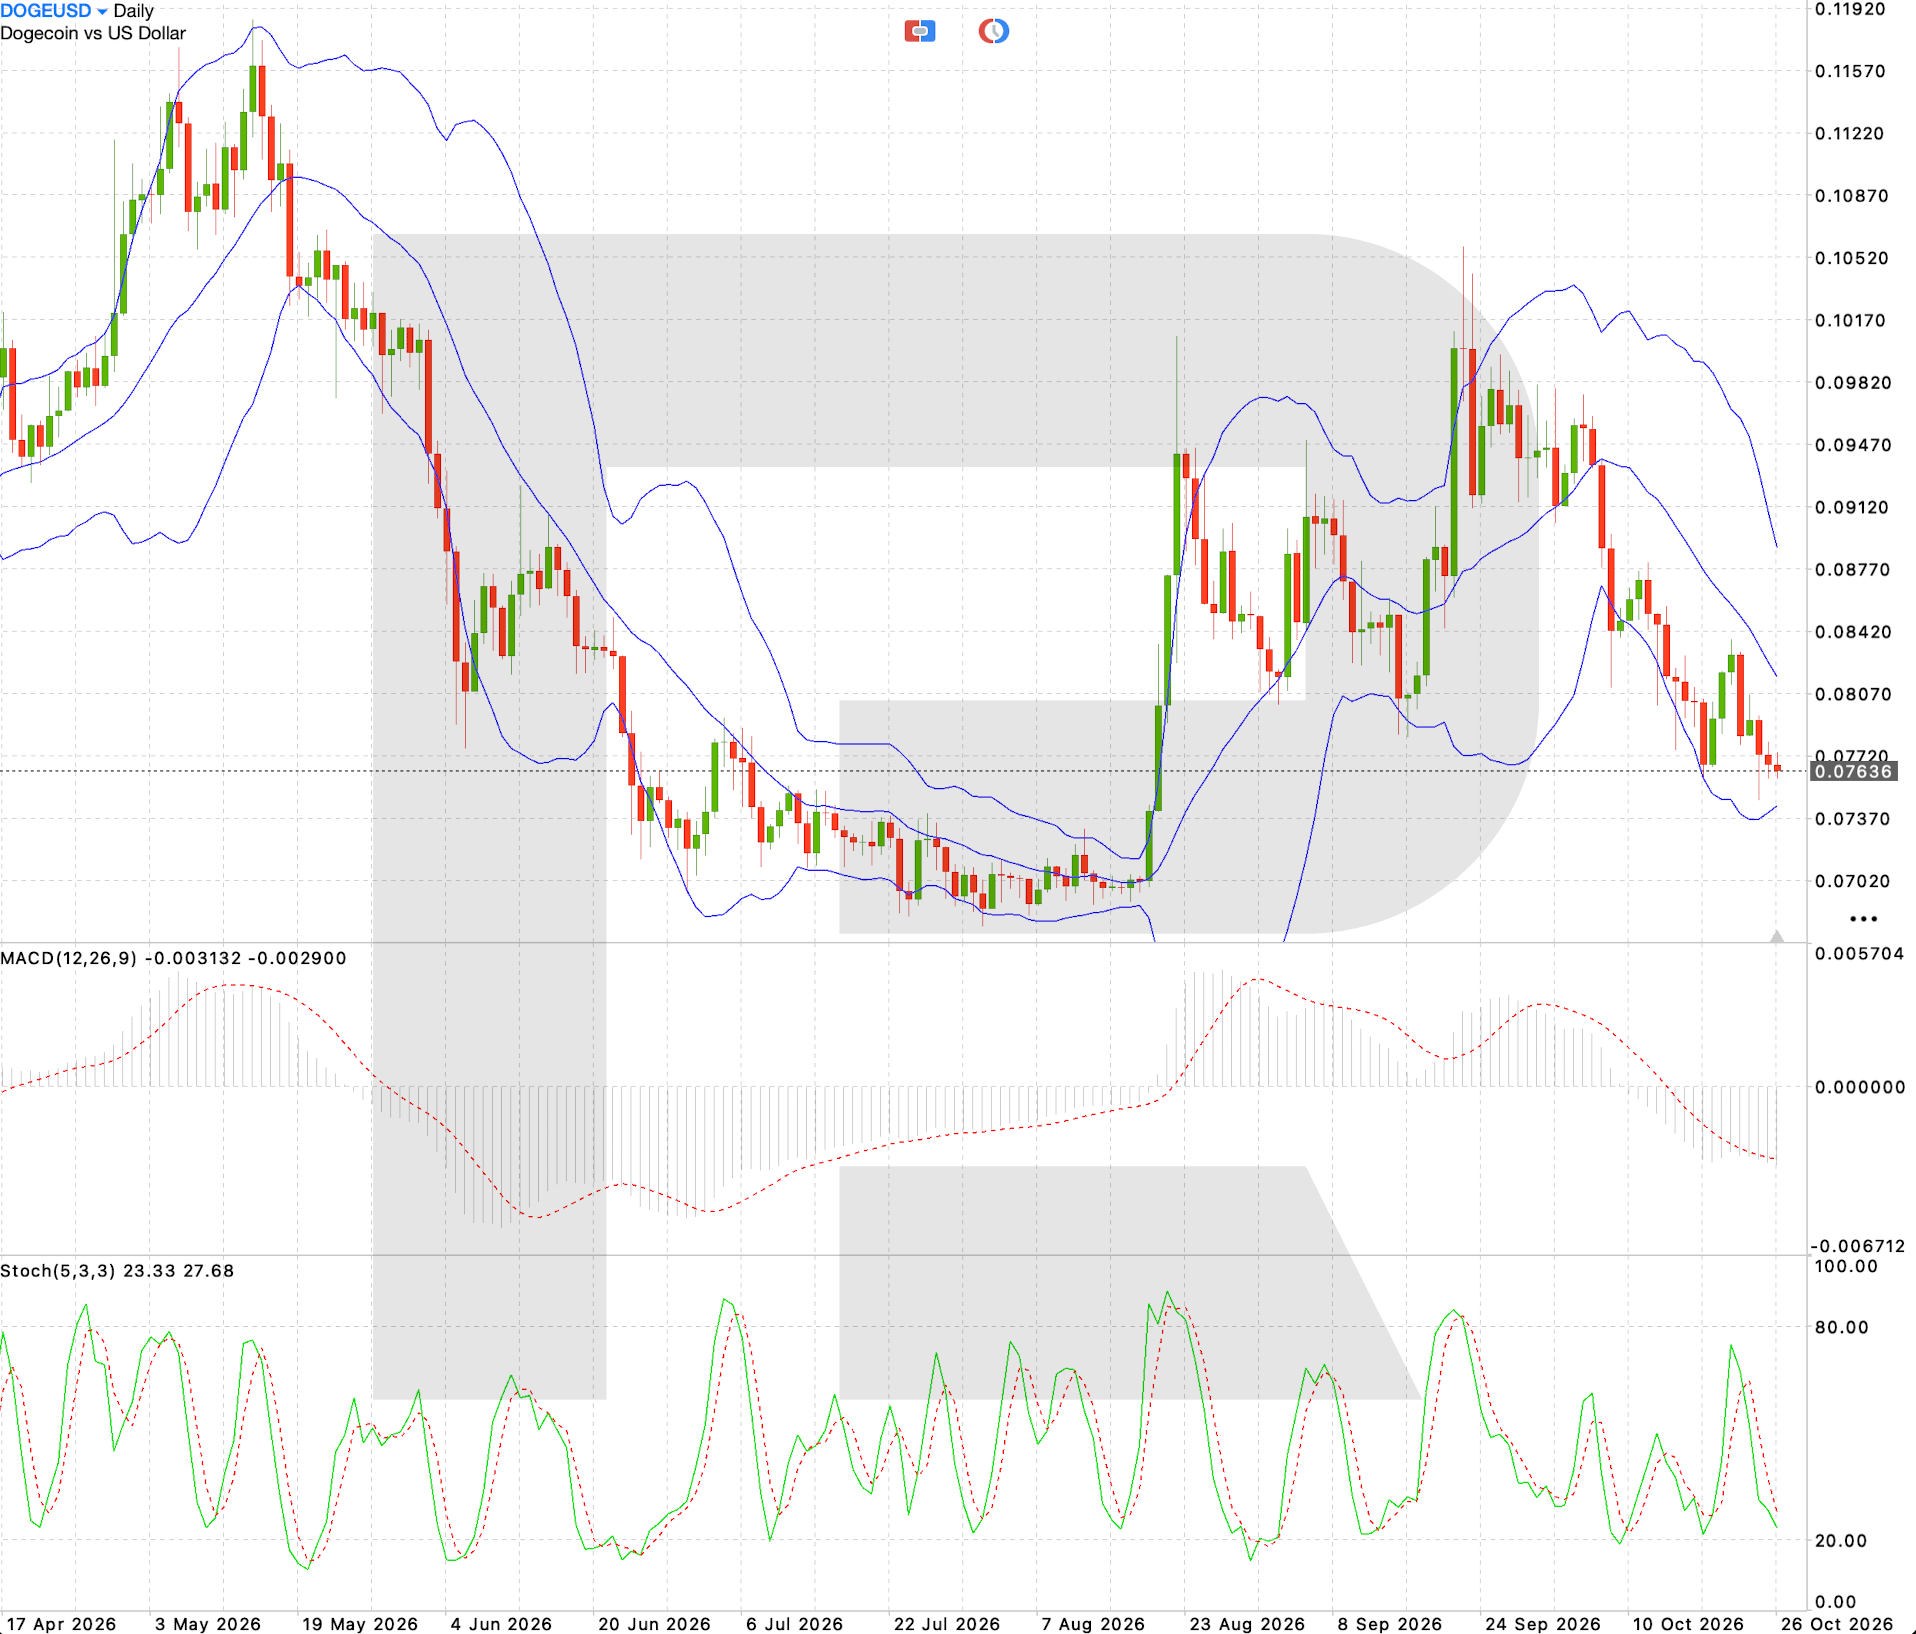
On the D1 chart, DOGEUSD is trading around 0.0763, continuing to decline after September's recovery towards 0.1050. The price is below the middle Bollinger Band and remains close to the lower boundary of the range. The support level lies at 0.0750, with resistance at 0.0842. MACD remains negative, while the Stochastic Oscillator is approaching oversold territory, indicating a high likelihood of continued volatility.
A breakout below the 0.0750 support level could extend the decline towards 0.0700, with the next target at 0.0670. An alternative scenario envisages a recovery above the 0.0842 resistance level, paving the way for a rise towards 0.0912. However, the current technical structure remains bearish.
DOGEUSD trading scenario
Risk factors
The main risk factors for the cryptocurrency market during the week of 26 October to 1 November remain uncertainty about future Federal Reserve monetary policy, the release of US inflation data, and a possible strengthening of the dollar. More hawkish rhetoric from the regulator could increase US Treasury yields and prompt further reductions in positions in risky assets.
Capital flows into spot Bitcoin and Ethereum ETFs could have a significant impact. Renewed sustained outflows would increase pressure on cryptocurrencies, while recovering institutional demand could trigger sharp technical rebounds. The high proportion of leveraged positions presents an additional threat: a breakout below major support levels could accelerate liquidations and increase volatility, particularly in XRPUSD, SOLUSD, and DOGEUSD.
Summary and what to watch this week
The cryptocurrency market outlook for 26 October to 1 November suggests that predominantly bearish sentiment will persist. Sell scenarios have been prepared for BTCUSD, ETHUSD, XRPUSD, SOLUSD, and DOGEUSD if their nearest support levels are broken. Bitcoin is trading around the psychological 80,000 mark, Ethereum is testing the 2,300 area, and altcoins remain more sensitive to shifts in market sentiment.
The central event of the week will be the Federal Reserve's decision on 28 October. Investors will focus particularly on the regulator's comments about the interest rate outlook, after which markets will assess US core PCE inflation and Q3 GDP figures. Additionally, it is necessary to monitor trends in the US Dollar Index, Treasury yields, and daily capital flows into cryptocurrency ETFs.
The overall weekly outlook remains bearish, although several cryptocurrencies are close to technically oversold zones, increasing the likelihood of short-term corrective rebounds.
Editors’ picks


EURUSD forecast 2026–2027: technical analysis, price levels & predictions
The EURUSD outlook for 2026 and 2027: key levels on the daily chart, three trading scenarios and the policy gap between the Fed and the ECB that drives the pair.

Gold (XAUUSD) forecast 2026: technical analysis, price levels & predictions
Where gold could trade in 2026: key levels, three trading scenarios with entry triggers and the forecasts from J.P. Morgan, Deutsche Bank and Goldman Sachs.
Forecasts presented in this section only reflect the author’s private opinion and should not be considered as guidance for trading. RoboForex bears no responsibility for trading results based on trading recommendations described in these analytical reviews.