
Crypto market outlook for the week of 9–15 November 2026: key levels and trading scenarios
The cryptocurrency market outlook for the week of 9–15 November covers BTCUSD, ETHUSD, XRPUSD, SOLUSD, and DOGEUSD, including key levels, events, and trading scenarios. The main event will be the release of October US inflation data, which could alter expectations for future Federal Reserve policy. Bitcoin is trading around 75,949 USD, while major altcoins remain in a downtrend. Capital outflows from cryptocurrency ETFs and the consequences of the large-scale Binance hack are adding to pressure on the market.
Key levels for the week
| Instrument | Weekly forecast | Support | Resistance | Scenario |
|---|---|---|---|---|
| BTCUSD | −6.0% | 75,338 | 79,344 | Sellfrom75,250 |
| ETHUSD | −10.1% | 2,188 | 2,365 | Sellfrom2,180 |
| XRPUSD | −8.0% | 1.1175 | 1.2630 | Sellfrom1.1450 |
| SOLUSD | −9.6% | 85.30 | 98.50 | Sellfrom88.80 |
| DOGEUSD | −8.2% | 0.0701 | 0.0771 | Sellfrom0.0708 |
Events that can move crypto this week
| Date | Event | Instruments affected |
|---|---|---|
| Tuesday, 10 November 2026 | US CPI for October | The week's main event for BTCUSD, ETHUSD, and altcoins. The figures will affect expectations for the Federal Reserve's interest rate, the dollar, and bond yields. |
| Friday, 13 November 2026 | US PPI for October | Producer inflation data could alter expectations for Federal Reserve policy and trigger volatility in BTCUSD, ETHUSD, and altcoins. |
Crypto market fundamentals
The cryptocurrency market enters the second week of November under selling pressure. Bitcoin has settled below 80,000 USD and fallen towards 76,000 USD, Ethereum is trading around 2,240 USD, and Solana and XRP are showing pronounced downward momentum. Following the US congressional midterm elections, attention has shifted to inflation risks and the outlook for Federal Reserve monetary policy. Waning risk appetite is accompanied by reductions in positions in major digital assets.
The fallout from the Binance hack, involving approximately 6.3 billion USD, remains a significant negative factor. After withdrawals resumed, customers withdrew a net total of about 4.7 billion USD. Despite the announced measures to compensate losses, the incident has heightened concerns about the security of cryptocurrency infrastructure and the resilience of investor confidence. The investigation and potential further reports about movements of stolen assets could sustain elevated volatility.
Institutional flows are adding further pressure. According to monitoring data for US cryptocurrency ETFs, total net capital outflows on 6 November were around 537 million USD. Over the past 30 days, Bitcoin funds recorded outflows of approximately 1.63 billion USD. These developments point to caution among major market participants and limit the potential for a sustained price recovery.
The week's main macroeconomic event will be the release of US CPI inflation data on 10 November. In September, annual inflation was 3.7%, while core inflation was 2.6%. Higher-than-expected October figures could fuel expectations of further Federal Reserve tightening, supporting the dollar and US bond yields. Such a scenario would remain negative for cryptocurrencies. Conversely, weaker data could trigger short covering and a short-term recovery in BTCUSD and altcoins. The Producer Price Index on Friday will provide another reference point.
The technical picture confirms sellers' dominance. All five cryptocurrencies under review are trading below the middle Bollinger Bands, while MACD is in negative territory. Meanwhile, Stochastic Oscillators are approaching oversold territory, increasing the likelihood of short-term corrective rebounds. However, unless the price breaks above key resistance levels, such moves will not yet indicate a reversal of the main trend.
Bitcoin price forecast: BTCUSD
On the D1 chart, Bitcoin remains in a downtrend after reaching a September high near 87,388. Prices have fallen to 75,949 and are testing the 75,338 support level. The nearest resistance is located at 79,344, with the next significant supply area near 81,347. The price remains below the middle Bollinger Band. MACD is in negative territory and continues to decline, confirming sellers' advantage. The Stochastic Oscillator is close to oversold territory, so a short-term rebound is possible before the decline resumes.
The primary scenario suggests a break below support at 75,338 and a continued decline towards 73,335 and subsequently towards 71,400. A breakout above the 79,344 resistance level would weaken bearish momentum and open the way for a recovery towards 81,347–83,350. However, confirmation of a sustained upward move would require the price to consolidate above the nearest resistance levels.
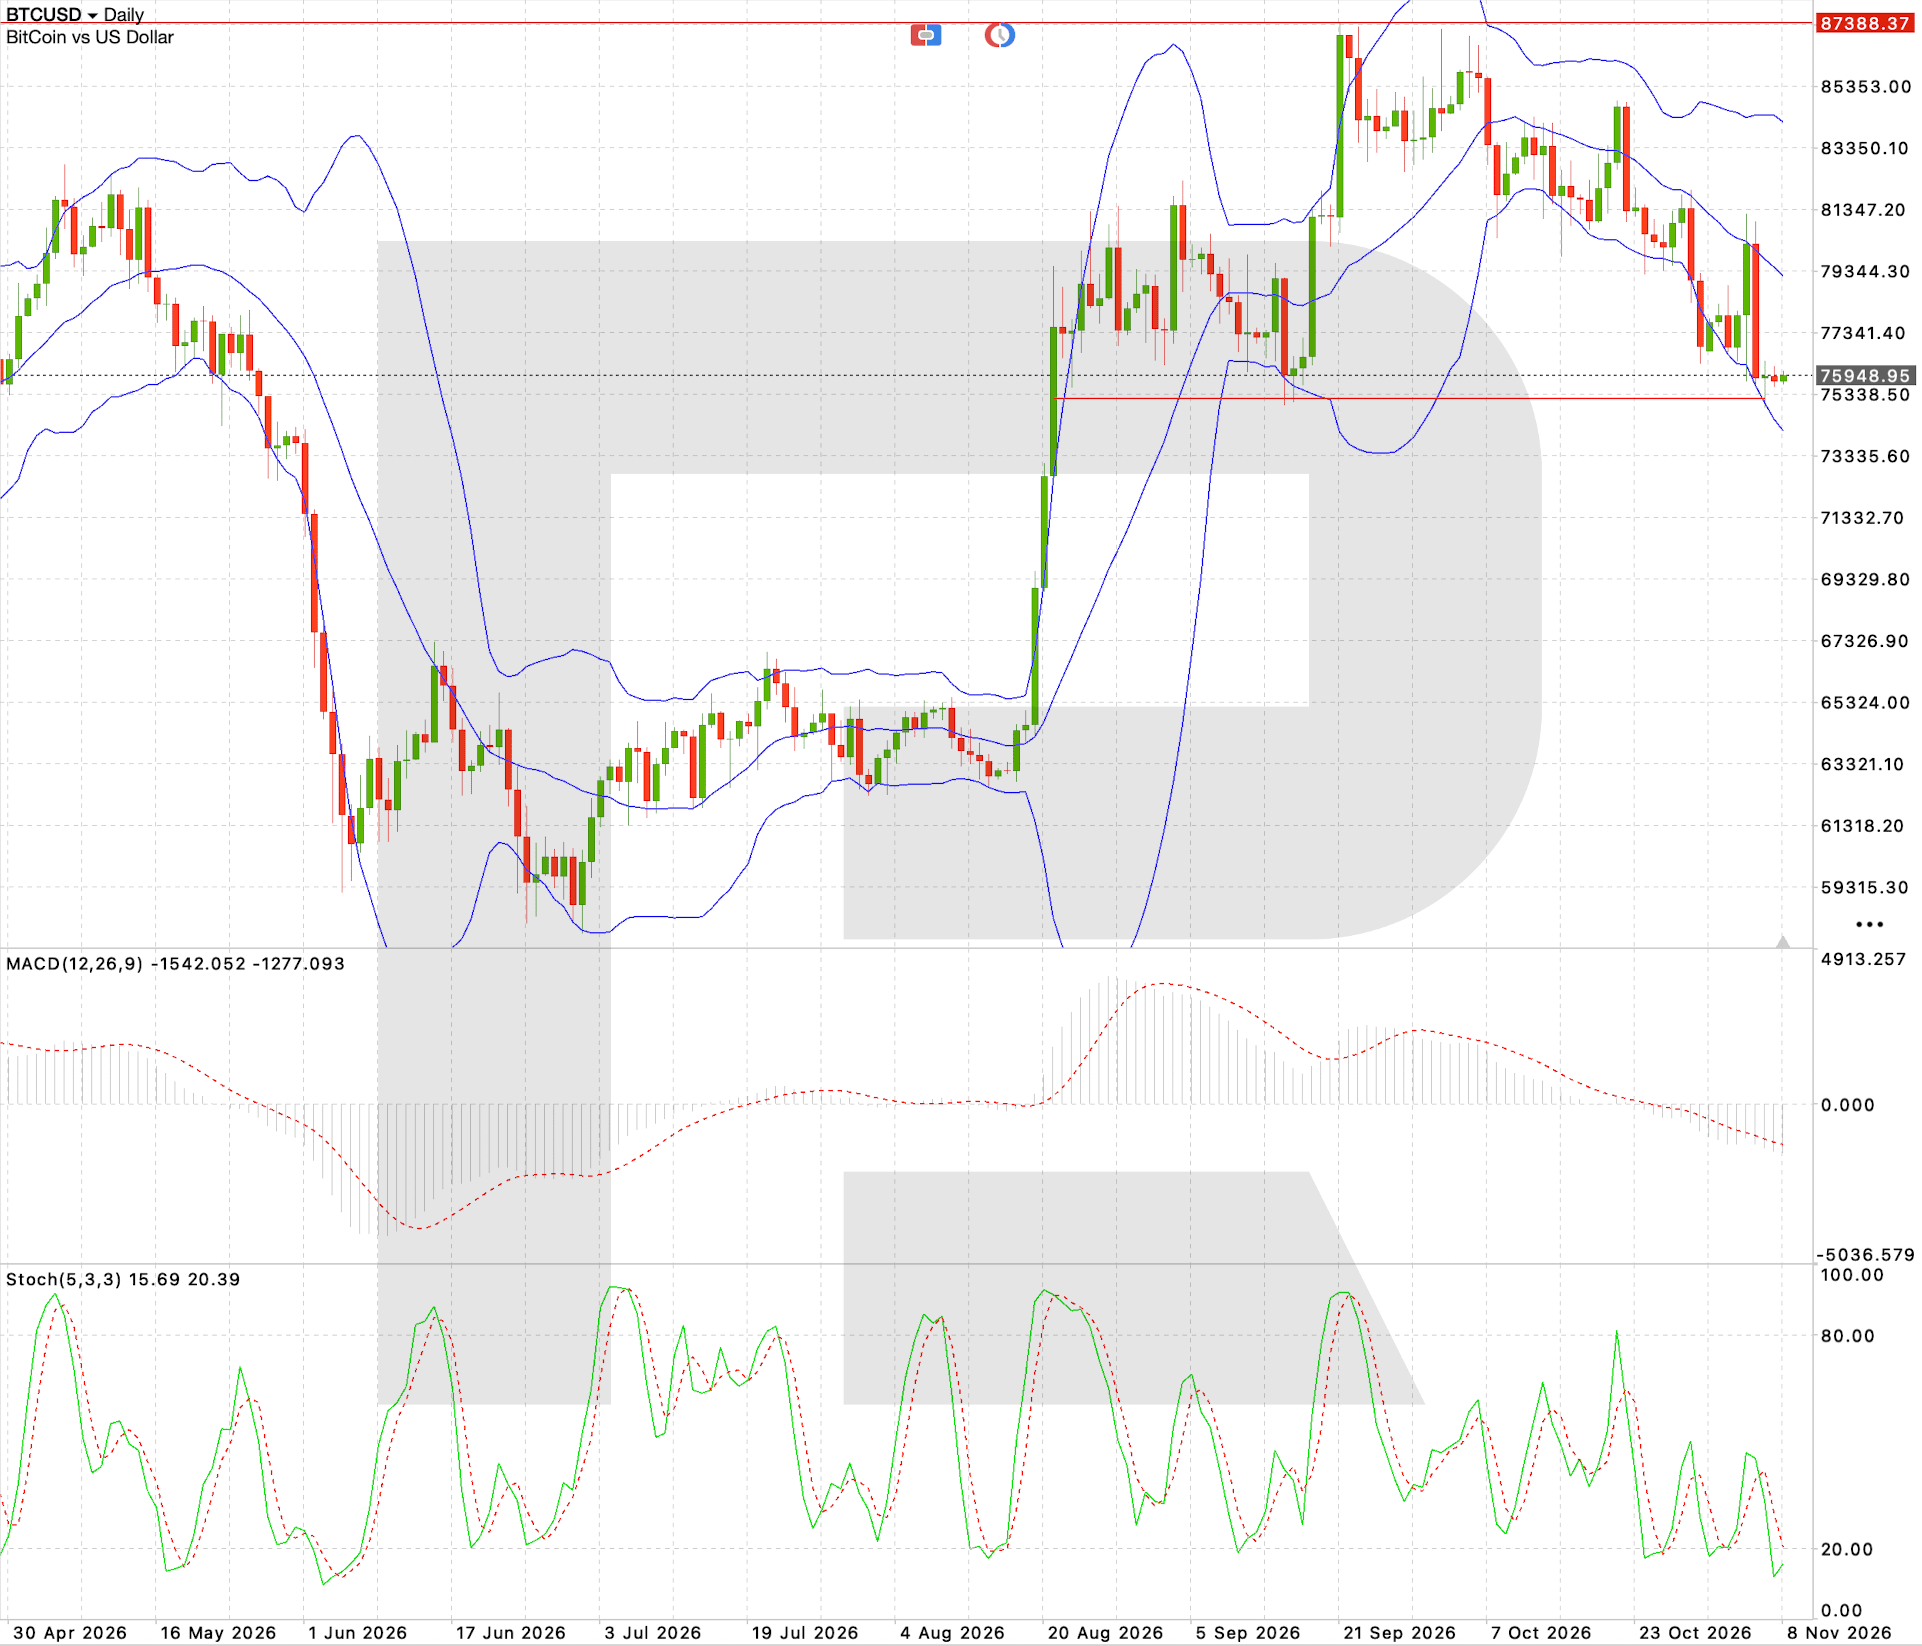
BTCUSD trading scenario
Ethereum price forecast: ETHUSD
On the D1 chart, Ethereum remains in a downtrend. After declining from the 2,700–2,800 area in October, the price fell to 2,241. The support level is located around 2,188, with the nearest resistance at 2,365. The price remains below the middle Bollinger Band, while MACD stays in negative territory. The Stochastic Oscillator has fallen towards oversold territory, suggesting a local recovery but not yet confirming a reversal of the main trend.
The main scenario envisages a break below the 2,188 support level, followed by a decline towards 2,100 and 2,015. If buyers secure a foothold above resistance at 2,365, this could pave the way for a corrective rise towards 2,453 and 2,541. As long as ETHUSD remains below 2,365, sellers retain the advantage.
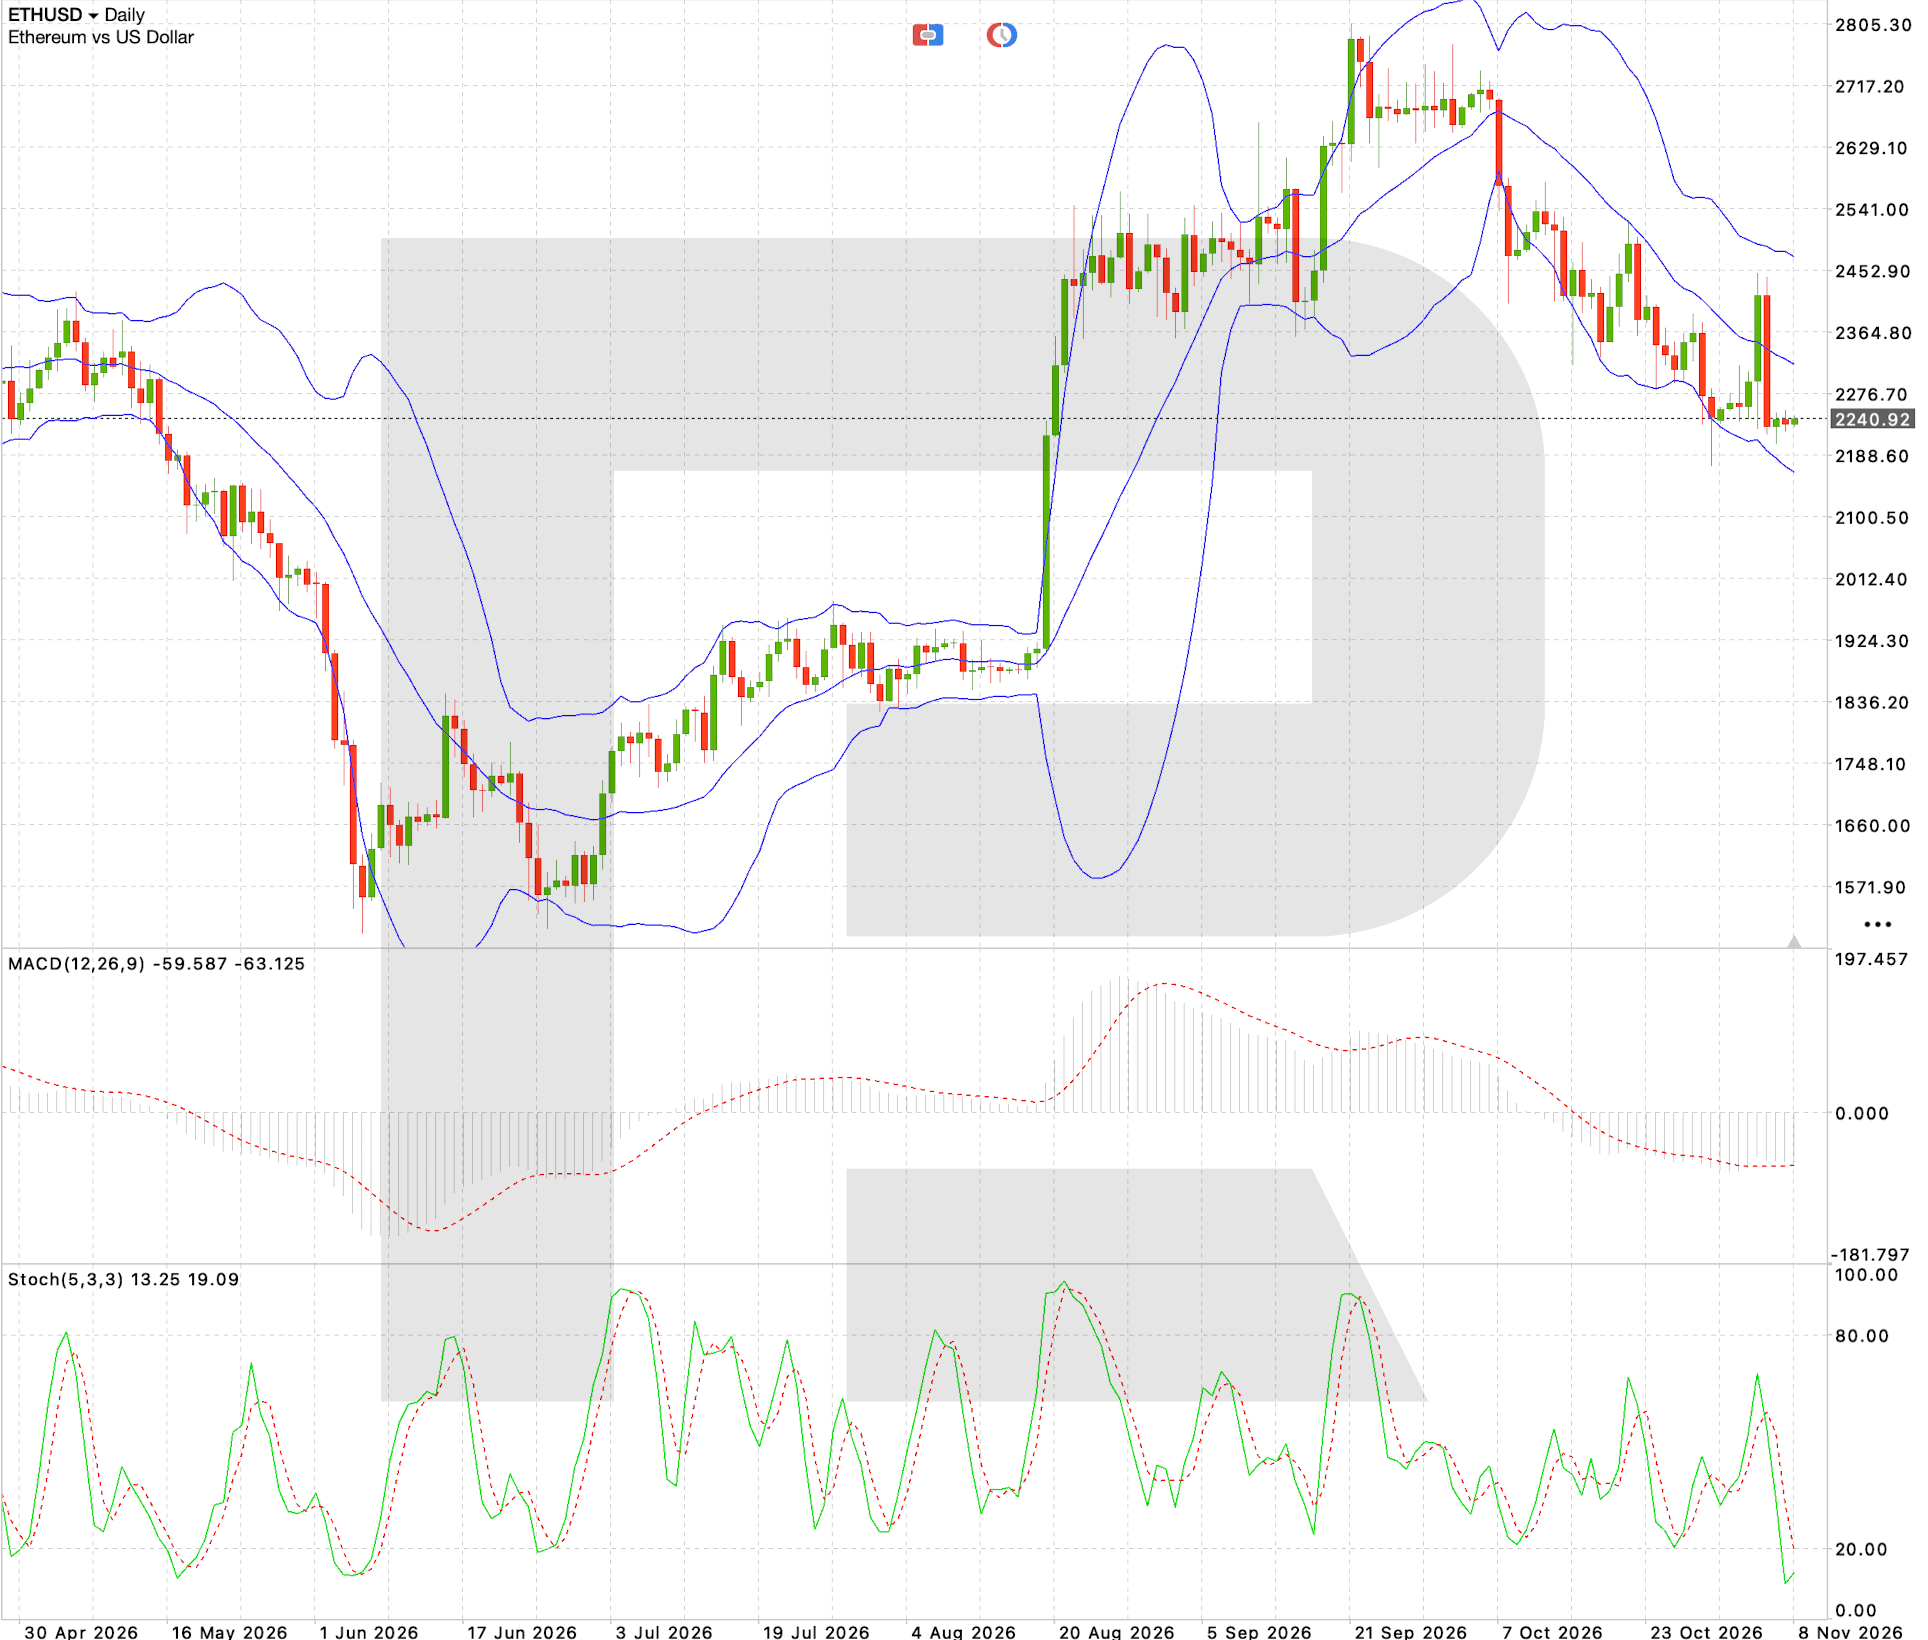
ETHUSD trading scenario
XRP price forecast: XRPUSD
On the XRPUSD daily chart, a pronounced downtrend persists. After rising towards 1.55 in September, the price formed a sequence of lower highs and lower lows. XRP is now trading around 1.1634, below the previously significant support level at 1.2145. The nearest support lies at 1.1175, with resistance at 1.2630. MACD remains in negative territory, confirming buyer weakness. The Stochastic Oscillator has fallen to extremely low readings, increasing the likelihood of a short-term technical rebound.
The primary scenario suggests a continued decline following a break below the 1.1450–1.1175 area. The target is 1.0700, while stronger selling could bring prices towards 1.0205. An alternative scenario would unfold if the price recovers above 1.2630, opening the way for a corrective rise towards 1.3115 and 1.3600. However, reversing the medium-term trend would require a more sustained recovery.
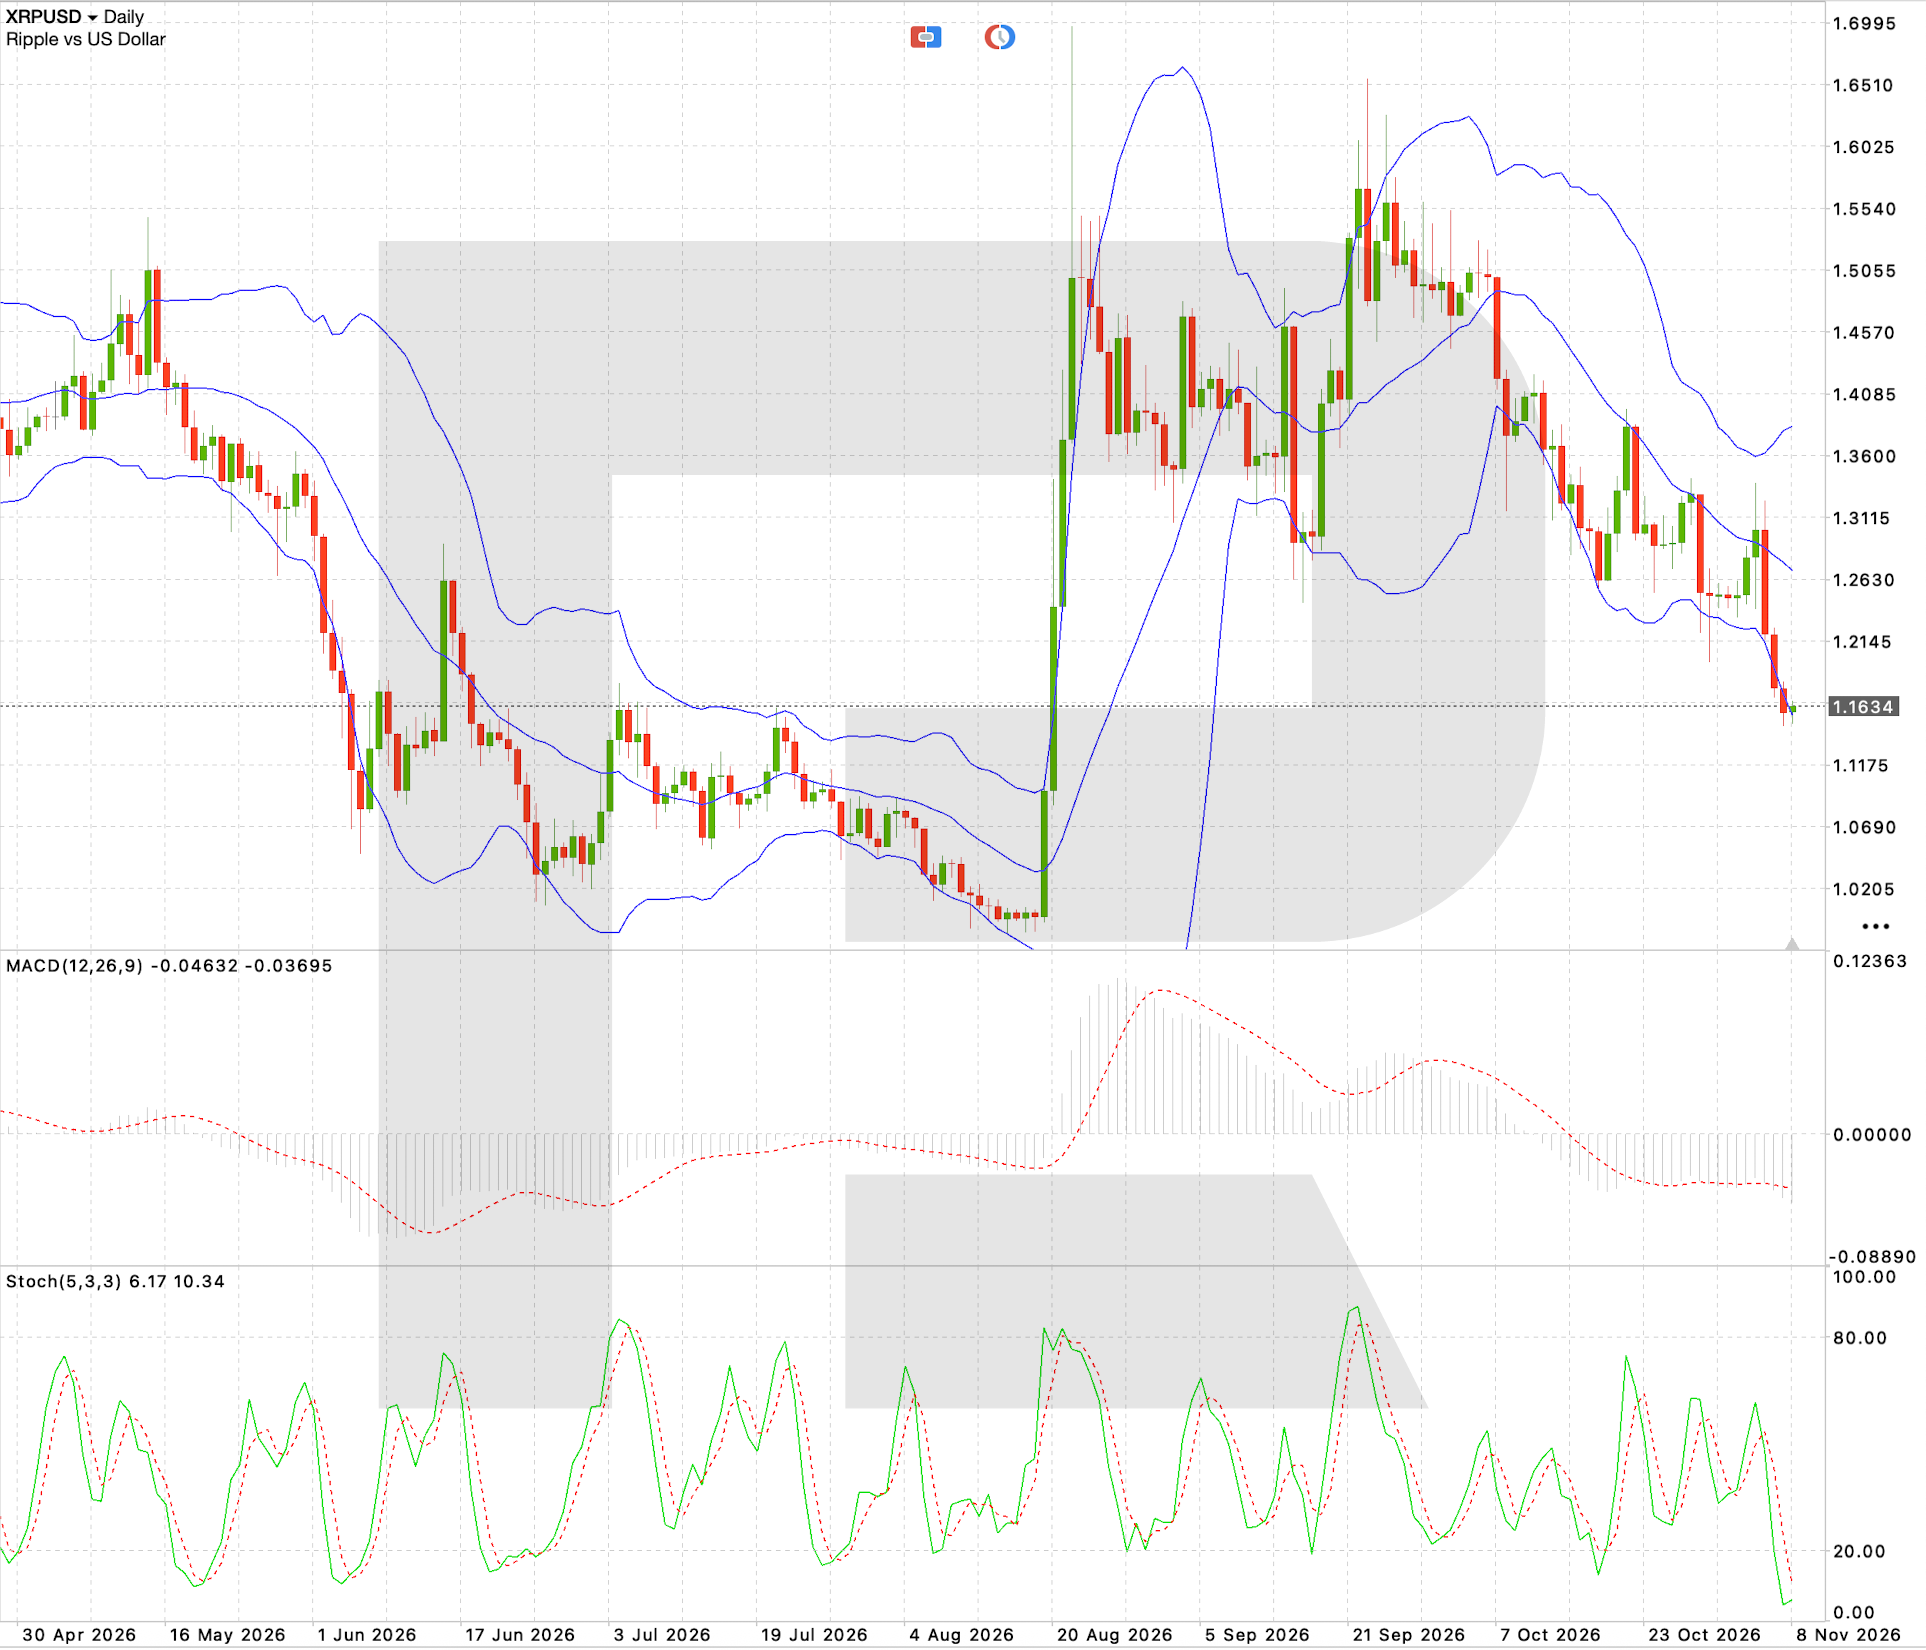
XRPUSD trading scenario
Solana price forecast: SOLUSD
On the D1 chart, Solana remains in a downtrend following September's rise above 120. The price declined steadily throughout October and reached 89.50 by the start of the second week of November. The nearest support level is located at 85.30, with resistance at 98.50. The price is hovering below the middle Bollinger Band, while MACD continues to move in negative territory. The Stochastic Oscillator indicates oversold conditions, but there are still no signs of a full-fledged trend reversal.
The primary scenario envisages a continued decline and a test of the 85.30 support level. If this level is broken, the next target will be 80.90. A breakout above resistance at 98.50 would open the door for a recovery towards 102.90 and 107.30. However, as long as SOLUSD remains below 98.50, corrective advances will be viewed within the broader downtrend.
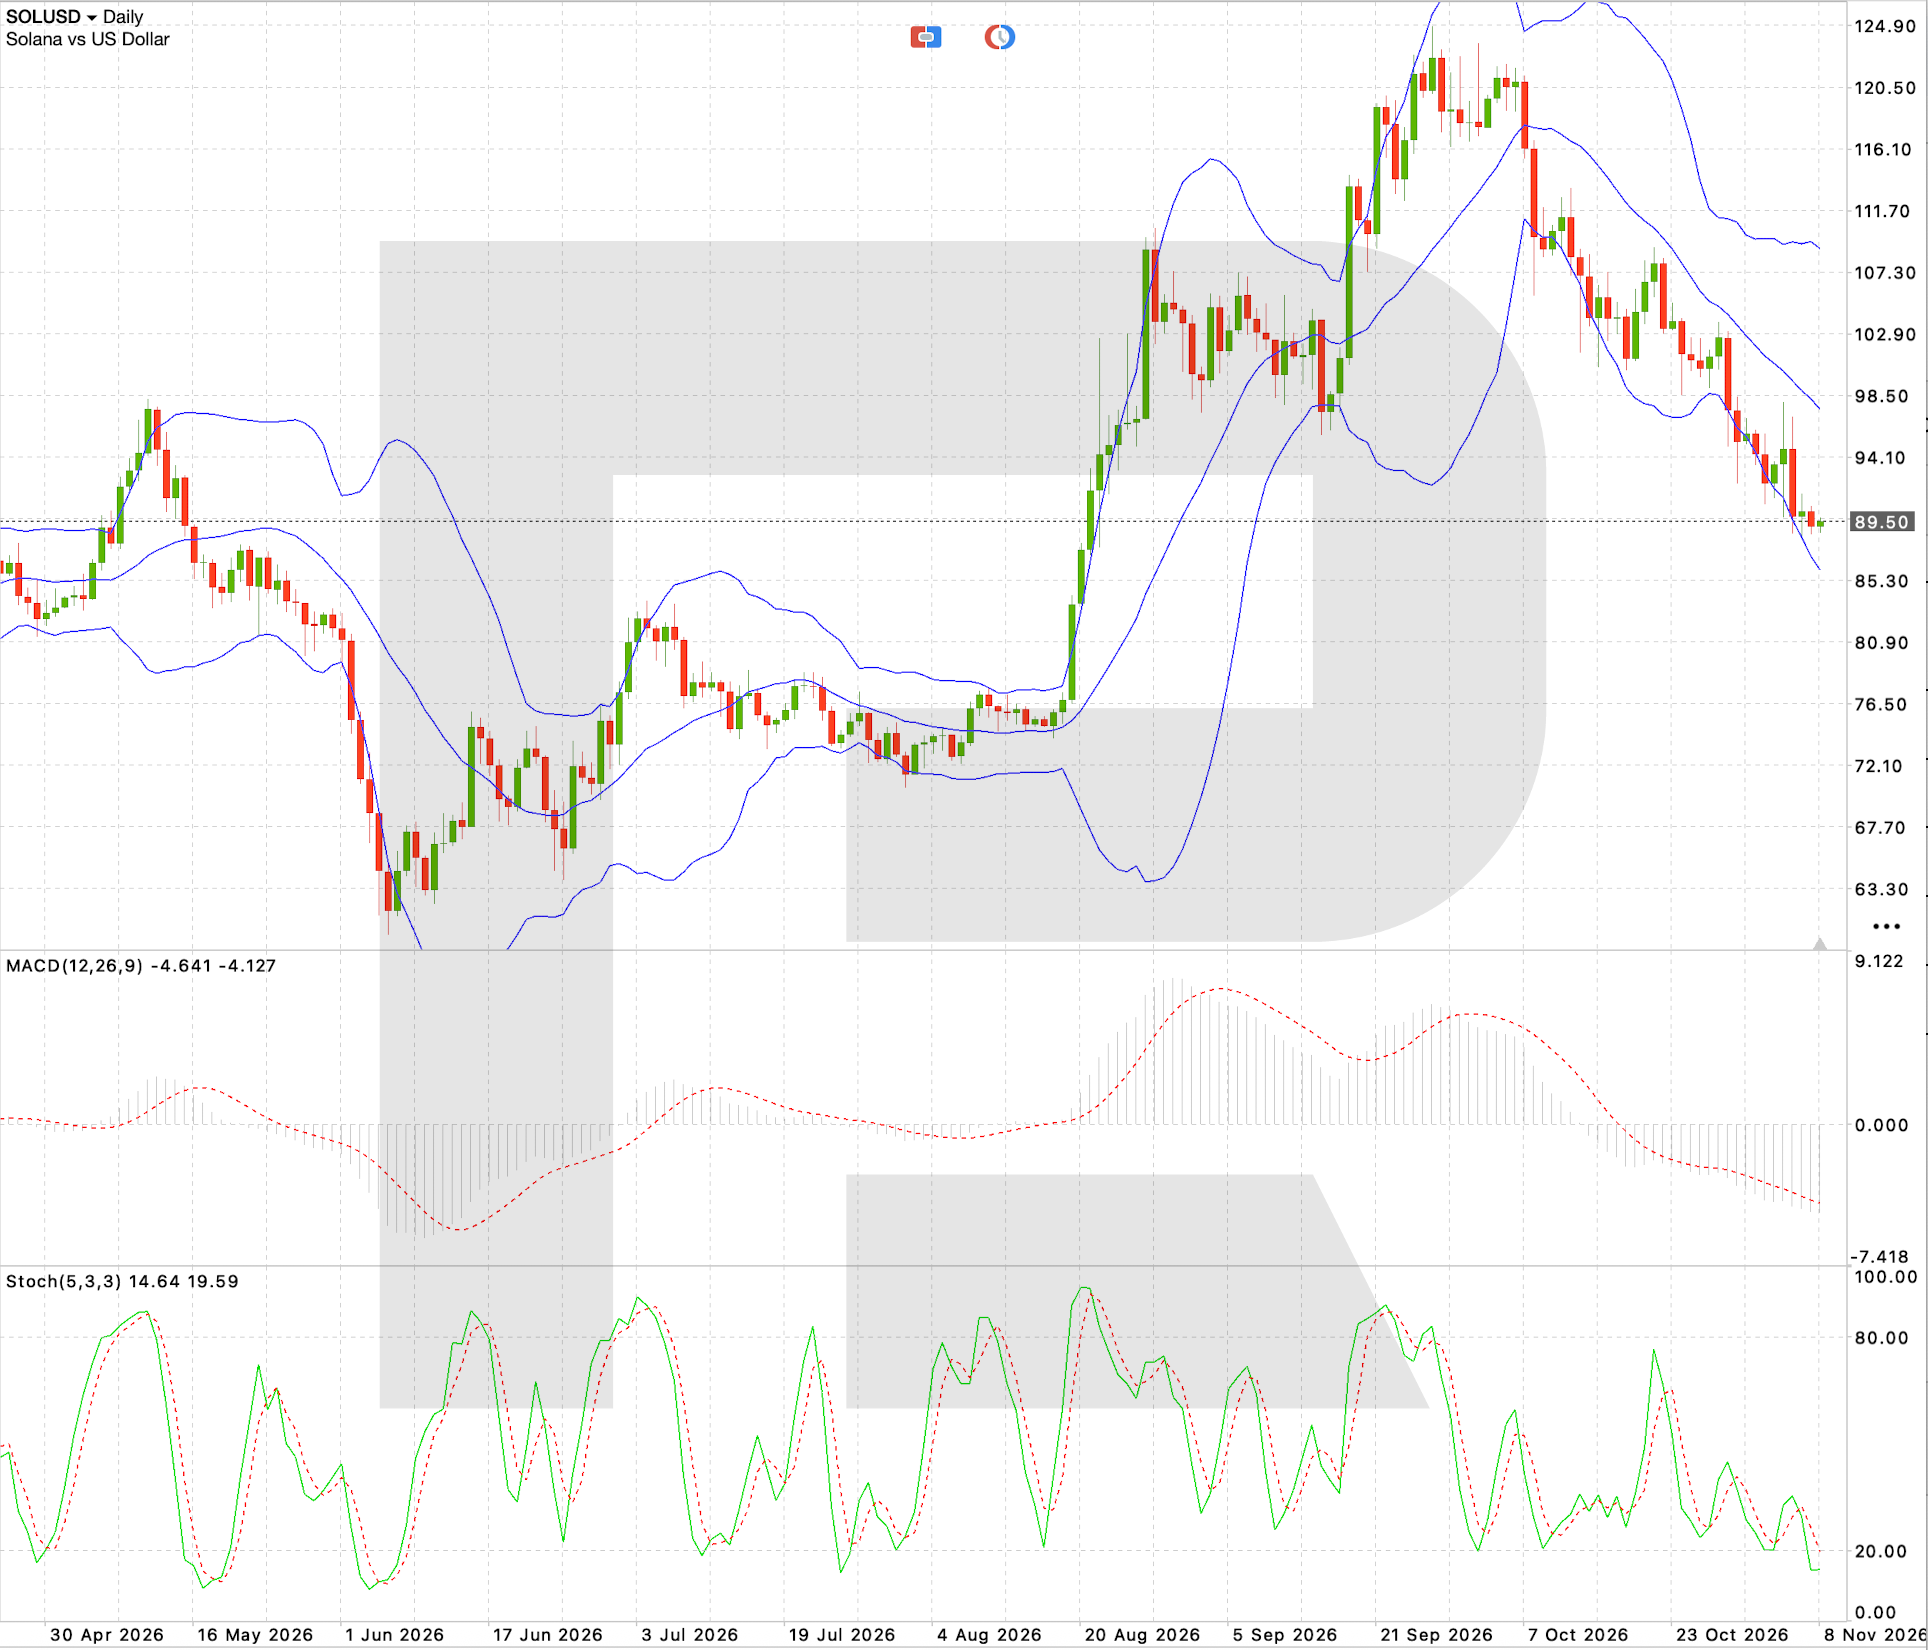
SOLUSD trading scenario
Dogecoin price forecast: DOGEUSD
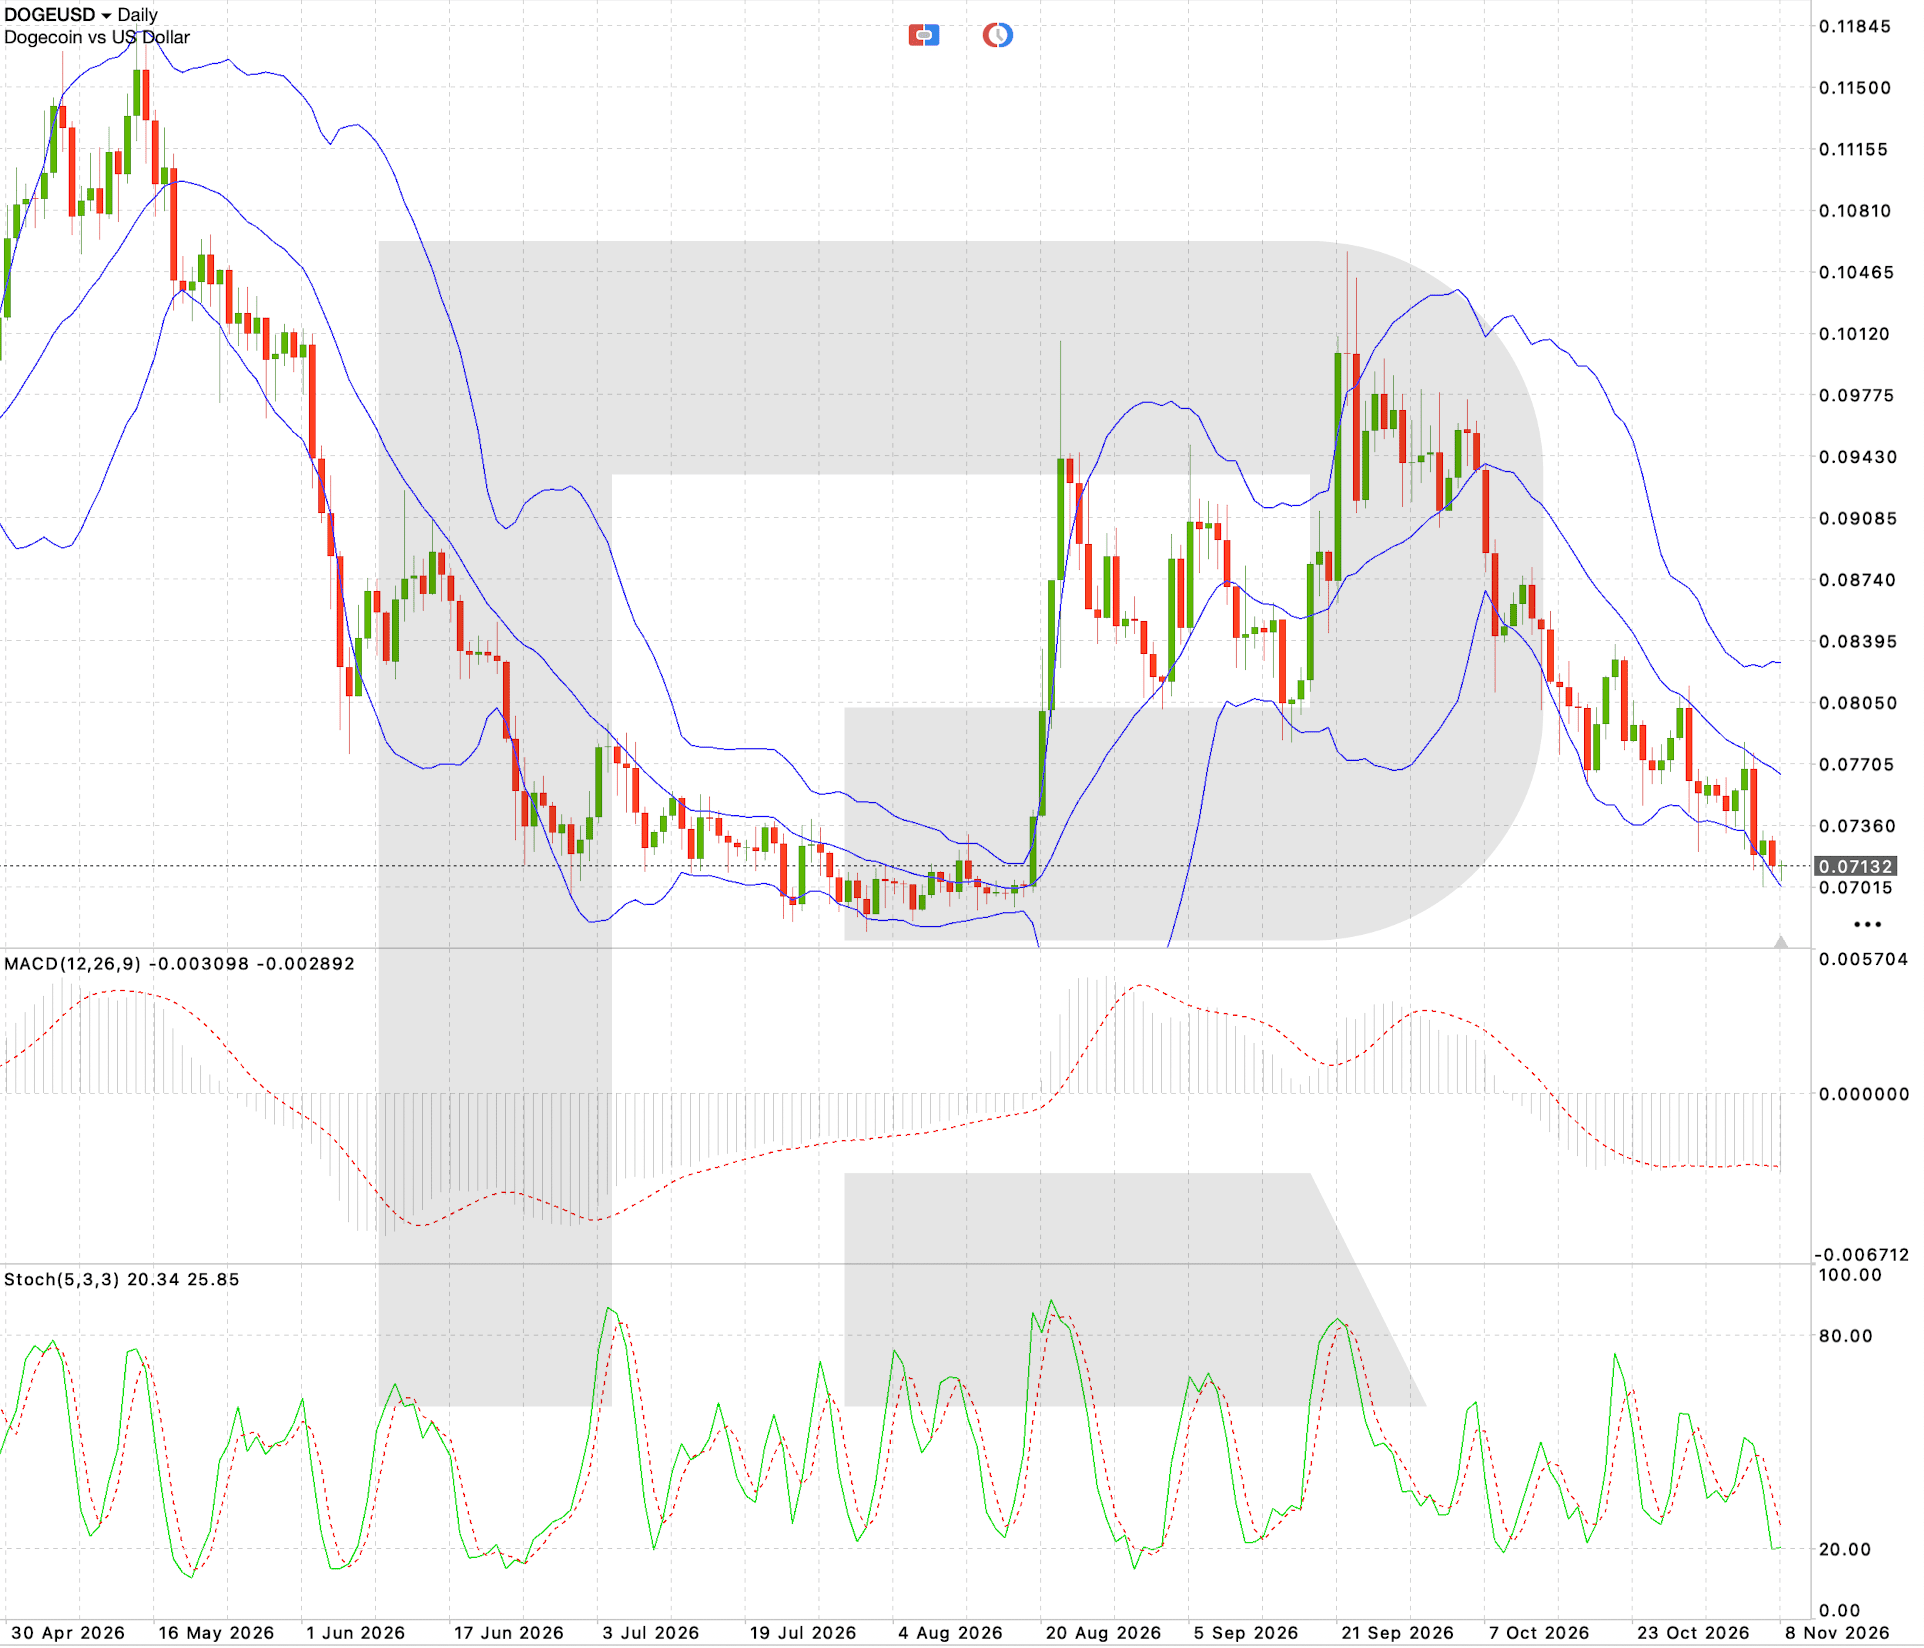
On the D1 chart, Dogecoin continues to decline after failing to consolidate above 0.1000 in September. The price has dipped to 0.07132 and approached the 0.0701 support level. The nearest resistance lies at 0.0771. The price remains below the middle Bollinger Band, while MACD stays negative, indicating sustained selling pressure. The Stochastic Oscillator is near oversold territory, so short-term corrective moves are possible.
The main scenario calls for a break below support at 0.0701 and a decline towards 0.0677, followed by a move towards 0.0655. If the price overcomes the 0.0771 resistance level, a recovery towards 0.0805 and 0.0839 could follow. However, a more sustained upward move would require a breakout from the current descending structure.
DOGEUSD trading scenario
Risk factors
The main risk factors for the cryptocurrency market during the week of 9–15 November remain US inflation data, uncertainty over future Federal Reserve policy, and unstable institutional flows. The release of the Consumer Price Index on Tuesday and the Producer Price Index on Friday could trigger significant moves in the dollar and US bond yields. Higher-than-expected inflation figures could strengthen expectations of interest rate hikes, adding to pressure on BTCUSD, ETHUSD, and major altcoins.
The fallout from the large-scale Binance hack remains an additional source of uncertainty. New reports about the investigation, movements of stolen assets, or changes in customer flows could trigger further volatility. Conversely, renewed confidence in the exchange would ease investors' concerns and provide some support to the cryptocurrency market.
Capital flows into US spot cryptocurrency ETFs are also significant. Continued outflows would limit the recovery potential of Bitcoin and Ethereum, while a return of institutional demand could create conditions for a corrective rise. Technically oversold conditions across most of the instruments under review pose an additional risk to short positions. Weaker US inflation data could prompt accelerated short covering and a sharp price recovery.
Summary and what to watch this week
The cryptocurrency market outlook for 9–15 November suggests that predominantly bearish sentiment will persist. Bitcoin, Ethereum, XRP, Solana, and Dogecoin are under selling pressure, and technical indicators do not yet confirm a sustained reversal. Sell scenarios following breaks below the nearest support levels remain the priority. The key reference levels are 75,338 for BTCUSD, 2,188 for ETHUSD, 1.1175 for XRPUSD, 85.30 for SOLUSD, and 0.0701 for DOGEUSD.
Investors' attention will focus on US CPI inflation on 10 November and the Producer Price Index on 13 November. The releases will shape short-term expectations for Federal Reserve interest rates. Strong inflation figures would support the dollar and increase pressure on digital assets, while slowing inflation could trigger a technical market recovery.
Capital flows into cryptocurrency ETFs and developments surrounding Binance should also be monitored. Despite the increased likelihood of local rebounds from oversold conditions, a change in the main scenario would require prices to recover above key resistance levels. Until such signals emerge, the risks of further cryptocurrency declines remain elevated.
Editors’ picks


EURUSD forecast 2026–2027: technical analysis, price levels & predictions
The EURUSD outlook for 2026 and 2027: key levels on the daily chart, three trading scenarios and the policy gap between the Fed and the ECB that drives the pair.

Gold (XAUUSD) forecast 2026: technical analysis, price levels & predictions
Where gold could trade in 2026: key levels, three trading scenarios with entry triggers and the forecasts from J.P. Morgan, Deutsche Bank and Goldman Sachs.
Forecasts presented in this section only reflect the author’s private opinion and should not be considered as guidance for trading. RoboForex bears no responsibility for trading results based on trading recommendations described in these analytical reviews.