
ETHUSD faces the risk of forming a reversal pattern
ETHUSD is trending lower towards the 2,365 USD support level, a breakout below which could trigger a cascade of long-position liquidations. The price currently stands at 2,472 USD. Discover more in our analysis for 8 September 2026.
ETHUSD forecast: key takeaways
- Sellers are poised to test the 2,365 USD level, a breakout below which could complete the formation of a Double Top reversal pattern
- The Ethereum network is experiencing a supply shortage, as the amount of staked coins reached 42.9 million
- ETHUSD forecast for 8 September 2026: 2,185
Fundamental analysis
The ETHUSD price continues to decline after rebounding from a strong resistance level at 2,520 USD. Key support is located at 2,365 USD. A breakout and consolidation below this mark could increase selling pressure and create conditions for the formation of a Double Top reversal pattern.
According to the latest Coinglass data, the market remains vulnerable to sharp local declines. If ETHUSD falls below 2,365 USD, this could trigger a wave of forced liquidations of long positions across cryptocurrency exchanges, potentially accelerating the price decline.
At the same time, buyers have not abandoned attempts to continue the upward move. Bulls regularly test the 2,520 USD resistance level, seeking to gain a foothold above it. Ethereum is also receiving additional support from significant capital inflows into US spot ETH ETFs, with net inflows reaching 1.57 billion USD over the past two weeks.
Meanwhile, the amount of coins available for free circulation on the Ethereum network continues to decline. The volume of ETH locked in staking has reached 42.9 million coins. Reduced supply on exchanges limits sellers’ opportunities and may prevent sustained bearish momentum from developing.
Technical outlook
The ETHUSD price remains above the EMA-65, indicating continued buying pressure. However, bulls’ attempts to break above the 2,520 USD resistance level are currently encountering strong resistance from sellers. The ETHUSD forecast for today suggests a downward correction, with potential for a decline towards 2,185 USD.
The technical picture is gradually shifting in favour of sellers. The Stochastic Oscillator is testing the resistance level and forming a bearish crossover, signalling a possible strengthening of downward momentum. A breakout below the lower boundary of the Double Top reversal pattern and consolidation below 2,365 USD would further confirm the scenario. In this case, sellers would receive a signal for the pattern to play out, with the prospect of a further decline.
However, the risk of an alternative scenario remains. If buyers regain the initiative, a breakout above the pattern’s upper boundary and consolidation above the 2,520 USD resistance level would invalidate the bearish scenario and create conditions for a continued upward move.
ETHUSD overview
- Asset: ETHUSD
- Timeframe: H4 (intraday)
- Trend: bullish
- Key resistance levels: 2,520 and 2,705
- Key support levels: 2,365 and 2,205
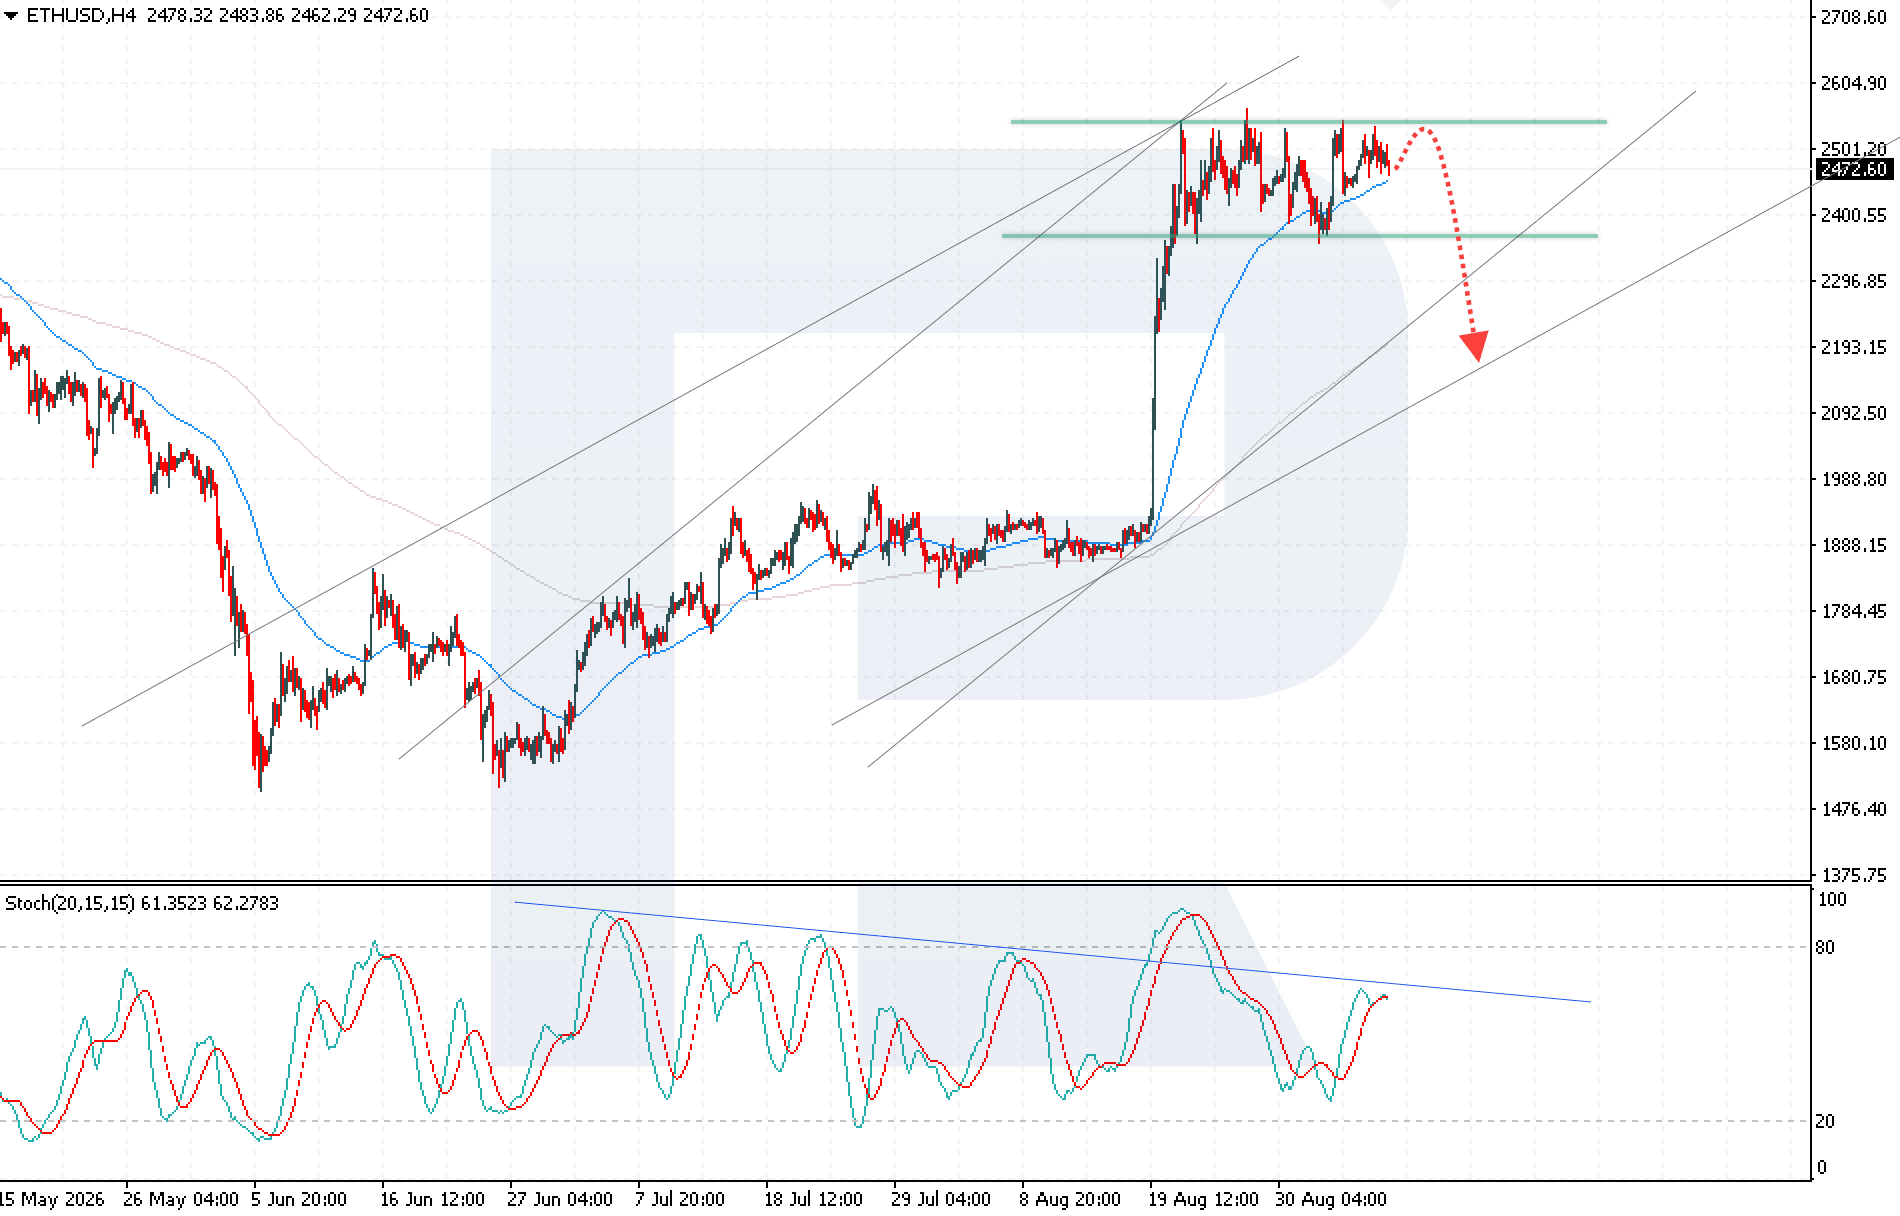
Ethereum trading scenario for today
Trading scenario (Sell Stop)
A breakout below the lower boundary of the Double Top reversal pattern would indicate increased selling pressure and bearish momentum.
- Current price: 2,472
- Entry price: 2,405
- Stop loss: 2,505
- Take profit: 2,200
- Risk-to-reward ratio: more than 1:2
The trade idea is valid until 8:00 AM on 14 September 2026 (server time, UTC+3).
Risk factors
The main risk to the ETHUSD downside scenario is strong institutional support in the form of 1.57 billion USD in net inflows into US spot ETH ETFs, enabling major market participants to buy local dips aggressively.
Summary
The current decline in ETHUSD increases the risk of a Double Top reversal pattern forming and a large-scale liquidation of long positions if the price breaks below the key 2,365 USD support level. However, the asset’s downside remains limited thanks to strong institutional support.
Editors’ picks
 EURUSD forecast 2026–2027: technical analysis, price levels & predictions
EURUSD has recovered from the July lows and is trading near 1.1545 — back in bullish territory. The pair has reclaimed EMA65 on the daily, formed a bullish EMA crossover on H4, and the US-eurozone GDP gap has narrowed sharply (US 1.5% vs eurozone 1.0%). Goldman Sachs and Deutsche Bank both now target 1.2500 by year-end. A confirmed close above 1.1700 opens the path to 1.1805. We break down the key levels, three trading scenarios, and what the unprecedented 9-3 FOMC dissent vote means for EURUSD.
 Gold (XAUUSD) forecast 2026: technical analysis, price levels & predictions
Gold has reversed its downtrend and is trading near 4,360 USD, back above both EMA65 and EMA200. ETF flows turned positive in July with 3 billion USD of net inflows, and central banks bought 288.9 tonnes in Q2 — up 62% year-on-year. A breakout above 4,500 USD opens the path to 4,855 USD and the 5,597 USD all-time high. We break down the key levels, three trading scenarios with entry triggers, and what J.P. Morgan, Deutsche Bank and Goldman Sachs are forecasting for gold in 2026.
Forecasts presented in this section only reflect the author’s private opinion and should not be considered as guidance for trading. RoboForex bears no responsibility for trading results based on trading recommendations described in these analytical reviews.