
Ethereum awaits a signal from the Fed: a single inflation report could change market sentiment
Ethereum is attempting to recover ahead of the release of US CPI data, currently trading at 2,530 USD. For more details, see our analysis for 13 October 2026.
ETHUSD forecast: key takeaways
- Outflows from Ethereum ETFs continue
- The September CPI report is due on 14 October
- ETHUSD forecast for 13 October 2026: 2,635 USD
Fundamental analysis
Today's Ethereum price forecast takes into account that the fundamental backdrop for ETHUSD remains negative.
The main headwinds to a recovery are prolonged capital outflows from spot ETFs, high US bond yields, and investor caution ahead of the US inflation data release.
Outflows from Ethereum ETFs continue. As of 12 October, US spot ETH funds had recorded net outflows for ten consecutive trading sessions. Investors withdrew around 542 million USD over the previous week, indicating weakening institutional demand and making it harder for ETH to recover.
The September CPI report is due on 14 October. Accelerating inflation could fuel expectations of high interest rates and dampen sentiment in the cryptocurrency market. Conversely, more moderate figures could support demand for risk assets, pushing the Ethereum price higher.
The SEC has proposed updating the rules governing the custody of cryptoassets by investment funds and advisers. The initiative has not yet become a final rule, but clearer requirements could make it easier for traditional financial institutions to participate in the cryptocurrency market, including Ethereum.
The ETHUSD forecast for 13 October takes into account that the key issue is persistent capital outflows from ETFs amid high borrowing costs and concerns about the Federal Reserve's monetary policy. Regulatory changes and potential ETH accumulation by major investors remain supportive factors, but the market needs signs of a recovery in institutional demand for the overall outlook to improve.
Technical outlook
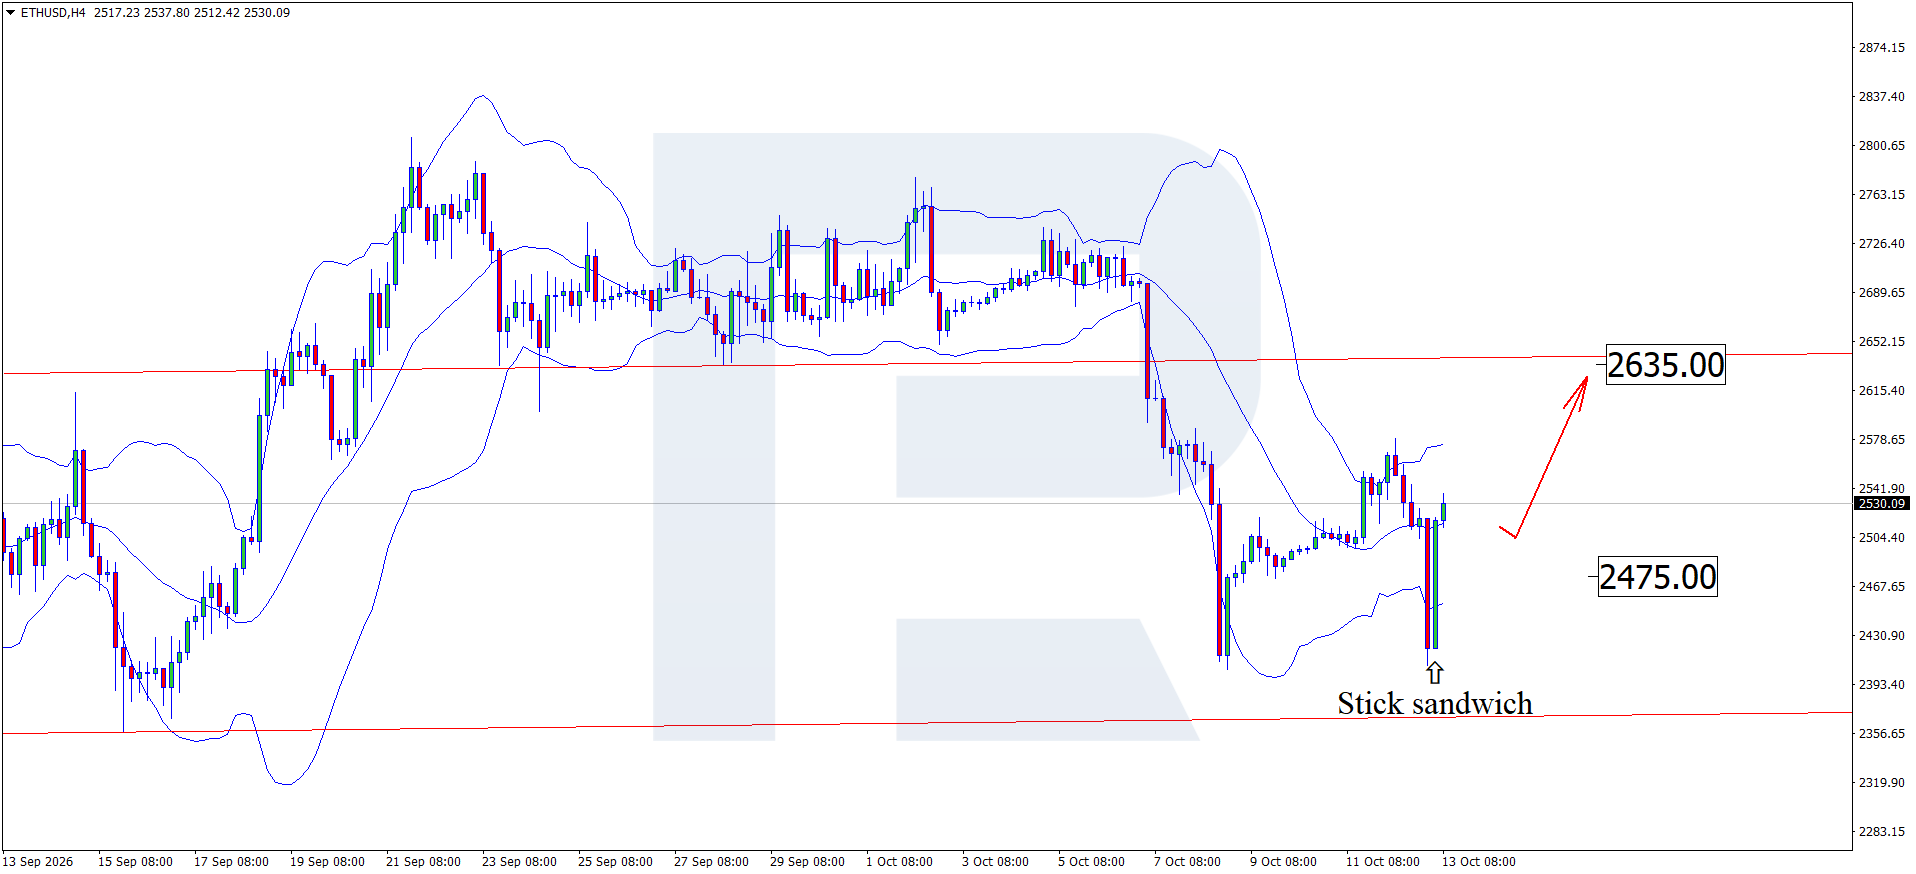
On the ETHUSD H4 chart, the price has formed a Stick Sandwich reversal pattern near the lower Bollinger Band. At this stage, it could continue its upward trajectory as the pattern's signal plays out, with the upside target at the 2,635 resistance level. A breakout above this mark would open the way for the uptrend to continue.
However, today's ETHUSD technical analysis also suggests another scenario. The price could form a corrective wave and test the 2,475 support level before rebounding and resuming its rise.
ETHUSD overview
- Asset: ETHUSD
- Timeframe: H4 (Intraday)
- Trend: bullish
- Key resistance levels: 2,570 and 2,635
- Key support levels: 2,475 and 2,390
Ethereum trading scenario for today
Trading scenario (Buy Stop)
A breakout above the resistance level, followed by consolidation above 2,570 USD, would signal bullish momentum with a target at 2,635 USD.
- Current price: 2,530
- Entry price: 2,570
- Stop loss: 2,540
- Take profit: 2,635
- Risk-to-reward ratio: more than 1:2
The trade idea is valid until 8:00 AM on 17 October 2026 (server time, UTC+3).
Risk factors
The main risk to the bullish ETHUSD scenario is continued selling pressure despite signals from technical indicators. The Fed's policy and a stronger USD are additional risk factors.
Summary
Regulatory changes and potential ETH accumulation by major investors remain supportive factors, but the market needs signs of a recovery in institutional demand for the overall outlook to improve. ETHUSD technical analysis suggests a rise towards 2,635 following a correction.
Editors’ picks
 EURUSD forecast 2026–2027: technical analysis, price levels & predictions
The EURUSD outlook for 2026 and 2027: key levels on the daily chart, three trading scenarios and the policy gap between the Fed and the ECB that drives the pair.
 Gold (XAUUSD) forecast 2026: technical analysis, price levels & predictions
Where gold could trade in 2026: key levels, three trading scenarios with entry triggers and the forecasts from J.P. Morgan, Deutsche Bank and Goldman Sachs.
Forecasts presented in this section only reflect the author’s private opinion and should not be considered as guidance for trading. RoboForex bears no responsibility for trading results based on trading recommendations described in these analytical reviews.