
Solana may become scarce as developers prepare a major update
After its decline, the Solana price is developing a new upward wave in anticipation of updates, currently trading at 73.60. Discover more in our analysis for 6 August 2026.
SOLUSD forecast: key takeaways
- The validator community is still debating the SGP-0003 package
- Developers continue to prepare the Alpenglow update for release
- SOLUSD forecast for 6 August 2026: 76.75 or 72.90
Fundamental analysis
Today’s Solana price forecast takes into account that the price is forming a correction after its rise and is trading near 73.60.
The validator community is still debating the SGP-0003 package, which includes the SIMD-0550 and SIMD-0553 proposals. If adopted, the network could significantly increase the daily burn of SOL through a new fee while also slowing the issuance of new coins more rapidly. In the longer term, this may become a factor putting pressure on the amount of tokens in circulation.
The SOLUSD forecast for 6 August 2026 takes into account that institutional investor interest in the ecosystem remains strong. Following the recent launch of tokenised money market funds and the more active use of the network for stablecoin settlements, Solana is becoming increasingly established as infrastructure for traditional finance, rather than only for DeFi and NFTs.
Although the ecosystem has plenty of positive news, the digital asset market remains under pressure. It is being affected by rising US Treasury yields and investors’ cautious attitude towards risky assets. As a result, less capital is flowing into layer-one blockchains, including Solana.
Developers continue to prepare the Alpenglow update for release. It is expected to significantly accelerate transaction confirmation and improve network efficiency. The update has not yet been launched, but it remains one of the main long-term growth drivers for the entire Solana ecosystem.
Further support comes from discussions of measures to reduce token inflation, broader use of the network by major participants, and the continued development of Solana’s underlying technology. In the near term, expectations for US Federal Reserve policy remain the main external benchmark, as they largely determine overall investor sentiment towards cryptocurrencies.
Technical outlook
On the H4 chart, the SOLUSD price formed a Hammer reversal pattern near the lower Bollinger Band. At this stage, quotes may continue their upward wave as the signal plays out, with the upside target at the 76.75 resistance level. A breakout above this mark would open the door for continued upward movement.
At the same time, today’s SOLUSD technical analysis also suggests another scenario. Quotes may form a correction and test the 72.90 support level before rebounding and resuming growth.
SOLUSD overview
- Asset: SOLUSD
- Timeframe: H4 (intraday)
- Trend: bullish
- Key resistance levels: 76.75 and 83.30
- Key support levels: 72.90 and 65.90
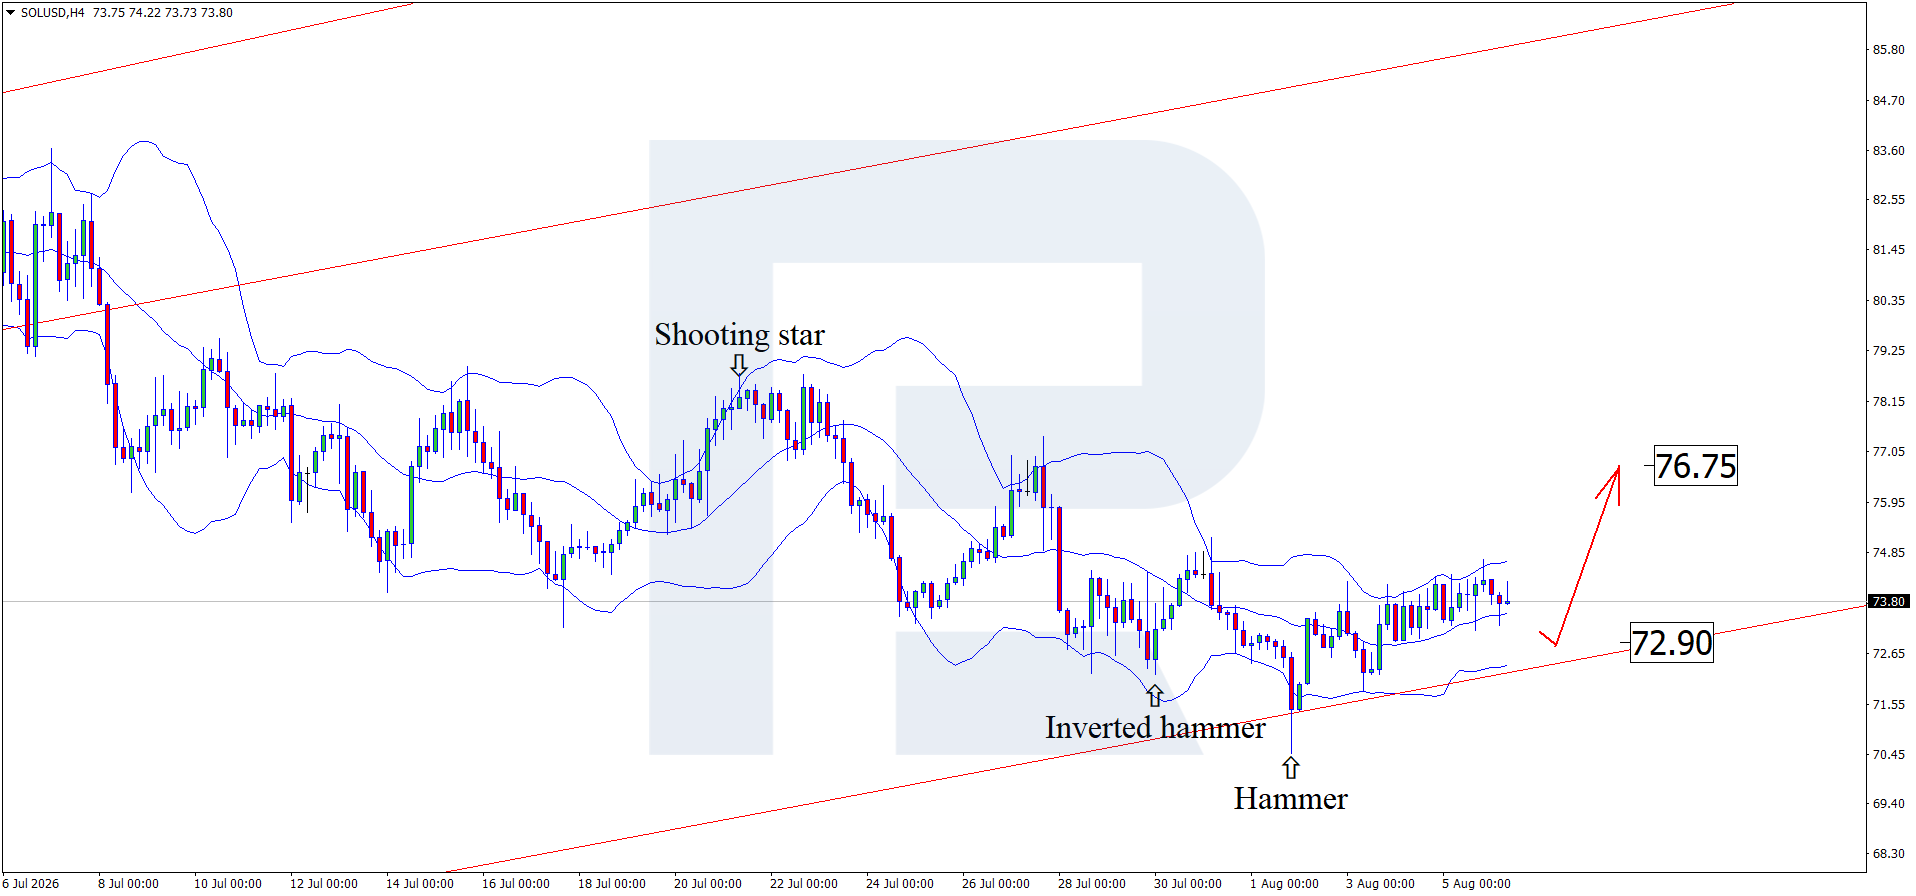
Solana trading scenarios for today
Main scenario (Buy Stop)
Consolidation above the 76.75 resistance level would confirm increased buying pressure and open the way towards the next resistance level at 83.30.
- Take Profit: 83.30
- Stop Loss: 76.40
Alternative scenario (Sell Stop)
A breakout below the 72.90 support level would signal a correction and create conditions for opening short positions.
- Take Profit: 65.90
- Stop Loss: 73.25
Risk factors
The main risk to the SOLUSD upside scenario may be a decline in user activity and liquidity within the Solana ecosystem. An increase in DEX trading volumes, stablecoin transfers, and demand for DeFi applications could bring buyers back into the market and lead to a price consolidation above 83.30.
Summary
SOLUSD continues its upward wave today in anticipation of the Alpenglow update release. SOLUSD technical analysis suggests a rise towards the 76.75 resistance level.
Editors’ picks
 EURUSD forecast 2026–2027: technical analysis, price levels & predictions
EURUSD has pulled back from the 2026 high of 1.1915 and is now trading near 1.1450 — below both EMA65 and EMA200 — with the active scenario shifting from bullish to bearish. The ECB raised rates to 2.40%, but the Fed holds at 3.75%, and US inflation (3.5%) continues to outpace the eurozone (2.8%). A confirmed break below 1.1280 opens the next downward wave toward 1.1080. We break down the key levels, three trading scenarios with entry triggers, and what Deutsche Bank, Morgan Stanley and UBS are forecasting for EURUSD in 2026.
 Gold (XAUUSD) forecast 2026: predictions based on fundamental and technical analysis
Gold has corrected over 25% from its all-time high of 5,597 USD and is now trading near 4,100 USD — testing a critical support zone. Is this the bottom, or will the downtrend continue? We break down the key levels (support 3,920 USD, breakout trigger 4,500 USD), three trading scenarios with entry levels, and what J.P. Morgan, Goldman Sachs and Deutsche Bank are forecasting for gold in 2026.
Forecasts presented in this section only reflect the author’s private opinion and should not be considered as guidance for trading. RoboForex bears no responsibility for trading results based on trading recommendations described in these analytical reviews.