
Solana begins partnership with MoneyGram
The Solana price is poised to resume growth, currently standing at 76.33. For more details, see our analysis for 13 August 2026.
SOLUSD forecast: key takeaways
- The validator community is still debating the SGP-0003 package
- Developers continue to prepare the Alpenglow update for release
- SOLUSD forecast for 13 August 2026: 76.75 or 72.90
Fundamental analysis
The Solana price forecast for today takes into account that the price is forming a correction after its rise and is trading around 73.60.
On 11 August, MoneyGram launched MoneyGram Ramps on Solana. The integration gives applications on the network access to cash deposits in more than 25 countries and withdrawals in more than 170 countries and territories. This is positive for Solana as it expands the network’s practical use in payments and makes it easier to move between traditional money and digital assets.
The SOLUSD forecast for 13 August 2026 takes into account that in July, Solana increased its maximum block capacity by 66%, the volume of real-world assets in the ecosystem reached around 3.73 billion USD, and the payment infrastructure covered more than 330,000 merchant locations.
The institutionalisation of SOL also remains a positive factor. Products related to Solana and staking are already operating in the US market; in early August, further filings were submitted to the SEC for the Grayscale Solana Staking ETF and Canary Marinade Solana ETF.
Softer US inflation data reduces the risk of significant Federal Reserve tightening. At the same time, the Federal Reserve rate currently remains within the 3.50–3.75% range, so SOL, like other high-risk crypto assets, remains sensitive to interest rate expectations, US bond yields, and dollar movements.
Technical outlook
On the D1 chart, SOLUSD has formed a Triangle chart pattern. A breakout in line with the uptrend is the most likely scenario. Lows have been rising consistently since late May 2026. Consolidation above 74.65 would provide an additional bullish signal.
On the H4 chart, SOLUSD has formed resistance at 77.40, while the support level is located at 72.45. A breakout above 77.40 is the most likely scenario, with an upside target at 79.80. If the price breaks below 72.45, the trend would turn bearish, with the downside target at 70.50.
SOLUSD overview
- Asset: SOLUSD
- Timeframe: H4 (intraday)
- Trend: bullish
- Key resistance levels: 77.40
- Key support levels: 72.45
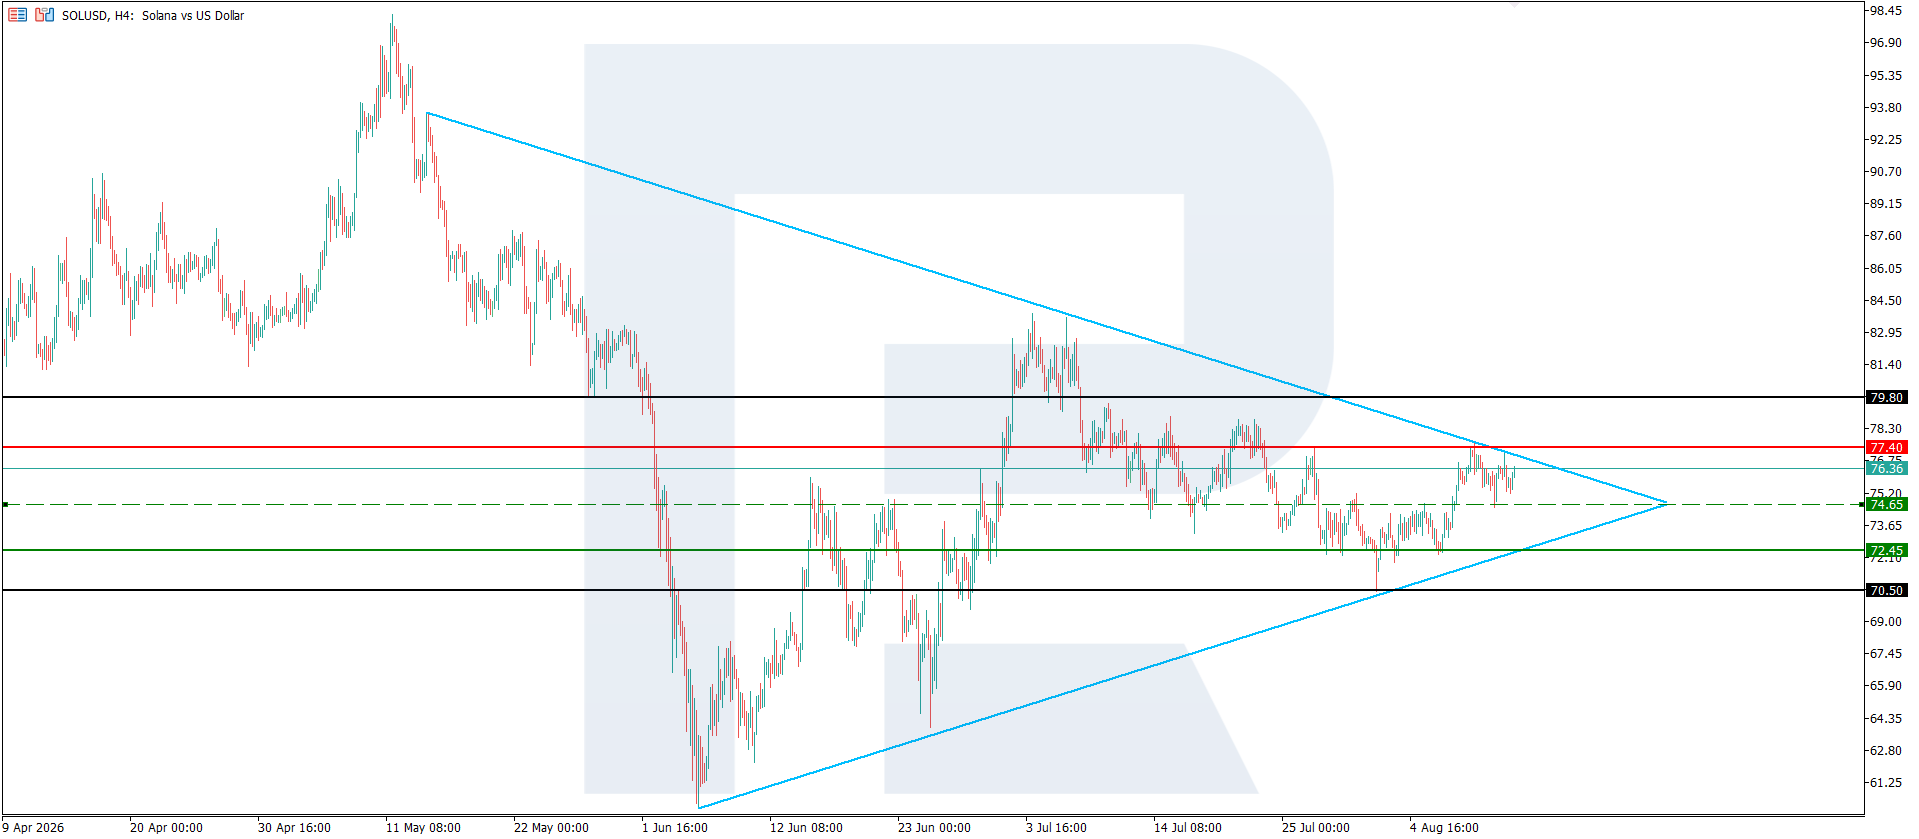
Solana trading scenarios for today
Main scenario (Buy Stop)
Consolidation above the 77.40 resistance level would confirm increased buying pressure and open the way towards the next resistance level at 79.80.
- Take Profit: 79.80
- Stop Loss: 76.90
Alternative scenario (Sell Stop)
A breakout below the 72.45 support level would indicate a correction and create conditions for opening short positions.
- Take Profit: 70.50
- Stop Loss: 72.75
Risk factors
The main risks for SOL are related to the high volatility of the cryptocurrency market and its dependence on overall demand for risk assets: a stronger dollar, rising bond yields, or tighter Federal Reserve policy could trigger a noticeable decline in SOL even against a favourable internal news backdrop. An additional risk is a possible fall in activity within the Solana ecosystem, especially in DeFi and speculative segments, which could reduce fees and demand for the token.
Summary
SOLUSD remains in an uptrend. SOLUSD technical analysis suggests a rise towards the 79.80 resistance level.
Editors’ picks
 EURUSD forecast 2026–2027: technical analysis, price levels & predictions
EURUSD has pulled back from the 2026 high of 1.1915 and is now trading near 1.1450 — below both EMA65 and EMA200 — with the active scenario shifting from bullish to bearish. The ECB raised rates to 2.40%, but the Fed holds at 3.75%, and US inflation (3.5%) continues to outpace the eurozone (2.8%). A confirmed break below 1.1280 opens the next downward wave toward 1.1080. We break down the key levels, three trading scenarios with entry triggers, and what Deutsche Bank, Morgan Stanley and UBS are forecasting for EURUSD in 2026.
 Gold (XAUUSD) forecast 2026: predictions based on fundamental and technical analysis
Gold has corrected over 25% from its all-time high of 5,597 USD and is now trading near 4,100 USD — testing a critical support zone. Is this the bottom, or will the downtrend continue? We break down the key levels (support 3,920 USD, breakout trigger 4,500 USD), three trading scenarios with entry levels, and what J.P. Morgan, Goldman Sachs and Deutsche Bank are forecasting for gold in 2026.
Forecasts presented in this section only reflect the author’s private opinion and should not be considered as guidance for trading. RoboForex bears no responsibility for trading results based on trading recommendations described in these analytical reviews.