
Solana (SOLUSD) poised for gains as market momentum improves
The Solana (SOLUSD) price is hovering around 100.2, with the market supported by a solid fundamental backdrop. Discover more in our analysis for 3 September 2026.
SOLUSD forecast: key takeaways
- Solana (SOLUSD) appears stronger, ending August higher
- Investors can rely on a stable fundamental backdrop
- SOLUSD forecast for 3 September 2026: 107.0
Fundamental analysis
The Solana price stands at 100.2. The fundamental backdrop for Solana (SOLUSD) looks considerably stronger. One of the key factors remains high activity within the ecosystem: Solana-based decentralised exchanges have ranked second only to Binance in weekly spot trading volume for nine consecutive weeks.
This shows that the network maintains a high level of real-world usage and liquidity. Market attention is gradually shifting from simple SOL price movement towards the economic activity generated by the ecosystem itself through trading, fees, and other on-chain operations.
An additional positive signal is that Solana ended August with its first monthly gain in ten months. The improvement in market momentum coincided with sustained strong demand for the network’s infrastructure, fuelling investor interest in SOL.
Overall, the fundamental picture remains moderately positive: Solana continues to attract significant on-chain demand, while its DEX segment maintains a strong position in the cryptocurrency market. The main risk remains the token’s dependence on overall sector sentiment and the sustainability of current network activity.
The Solana (SOLUSD) outlook is favourable.
Technical outlook
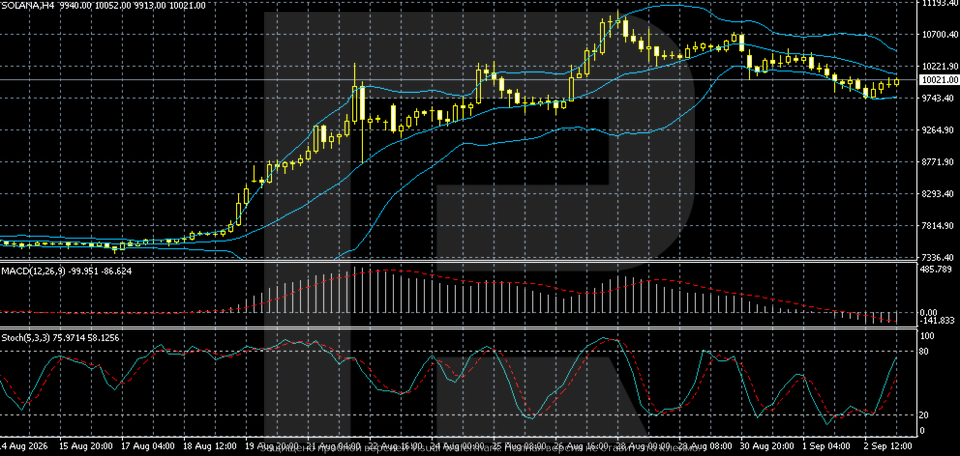
On the H4 chart, SOLUSD entered a correction phase after rallying towards the 111–112 area and is now trading near 100.2. The price rebounded from the lower Bollinger Band near 97.4 but remains below the indicator’s middle line. Therefore, the current rebound improves the short-term picture but does not yet confirm a full-fledged return of buyers.
The nearest resistance level is located at 102.2. Consolidation above this mark would open the door for a recovery towards 107.0 and then 111.9. The key support level lies at 97.4, followed by 92.6. As long as SOL remains above 97.4, a recovery remains possible, while a breakout below this level would confirm a continued correction.
MACD remains in negative territory and indicates ongoing selling pressure, although the downward momentum is beginning to stabilise. The Stochastic Oscillator has turned sharply higher from oversold territory and approached 80, confirming the rebound while also increasing the risk of a local pause. The baseline scenario remains movement within the 97.4–102.2 range with an attempt to recover.
SOLUSD overview
- Asset: SOLUSD
- Timeframe: H4 (intraday)
- Trend: neutral-to-bullish with a short-term correction
- Key resistance levels: 102.2 and 107.0
- Key support levels: 97.4 and 92.6
Solana trading scenarios for today
Main scenario (Buy Stop)
Consolidation above the 102.2 resistance level would confirm increased buying pressure and create conditions for a continued SOLUSD recovery.
- Current price: 100.2
- Entry level: 102.3
- Take profit: 107.0
- Stop loss: 99.9
- Risk-to-reward ratio: approximately 1:2
The trade idea is valid until 8:00 AM on 5 September 2026 (server time, UTC+3).
Alternative scenario (Sell Stop)
A breakout and consolidation below the 97.4 support level would confirm a continued correction and open the way towards the next demand zone.
- Entry level: 97.3
- Take profit: 92.6
- Stop loss: 99.8
- Risk-to-reward ratio: approximately 1:1.9
The trade idea is valid until 8:00 AM on 5 September 2026. (server time, UTC+3).
Risk factors
The main risk to the upside scenario remains SOL’s failure to consolidate above the 100–103 zone, which needs to turn from former resistance into support. A deterioration in overall cryptocurrency market sentiment could create additional pressure. At the same time, high activity in Solana’s DEX segment and sustained on-chain demand support the bullish scenario: consolidation above 102.2 would significantly increase the likelihood of a return to 107 and then towards recent highs.
Summary
The Solana price has stabilised, with fundamental support still in place. The SOLUSD forecast for today, 3 September 2026, suggests a steady move towards 107.0.
Editors’ picks
 EURUSD forecast 2026–2027: technical analysis, price levels & predictions
EURUSD has recovered from the July lows and is trading near 1.1545 — back in bullish territory. The pair has reclaimed EMA65 on the daily, formed a bullish EMA crossover on H4, and the US-eurozone GDP gap has narrowed sharply (US 1.5% vs eurozone 1.0%). Goldman Sachs and Deutsche Bank both now target 1.2500 by year-end. A confirmed close above 1.1700 opens the path to 1.1805. We break down the key levels, three trading scenarios, and what the unprecedented 9-3 FOMC dissent vote means for EURUSD.
 Gold (XAUUSD) forecast 2026: technical analysis, price levels & predictions
Gold has reversed its downtrend and is trading near 4,360 USD, back above both EMA65 and EMA200. ETF flows turned positive in July with 3 billion USD of net inflows, and central banks bought 288.9 tonnes in Q2 — up 62% year-on-year. A breakout above 4,500 USD opens the path to 4,855 USD and the 5,597 USD all-time high. We break down the key levels, three trading scenarios with entry triggers, and what J.P. Morgan, Deutsche Bank and Goldman Sachs are forecasting for gold in 2026.
Forecasts presented in this section only reflect the author’s private opinion and should not be considered as guidance for trading. RoboForex bears no responsibility for trading results based on trading recommendations described in these analytical reviews.