
SOLUSD loses ground amid weakening institutional demand
The SOLUSD rate is declining amid a drop in institutional inflows into spot ETFs, with the price currently at 101.17. Discover more in our analysis for 10 September 2026.
SOLUSD forecast: key takeaways
- SOLUSD quotes are declining for the fourth consecutive trading session
- Five large whales have shown interest in SOL near current levels
- SOLUSD forecast for 10 September 2026: 84.05
Fundamental analysis
SOLUSD has declined for the fourth consecutive trading session. Sellers are aiming to test the key 98.35 USD support level; a breakout below this mark would confirm the formation of a Double Top pattern and open the door for a further decline towards 88.45 USD.
Additional pressure on SOLUSD comes from a sharp slowdown in inflows into spot Solana ETFs. According to SoSoValue, net inflows into nine funds totalled just 6.18 million USD in the week to 4 September, compared to 153.87 million USD a week earlier, representing a decline of around 96%. At the same time, the funds’ total assets decreased only slightly to 1.41 billion USD, while weekly net flows remained positive. Overall, while the data does not yet indicate a broad investor exodus from SOLUSD, it does point to a significant weakening of institutional demand following strong capital inflows in late August.
At the same time, large market participants are showing interest in SOL near current levels. According to CoinGlass, five large addresses opened long positions in Solana totalling approximately 9.11 million USD between 7 and 8 September, when the cryptocurrency was trading in the 100.00–103.00 USD range. This may indicate that major investors expect prices to recover.
Technical outlook
The SOLUSD price has consolidated below the EMA-65, indicating easing buying pressure. The SOLUSD forecast for today suggests a further downward move towards 84.05 USD.
The technical picture indicates a high probability of this scenario materialising. The Stochastic Oscillator has formed a bearish crossover, confirming increased selling pressure. A breakout below the lower boundary of the ascending channel, followed by consolidation below 98.65 USD, would further confirm continued declines. This scenario would increase the likelihood of completing a Double Top pattern and strengthen the downward momentum.
An alternative scenario suggests stronger buying pressure. If the price breaks above the upper boundary of the current consolidation and consolidates above 110.05 USD, this would signal the end of the corrective move and open the wat for a new upward impulse.
SOLUSD overview
- Asset: SOLUSD
- Timeframe: H4 (intraday)
- Trend: bearish
- Key resistance levels: 110.05 and 115.00
- Key support levels: 98.65 and 84.05
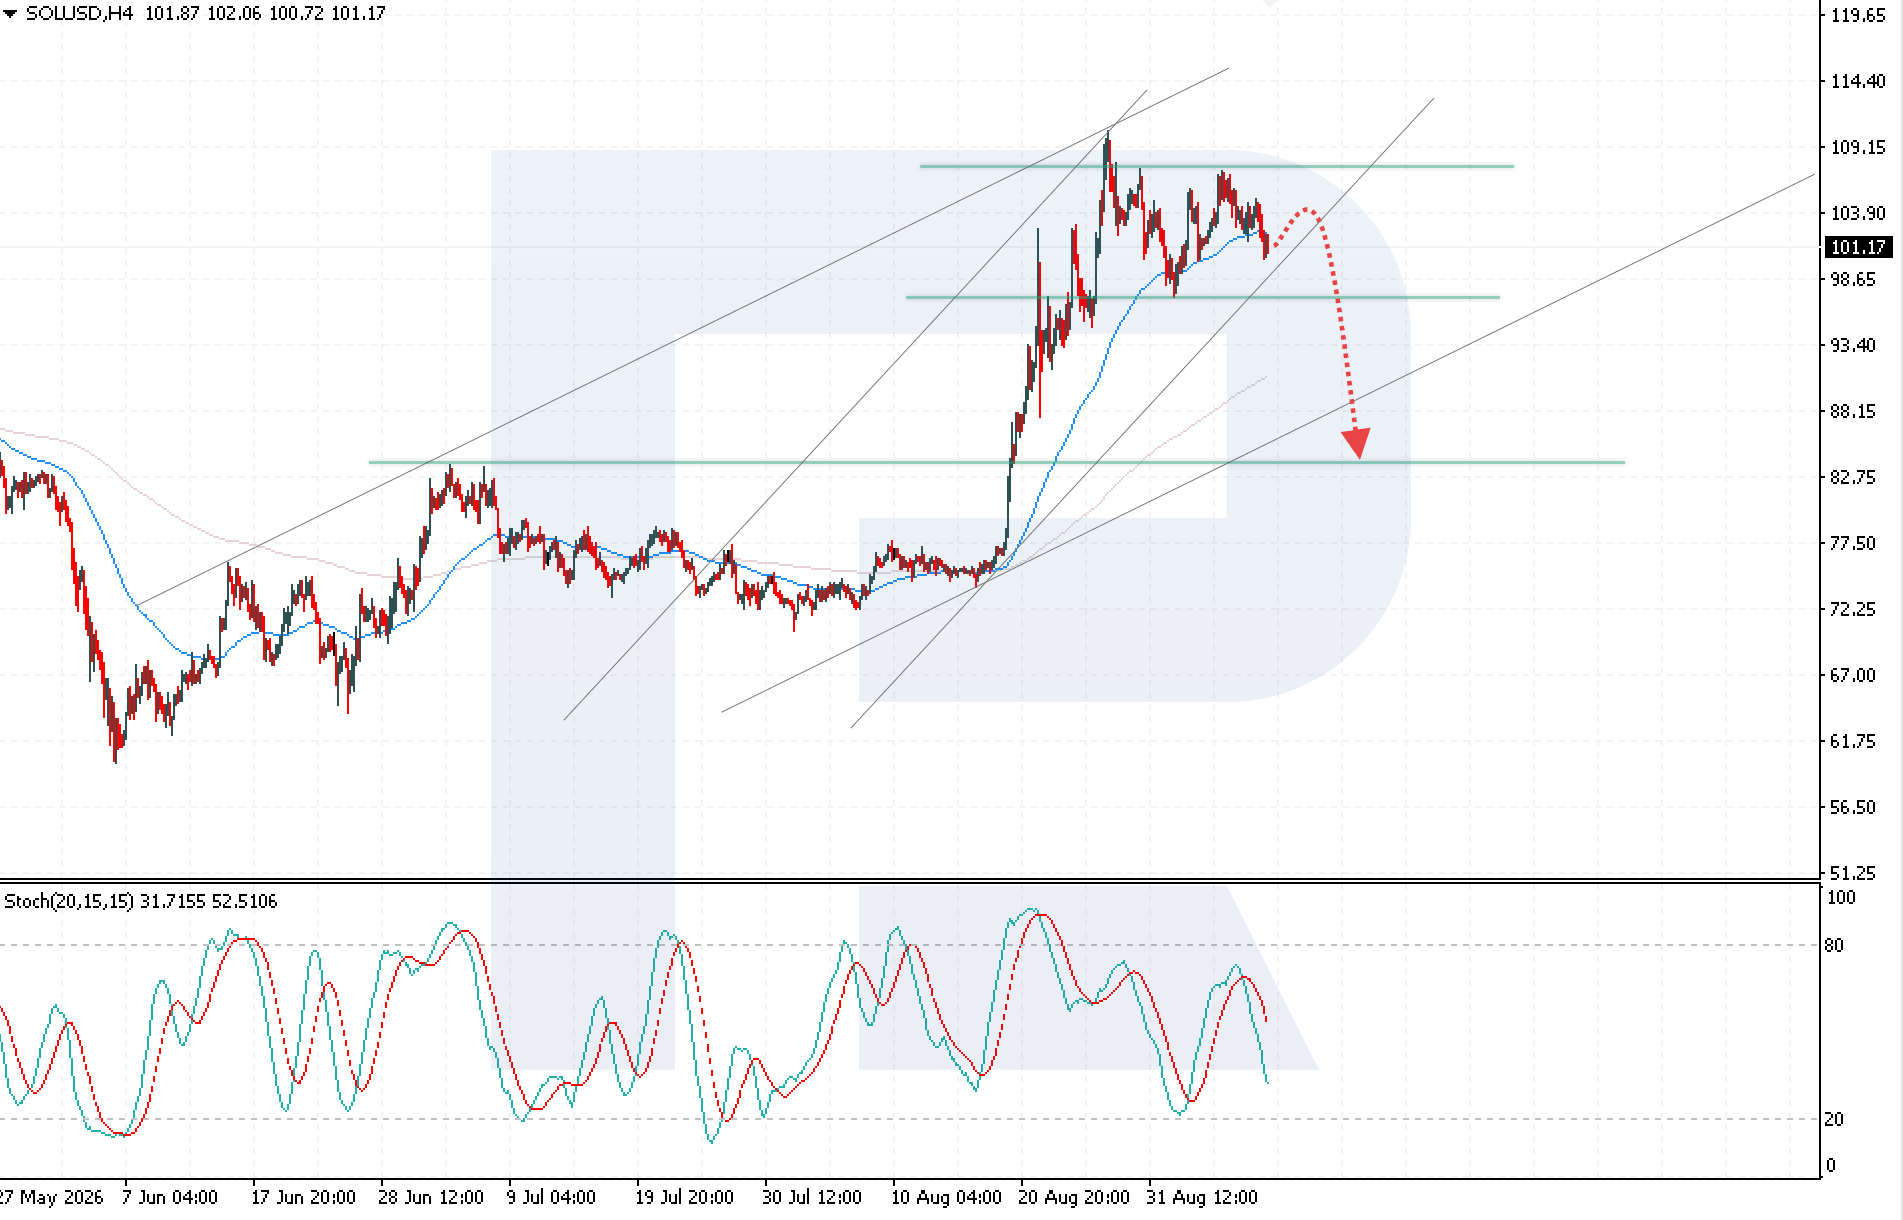
Solana trading scenario for today
Trading scenario (Sell Stop)
A further decline, with the price consolidating below 98.65, would indicate a breakout below the lower boundary of the bullish channel and create conditions for a new downward momentum.
- Current price: 101.17
- Entry level: 98.65
- Take profit: 84.05
- Stop loss: 105.05
- Risk-to-reward ratio: more than 1:2
The trade idea is valid until 8:00 AM on 15 September 2026 (server time, UTC+3).
Risk factors
The main risk to the SOLUSD bearish scenario is a breakout above the resistance level, followed by consolidation above 110.05 USD, which would signal the end of the corrective move and a transition to a new upward impulse.
Summary
The current decline in the Solana price is driven by a sharp 96% drop in institutional demand. However, the potential for a full-blown bearish reversal remains limited, as major market participants are showing a willingness to defend current levels.
Editors’ picks
 EURUSD forecast 2026–2027: technical analysis, price levels & predictions
EURUSD has recovered from the July lows and is trading near 1.1545 — back in bullish territory. The pair has reclaimed EMA65 on the daily, formed a bullish EMA crossover on H4, and the US-eurozone GDP gap has narrowed sharply (US 1.5% vs eurozone 1.0%). Goldman Sachs and Deutsche Bank both now target 1.2500 by year-end. A confirmed close above 1.1700 opens the path to 1.1805. We break down the key levels, three trading scenarios, and what the unprecedented 9-3 FOMC dissent vote means for EURUSD.
 Gold (XAUUSD) forecast 2026: technical analysis, price levels & predictions
Gold has reversed its downtrend and is trading near 4,360 USD, back above both EMA65 and EMA200. ETF flows turned positive in July with 3 billion USD of net inflows, and central banks bought 288.9 tonnes in Q2 — up 62% year-on-year. A breakout above 4,500 USD opens the path to 4,855 USD and the 5,597 USD all-time high. We break down the key levels, three trading scenarios with entry triggers, and what J.P. Morgan, Deutsche Bank and Goldman Sachs are forecasting for gold in 2026.
Forecasts presented in this section only reflect the author’s private opinion and should not be considered as guidance for trading. RoboForex bears no responsibility for trading results based on trading recommendations described in these analytical reviews.