
SOLUSD strengthens amid record inflows into Solana ETFs
SOLUSD is strengthening amid strong buyer demand and positive developments within the Solana ecosystem. The current price is 119.48. Find out more in our analysis for 1 October 2026.
SOLUSD forecast: key takeaways
- US spot Solana ETFs attracted around 188 million USD over the past week
- The current combination of factors continues to support the bullish SOLUSD scenario
- SOLUSD forecast for 1 October 2026: 130.00
Fundamental analysis
SOLUSD is rising today after rebounding from the 117.20 USD support level. The nearest resistance is located at 121.85 USD. The asset is being supported by strong buyer demand and record capital inflows into US spot Solana ETFs. Over the past week, the funds attracted around 188 million USD.
Another positive factor is the increase in activity within the Solana ecosystem. Network TVL has recovered above 6.5 billion USD, while stablecoin volume has reached a new high of around 17.39 billion USD. This indicates growing liquidity and participant activity within the ecosystem.
At the same time, the market continues to monitor the development of the Alpenglow upgrade, which is expected to reduce transaction finality time to around 150 ms.
Against this backdrop, the SOLUSD forecast for 1 October 2026 remains bullish.
Technical outlook
SOLUSD has consolidated above the EMA-65 line, although the risk of a Triangle pattern forming remains. Today's SOLUSD forecast suggests a continuation of the upward move towards the 130.00 target.
The technical picture indicates that the bullish scenario remains intact. The Stochastic Oscillator is rebounding from a support line near the oversold zone, suggesting that upward momentum could strengthen. An additional bullish signal would be a breakout above the upper boundary of the Triangle pattern followed by consolidation above 121.65. In this case, buyer demand could increase, creating conditions for further growth towards the 130.00 target.
The alternative scenario would be activated if the price breaks below the lower boundary of the bullish channel and consolidates below 114.05. Such a signal would indicate weakening buyer pressure and increase the likelihood of a downward correction.
SOLUSD overview
- Asset: SOLUSD
- Timeframe: H1 (Intraday)
- Trend: bullish
- Key resistance levels: 121.65 and 124.05
- Key support levels: 117.20 and 114.05
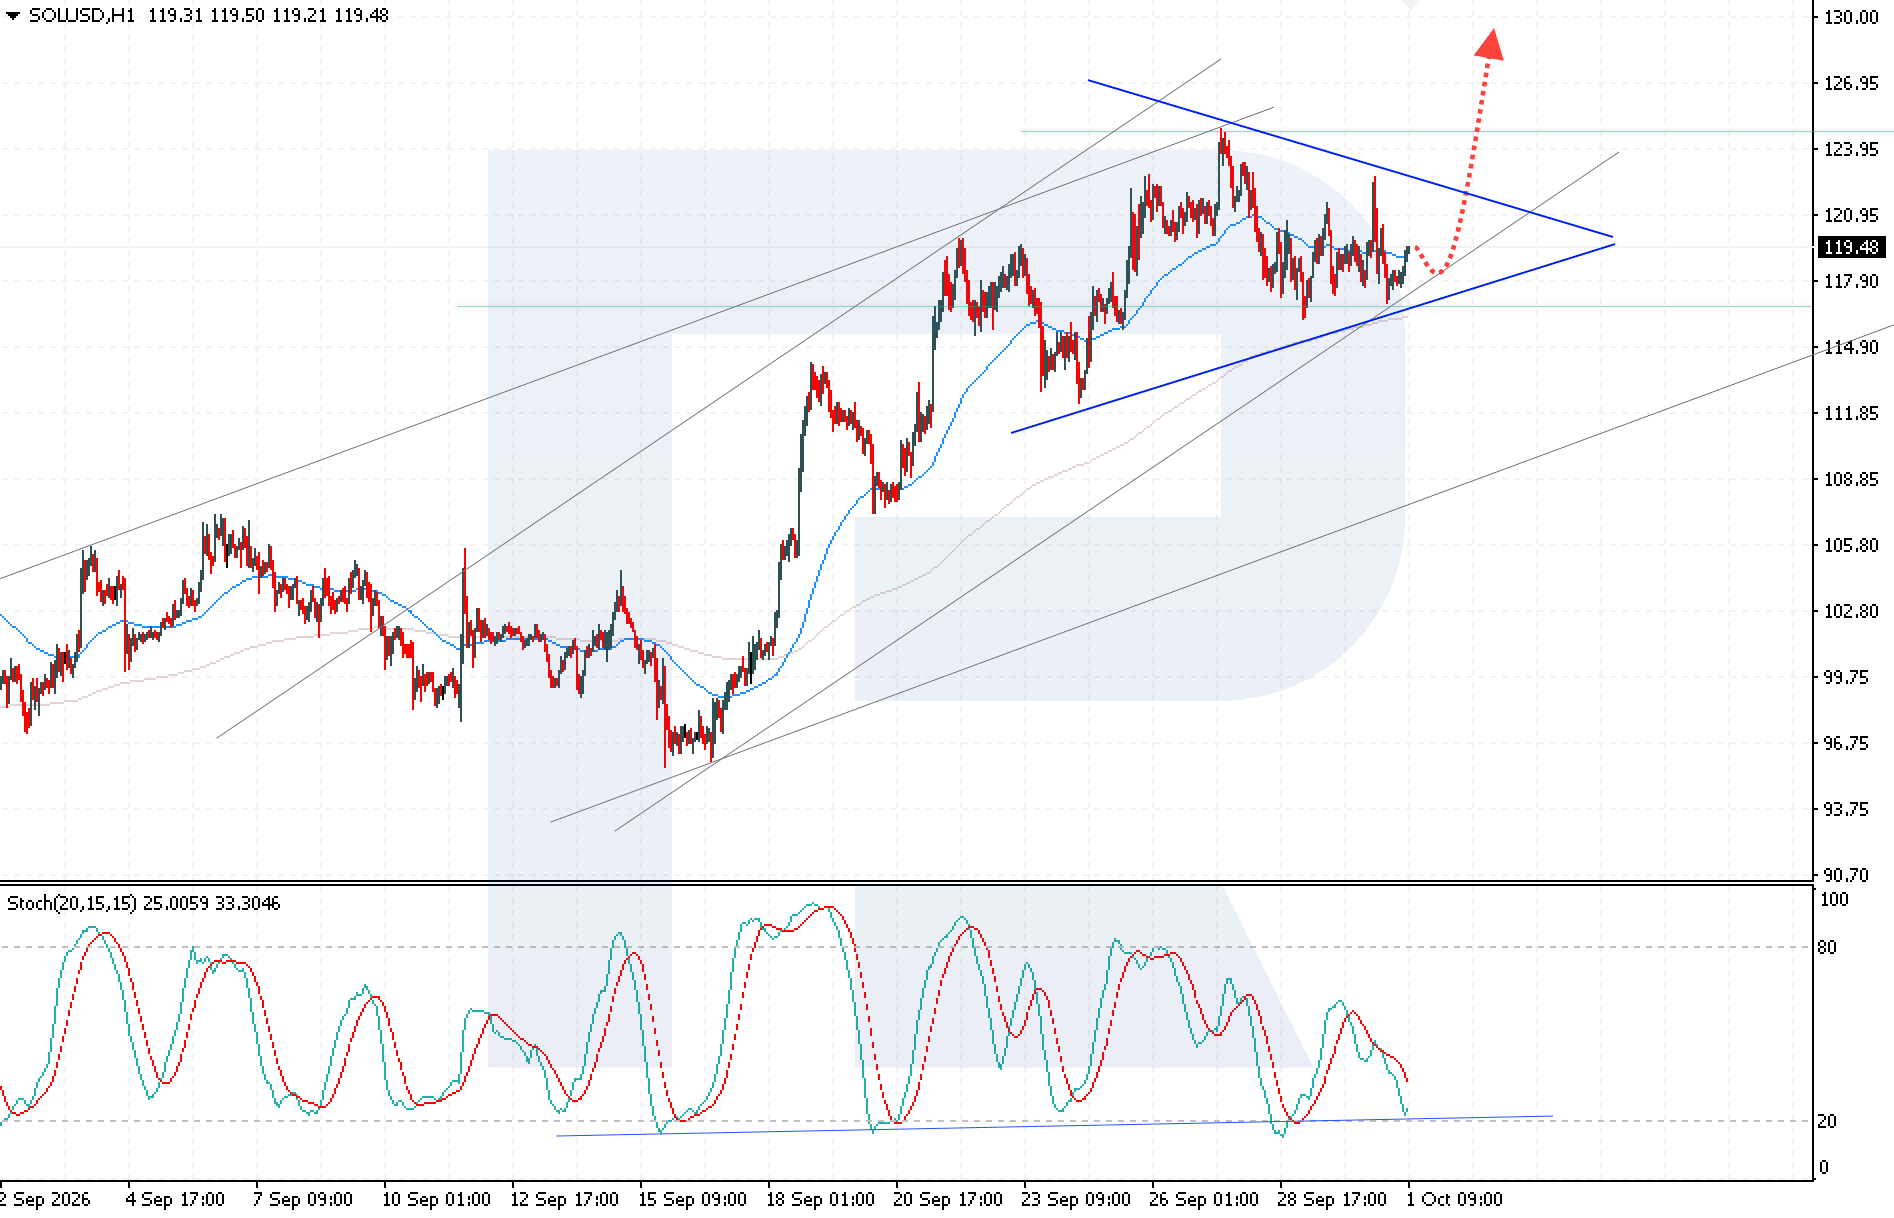
Solana trading scenario for today
Trading scenario (Buy Stop)
Consolidation of SOLUSD above the upper boundary of the Triangle pattern, with a breakout above 121.65, would create conditions for opening long positions with a target at 130.00.
- Current price: 119.48
- Entry level: 121.65
- Take Profit: 130.00
- Stop Loss: 118.05
- Risk-to-reward ratio: above 1:2
The trade idea is valid until 08:00 AM on 6 October 2026 (server time, UTC+3).
Risk factors
The bullish SOLUSD scenario remains at risk if buyers fail to overcome the 121.85 USD resistance level and consolidate above it. A decline below the 114.05 USD support level would provide an additional negative signal, potentially increasing selling pressure and leading to a downward correction.
Summary
SOLUSD retains the potential to continue rising after rebounding from the 117.20 USD support level, while a breakout above the 121.85 USD resistance level could strengthen the upward momentum. Sustained strong demand, supported by capital inflows into ETFs and growing activity within the ecosystem, underpins the bullish SOLUSD forecast for 1 October 2026.
Editors’ picks
 EURUSD forecast 2026–2027: technical analysis, price levels & predictions
The EURUSD outlook for 2026 and 2027: key levels on the daily chart, three trading scenarios and the policy gap between the Fed and the ECB that drives the pair.
 Gold (XAUUSD) forecast 2026: technical analysis, price levels & predictions
Where gold could trade in 2026: key levels, three trading scenarios with entry triggers and the forecasts from J.P. Morgan, Deutsche Bank and Goldman Sachs.
Forecasts presented in this section only reflect the author’s private opinion and should not be considered as guidance for trading. RoboForex bears no responsibility for trading results based on trading recommendations described in these analytical reviews.