
SOLUSD retains upside potential following a correction
SOLUSD is declining for the fourth consecutive trading session amid capital outflows from ETFs, with the price currently standing at 102.35. For more details, see our analysis for 15 October 2026.
SOLUSD forecast: key takeaways
- SOLUSD has declined for the fourth consecutive trading session
- US spot Solana ETFs recorded outflows of around 1.3 million USD during the 14 October session
- SOLUSD forecast for 15 October 2026: 115.05
Fundamental analysis
The Solana price is declining for the fourth consecutive trading session, with the nearest strong support level at 96.85 USD. Quotes remain under pressure amid weakening institutional demand. US spot Solana ETFs recorded outflows of around 1.3 million USD in the 14 October trading session, indicating investor caution and potentially limiting the cryptocurrency's short-term recovery potential.
Negative investment flows had also been observed earlier. In the week ending 9 October, outflows from US spot Solana ETFs amounted to around 24.8 million USD, ending a prolonged run of inflows. Weaker institutional demand increases the risk of a further SOLUSD correction.
Nevertheless, the fundamental backdrop retains positive factors. Solana developers are preparing to activate the Alpenglow upgrade, scheduled for 21 October. It is designed to substantially reduce transaction confirmation times and improve network efficiency. Anticipation of this technological upgrade could support investor interest in SOLUSD.
Technical outlook
SOLUSD prices are falling but continue to form a Wedge reversal pattern. Today's SOLUSD forecast anticipates renewed growth towards the 115.05 USD target.
The technical outlook suggests that the bullish scenario may materialise. The Stochastic Oscillator has reached oversold territory and formed a bullish crossover, signalling a potential strengthening of buying momentum. A breakout above the upper boundary of the Wedge pattern and a sustained move above 105.05 USD would provide further confirmation. This would increase the likelihood that the reversal pattern has completed and set the stage for further growth towards the 115.05 USD target.
An alternative scenario anticipates a continued decline. If the price breaks below the lower boundary of the Wedge pattern and consolidates beneath it, the bullish scenario would be at risk, and selling pressure would intensify. In this case, the likelihood of a further SOLUSD correction would increase.
SOLUSD overview
- Asset: SOLUSD
- Timeframe: H1 (intraday)
- Trend: correction
- Key resistance levels: 105.05 and 112.15
- Key support levels: 100.00 and 96.85
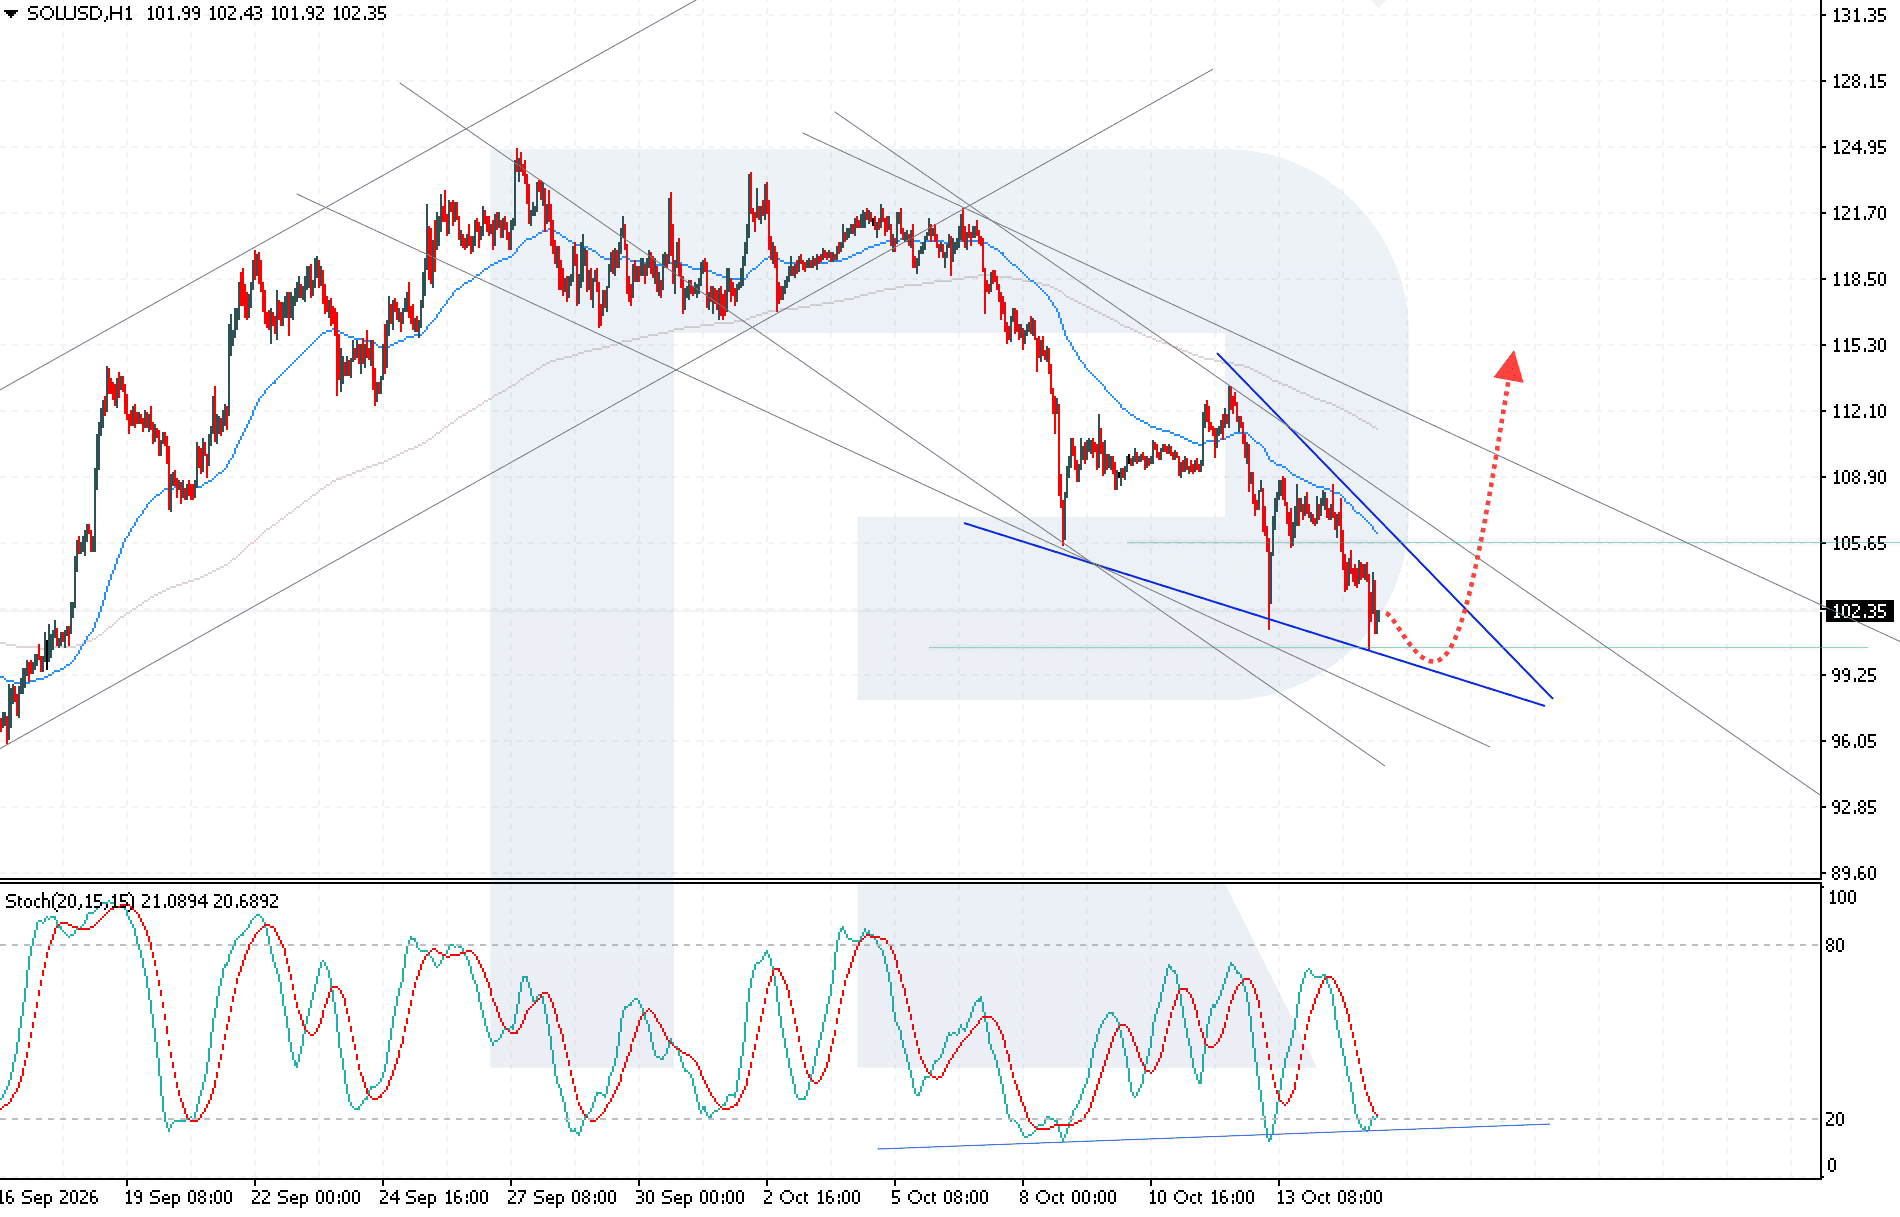
Solana trading scenario for today
Trading scenario (Buy Stop)
A breakout above the upper boundary of the Wedge reversal pattern, with the Solana price consolidating above 105.05, would confirm the end of the correction and open the door for renewed upward momentum.
- Current price: 102.35
- Entry level: 105.05
- Stop loss: 102.05
- Take profit: 115.35
- Risk-to-reward ratio: 1:3
The trade idea is valid until 8:00 AM on 20 October 2026 (server time, UTC+3).
Risk factors
The main risks to the bullish SOLUSD scenario are linked with continued ETF capital outflows and weakening institutional demand, which could increase selling pressure. If the price fails to consolidate above 105.05 USD and breaks below the lower boundary of the Wedge pattern, the bullish scenario will be invalidated.
Summary
The SOLUSD forecast for 15 October 2026 indicates that the price remains under selling pressure amid continued ETF capital outflows. However, the formation of a Wedge reversal pattern and a bullish Stochastic Oscillator crossover suggest a potential recovery. A consolidation above 105.05 USD would create conditions for a rise towards 115.05 USD.
Editors’ picks
 EURUSD forecast 2026–2027: technical analysis, price levels & predictions
The EURUSD outlook for 2026 and 2027: key levels on the daily chart, three trading scenarios and the policy gap between the Fed and the ECB that drives the pair.
 Gold (XAUUSD) forecast 2026: technical analysis, price levels & predictions
Where gold could trade in 2026: key levels, three trading scenarios with entry triggers and the forecasts from J.P. Morgan, Deutsche Bank and Goldman Sachs.
Forecasts presented in this section only reflect the author’s private opinion and should not be considered as guidance for trading. RoboForex bears no responsibility for trading results based on trading recommendations described in these analytical reviews.