
XRP (XRPUSD): pressure has become the norm, but what comes next?
The XRP (XRPUSD) price is near 0.9984. Signals for the token remain mixed. For more details, see our analysis for 19 August 2026.
XRPUSD forecast: key takeaways
- The XRP (XRPUSD) price has stabilised after a prolonged decline, but the outlook remains bearish
- Inflows into the token have fallen to their lowest level since 2021
- XRPUSD forecast for 19 August 2026: 0.9950 or 1.0070
Fundamental analysis
The XRP (XRPUSD) rate is recovering towards 0.9984.
The fundamental backdrop for XRPUSD remains mixed. In mid-August, the token fell below the psychologically important 1 USD level and is trading around 0.98 USD, its lowest since November 2024. At the same time, inflows into US spot XRP ETFs continue, although their pace has slowed to around 2.25 million USD per week, while total fund assets stand at approximately 1.43 billion USD.
On-chain data also provides no clear signal. The average volume of XRP inflows from large holders to Binance over the past three months fell to around 61 million USD, the lowest level since 2021. However, net flow remains positive at around 18.8 million USD, meaning deposits to the exchange still exceed withdrawals. This indicates lower whale activity but does not rule out continued supply-side pressure.
There is a separate story unfolding around RLUSD. Over the past 30 days, Ripple issued around 449.3 million USD worth of stablecoins on XRPL and burned approximately 448.9 million USD, leaving net supply growth close to zero. This dynamic suggests that RLUSD on the XRP Ledger is mainly being used as a transit instrument for institutional settlements. By comparison, net liquidity inflows on the Ethereum network exceeded 225 million USD over the same period.
Meanwhile, Ripple continues to expand its institutional infrastructure. The company entered into its third partnership in South Korea, this time with Jeonbuk Bank, which will use Ripple Payments for cross-border transfers. Earlier this year, projects with Kyobo Life Insurance and Kbank were announced. However, the new partnerships have yet to translate into sustained XRP price growth. A more positive signal is coming from the derivatives market: options contract volume is estimated at around 2.78 billion USD, while bullish bets outnumber bearish ones by roughly three to one.
The XRP (XRPUSD) outlook is moderately negative.
Technical outlook
On the H4 chart, XRPUSD maintains a bearish structure, although after the sharp decline in the first half of August, the price began to consolidate around 1.00. Quotes remain within a narrow range and below the middle Bollinger Band, so a full-fledged upward reversal has yet to form.
The nearest resistance is located in the 1.0070–1.0100 area. Consolidation above it would improve the short-term outlook and open the way towards 1.0193 and then 1.0310. The support level lies at 0.9950, with the key lower level at 0.9835. A loss of this zone would confirm the resumption of the downward move.
MACD remains in negative territory, but bearish momentum has weakened noticeably and is approaching the neutral level. The Stochastic Oscillator is near the middle of its range and is not giving a clear signal in either direction. The baseline scenario remains consolidation within the 0.9950–1.0070 range with a neutral-to-negative bias.
XRPUSD overview
- Asset: XRPUSD
- Timeframe: H4 (intraday)
- Trend: bearish with consolidation
- Key resistance levels: 1.0070 and 1.0193
- Key support levels: 0.9950 and 0.9835
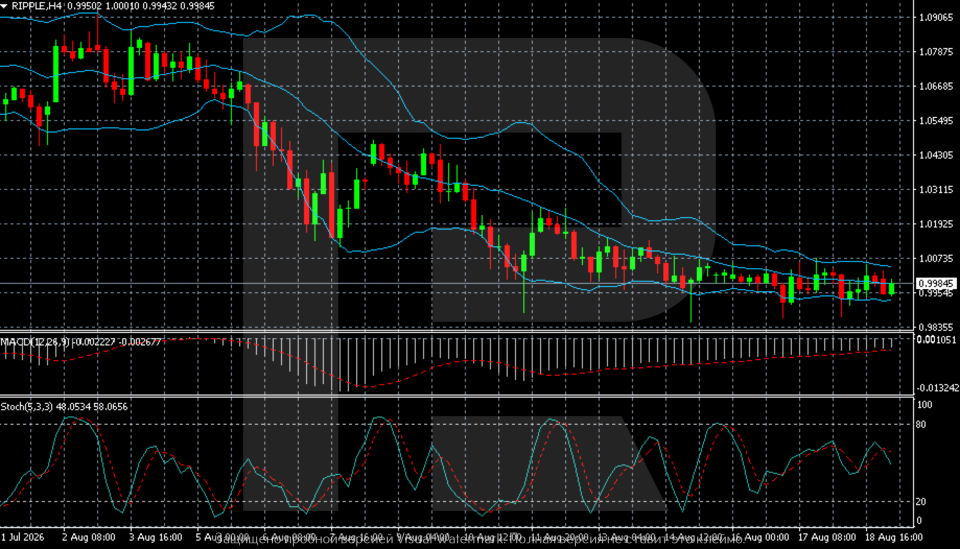
XRP trading scenarios for today
Main scenario (Sell Stop)
A breakout and consolidation below the 0.9950 support level would confirm renewed bearish momentum and create conditions for a further decline.
- Take Profit: 0.9835
- Stop Loss: 1.0030
Alternative scenario (Buy Stop)
A breakout and consolidation above the 1.0070 resistance level would indicate a return of buyers and a more sustained upward correction.
- Take Profit: 1.0193
- Stop Loss: 0.9990
Risk factors
The main risk to the XRPUSD downside scenario is consolidation above 1.0070, which would improve the short-term technical picture. At the same time, weak activity from major holders, positive XRP flows to Binance, and the lack of a noticeable price reaction to new partnerships continue to favour sellers.
Summary
The XRP price is stabilising, but major investors remain almost inactive. The XRPUSD forecast for today, 19 August 2026, expects movement within the 0.9950–1.0070 range, with a slight downside bias.
Editors’ picks
 EURUSD forecast 2026–2027: technical analysis, price levels & predictions
EURUSD has pulled back from the 2026 high of 1.1915 and is now trading near 1.1450 — below both EMA65 and EMA200 — with the active scenario shifting from bullish to bearish. The ECB raised rates to 2.40%, but the Fed holds at 3.75%, and US inflation (3.5%) continues to outpace the eurozone (2.8%). A confirmed break below 1.1280 opens the next downward wave toward 1.1080. We break down the key levels, three trading scenarios with entry triggers, and what Deutsche Bank, Morgan Stanley and UBS are forecasting for EURUSD in 2026.
 Gold (XAUUSD) forecast 2026: predictions based on fundamental and technical analysis
Gold has corrected over 25% from its all-time high of 5,597 USD and is now trading near 4,100 USD — testing a critical support zone. Is this the bottom, or will the downtrend continue? We break down the key levels (support 3,920 USD, breakout trigger 4,500 USD), three trading scenarios with entry levels, and what J.P. Morgan, Goldman Sachs and Deutsche Bank are forecasting for gold in 2026.
Forecasts presented in this section only reflect the author’s private opinion and should not be considered as guidance for trading. RoboForex bears no responsibility for trading results based on trading recommendations described in these analytical reviews.