EURUSD corrects within a Triangle pattern
The EURUSD pair is forming a corrective move after two sessions of gains amid a weaker US dollar and expectations of key US macroeconomic releases, with the rate currently at 1.1905. Discover more in our analysis for 10 February 2026.
EURUSD forecast: key takeaways
- Chinese regulators recommended that financial institutions reduce investments in US Treasury bonds
- Investors have shifted focus to US macroeconomic releases
- The market is pricing in the Fed keeping rates unchanged in March and cutting them twice this year
- EURUSD forecast for 10 February 2026: 1.1985
Fundamental analysis
The EURUSD rate has entered a correction phase after rising for two consecutive trading sessions. Buyers tested the local resistance level at 1.1925 but failed to consolidate above it. At the same time, the market is holding the price above the 1.1885 support level, suggesting the potential for continued bullish momentum.
The US dollar remains under pressure amid reports that Chinese regulators advised financial institutions to cut their exposure to US Treasury bonds. These measures aim to reduce concentration risks and lessen dependence on the uncertain US economic policy, which increases pressure on the US dollar.
Investors remain focused on key US macroeconomic releases that could influence expectations for the Federal Reserve’s monetary policy. Labour market data for January will be released on Wednesday, while the January consumer price report is due on Friday. Market participants view keeping the interest rate unchanged at the March meeting as the baseline scenario, with expectations of two rate cuts this year already priced in.
Technical outlook
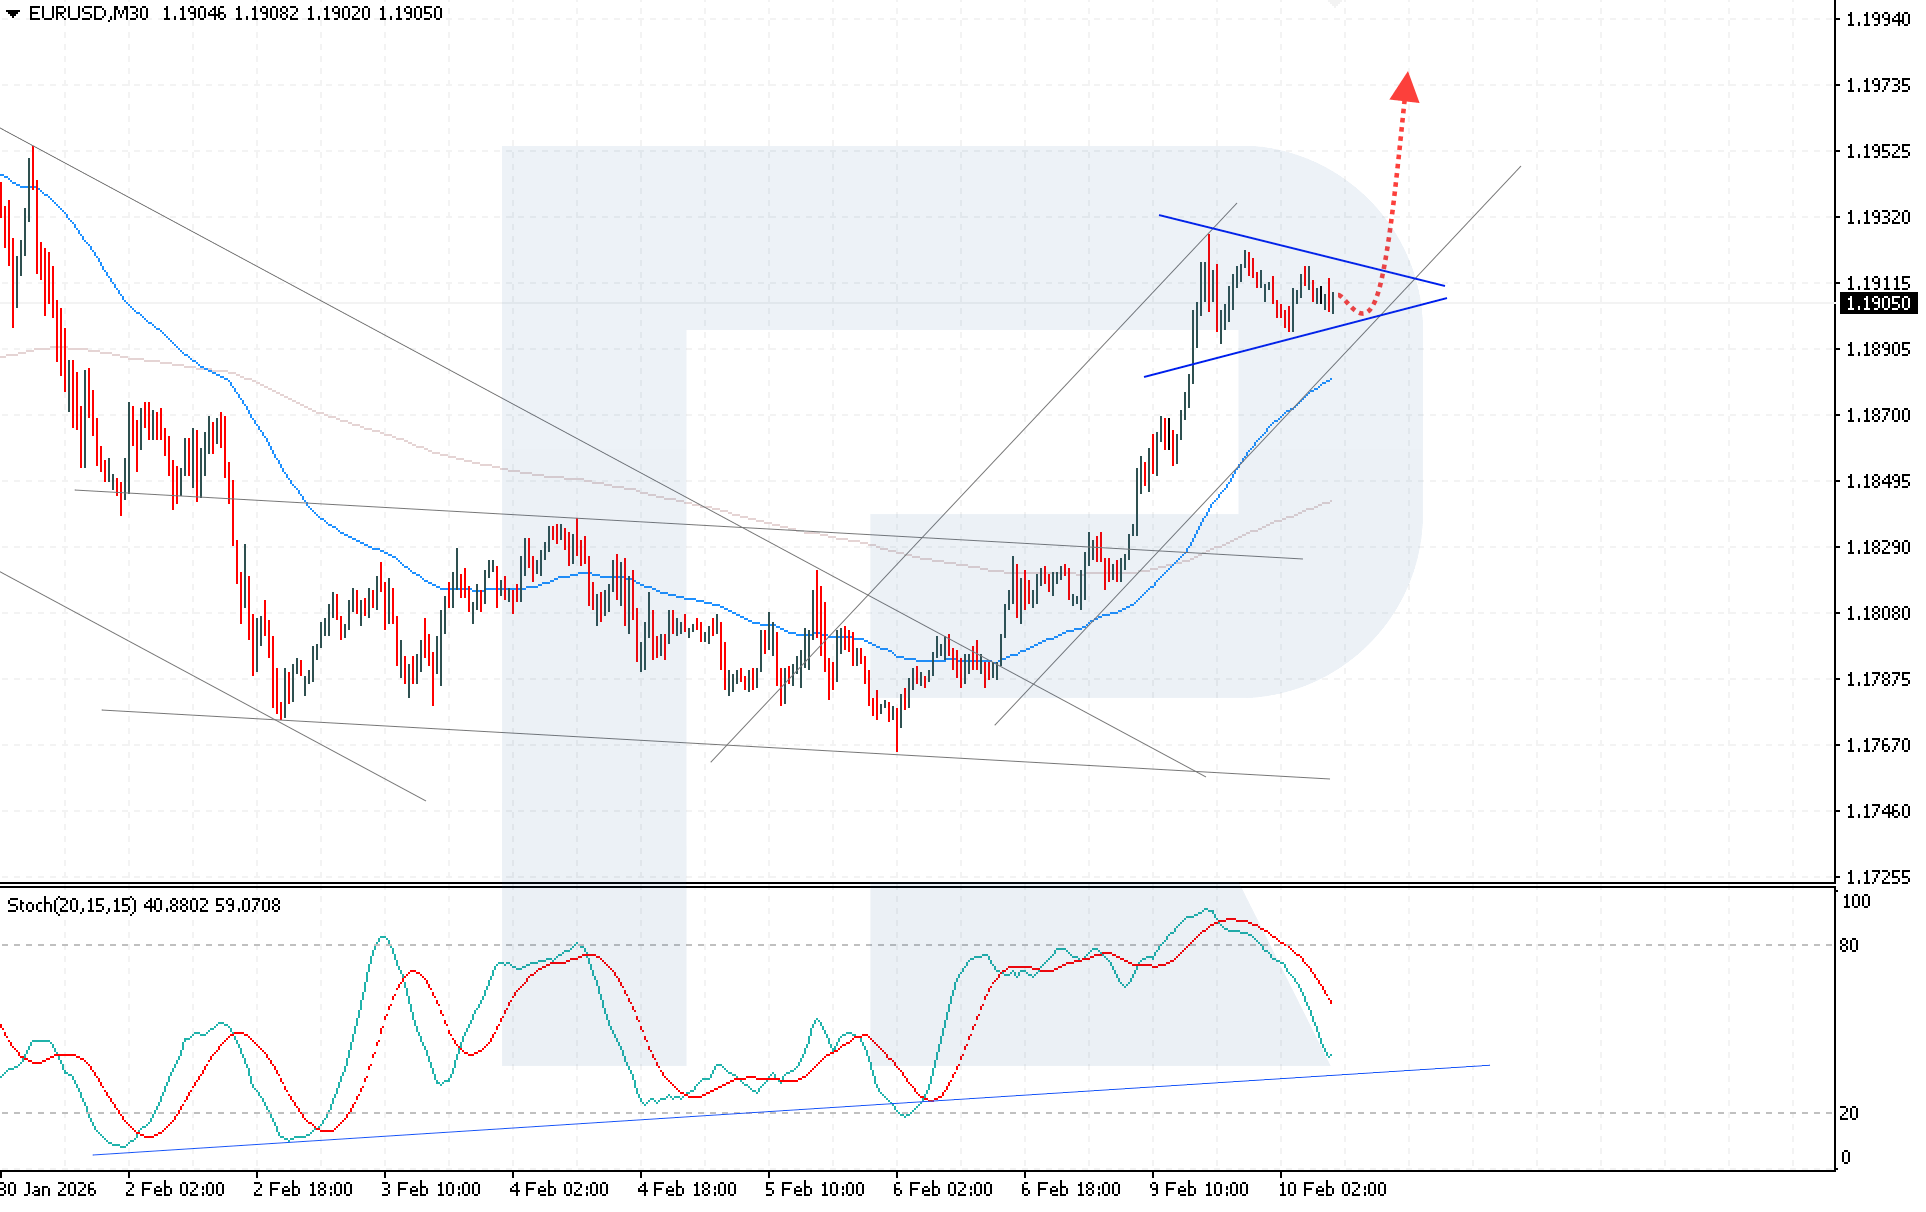
EURUSD quotes are undergoing a correction within a Triangle pattern, indicating a consolidation phase and a pause in the bullish momentum. Buyers are confidently holding the price above the EMA-65, which preserves the upward market structure and confirms the dominance of the bullish scenario.
Today’s EURUSD forecast suggests renewed growth after a rebound from the lower boundary of the Triangle pattern, with a target at 1.1985. The Stochastic Oscillator further confirms the bullish scenario. Its signal lines have exited overbought territory and moved closer to the support line, increasing the probability of a renewed upward impulse.
The key technical condition for the upside scenario remains consolidation above the 1.1915 resistance level. This signal would confirm a breakout above the upper boundary of the Triangle pattern and significantly increase the likelihood of reaching the target level of 1.1985.
EURUSD overview
- Asset: EURUSD
- Timeframe: M30 (Intraday)
- Trend: bullish
- Key resistance levels: 1.1935 and 1.1975
- Key support levels: 1.1890 and 1.1835
EURUSD trading scenarios for today
Main scenario (Buy Stop)
A breakout above the upper boundary of the Triangle pattern and consolidation above 1.1915 would create conditions for opening long positions. The pattern’s target is the 1.1975 level. The risk-to-reward ratio is 1:4, with a potential profit of about 60 pips and a risk of around 15 pips.
- Take Profit: 1.1975
- Stop Loss: 1.1900
Alternative scenario (Sell Stop)
A breakout below the lower boundary of the Triangle pattern with consolidation below 1.1890 will increase selling pressure and lead to the cancellation of the bullish scenario.
- Take Profit: 1.1835
- Stop Loss: 1.1915
Risk factors
Risks to the bullish scenario will increase if the EURUSD rate returns below the 1.1885 support level and breaks below the EMA-65, forming a signal for a deeper bearish correction. Fundamental pressure may intensify after the release of strong US macroeconomic data that could support the US dollar and shift market expectations towards a more hawkish Fed policy.
Summary
Technical analysis of EURUSD indicates that the bullish scenario remains in place, with growth likely to continue towards 1.1985, provided prices consolidate above the 1.1930 resistance level and confirm a breakout above the upper boundary of the Triangle pattern.
Editors’ picks
 EURUSD 2026-2027 forecast: key market trends and future predictions
This article provides the EURUSD forecast for 2026 and 2027 and highlights the main factors determining the direction of the pair’s movements. We will apply technical analysis, take into account the opinions of leading experts, large banks, and financial institutions, and study AI-based forecasts. This comprehensive insight into EURUSD predictions should help investors and traders make informed decisions.
 Gold (XAUUSD) forecast 2026 and beyond: expert insights, price predictions, and analysis
Dive deep into the Gold (XAUUSD) price outlook for 2026 and beyond, combining technical analysis, expert forecasts, and key macroeconomic factors. It explains the drivers behind gold’s recent surge, explores potential scenarios including a move toward 4,500 to 5,000 USD per ounce, and highlights why the metal remains a strong hedge during global uncertainty.
Forecasts presented in this section only reflect the author’s private opinion and should not be considered as guidance for trading. RoboForex bears no responsibility for trading results based on trading recommendations described in these analytical reviews.