USDJPY on hold, but this is temporary: the yen has many supporting factors
The USDJPY pair rose to 153.78. The current correction does not cancel the overall strength of the yen. Find more details in our analysis for 30 January 2026.
USDJPY forecast: key takeaways
- The USDJPY pair has corrected, but the sentiment remains bearish
- Rumours of interventions continue to bolster the yen
- USDJPY forecast for 30 January 2026: 152.00
Fundamental analysis
On Friday, the USDJPY rate stabilised near 153.78. On a monthly basis, the yen remains in positive territory, marking its first monthly gain since August. Throughout January, the JPY was supported by discussions about a possible currency intervention. Against this backdrop, the yen rose to four-month highs, despite the lack of evidence of any real actions by the authorities.
Since the start of the month, the yen has strengthened by almost 2%, and by up to 4.6% from the January lows. The rally was initially boosted by reports that the New York Fed had checked levels in the USDJPY pair. This fuelled speculation about possible coordination between the US and Japan, although US Treasury Secretary Scott Bessent did not confirm these assumptions.
Nevertheless, market participants remain cautious amid a series of verbal interventions by Japanese officials, not ruling out unilateral actions by Tokyo. Macroeconomic data from Japan is mixed. Retail sales in December unexpectedly declined, while industrial production contracted less than anticipated, partially limiting pressure on the yen.
The USDJPY outlook is mixed.
Technical outlook
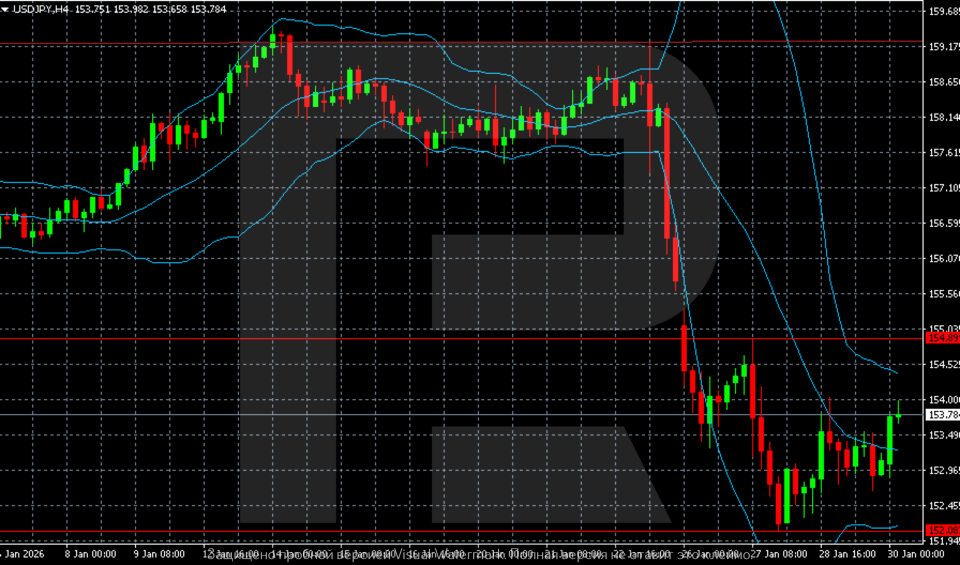
On the USDJPY H4 chart, after an attempt to extend the rally in the first half of the month, a sharp downside reversal formed. The price failed to hold above the 158.50–159.00 area, where a series of rejections occurred. This was followed by a sharp decline with a breakout below the middle line and the lower boundary of Bollinger Bands.
The decline developed at an accelerated pace. Within a short period, quotes moved several figures lower, breaking below the key support level around 154.90. This move was accompanied by an expansion of Bollinger Bands, indicating rising volatility and seller dominance. A low was formed in the 152.00–152.20 zone, from which a technical rebound followed.
The pair is currently consolidating in the 153.00–154.00 range, trading below the middle Bollinger Band. The structure remains bearish: the sequence of highs and lows is declining, and the recovery appears corrective. The nearest resistance level lies in the 154.80–155.00 area; a breakout above it would be required to ease downside pressure. The support level remains around 152.00, with a retest possible if selling resumes.
USDJPY overview
- Asset: USDJPY
- Timeframe: H4 (Intraday)
- Trend: bearish
- Key resistance levels: 154.80 and 155.00
- Key support levels: 152.00 and 151.50
USDJPY trading scenarios for today
Main scenario (Sell Stop)
After a sharp downside reversal and a breakout below key support levels, the USDJPY structure remains bearish. The price failed to hold above the 158.50–159.00 zone and fell sharply, breaking below the middle Bollinger Band. The current consolidation in the 153.00–154.00 range is corrective in nature.
A consolidation below 152.90 will confirm renewed bearish momentum and create conditions for a decline towards the 151.50–151.00 area. The risk-to-reward ratio exceeds 1:2, with the move developing amid seller dominance and elevated volatility.
- Sell Stop: 152.90
- Take Profit: 151.00
- Stop Loss: 154.00
Alternative scenario (Buy Stop)
The bearish scenario will be cancelled if the price breaks and consolidates above the 154.80–155.00 resistance zone. In this case, downside pressure will ease, and the upward move may turn into a deeper correction after the January decline.
- Buy Stop: 155.10
- Take Profit: 156.50
- Stop Loss: 153.80
Risk factors
A decline in USDJPY may be limited if the US dollar recovers amid tighter Fed policy expectations. An additional risk factor would be a softening of rhetoric about currency intervention and a more restrained stance from the Bank of Japan, which would reduce support for the yen.
Summary
The USDJPY pair has stabilised, but the yen is closing January on a strong note. The USDJPY forecast for today, 30 January 2026, does not rule out a return towards 152.00.
Editors’ picks
 EURUSD 2026-2027 forecast: key market trends and future predictions
This article provides the EURUSD forecast for 2026 and 2027 and highlights the main factors determining the direction of the pair’s movements. We will apply technical analysis, take into account the opinions of leading experts, large banks, and financial institutions, and study AI-based forecasts. This comprehensive insight into EURUSD predictions should help investors and traders make informed decisions.
 Gold (XAUUSD) forecast 2026 and beyond: expert insights, price predictions, and analysis
Dive deep into the Gold (XAUUSD) price outlook for 2026 and beyond, combining technical analysis, expert forecasts, and key macroeconomic factors. It explains the drivers behind gold’s recent surge, explores potential scenarios including a move toward 4,500 to 5,000 USD per ounce, and highlights why the metal remains a strong hedge during global uncertainty.
Forecasts presented in this section only reflect the author’s private opinion and should not be considered as guidance for trading. RoboForex bears no responsibility for trading results based on trading recommendations described in these analytical reviews.